EUROPEAN ORGANISATION FOR NUCLEAR RESEARCH (CERN)
JHEP 11 (2020) 163
DOI:https://doi.org/10.1007/JHEP11(2020)163
CERN-EP-2020-118 23rd December 2020
Reconstruction and identification of boosted di-𝝉
systems in a search for Higgs boson pairs using
13 TeV proton–proton collision data in ATLAS
The ATLAS Collaboration
In this paper, a new technique for reconstructing and identifying hadronically decaying 𝜏+𝜏− pairs with a large Lorentz boost, referred to as the di-𝜏 tagger, is developed and used for the first time in the ATLAS experiment at the Large Hadron Collider. A benchmark di-𝜏 tagging selection is employed in the search for resonant Higgs boson pair production, where one Higgs boson decays into a boosted 𝑏 ¯𝑏pair and the other into a boosted 𝜏+𝜏−pair, with
two hadronically decaying 𝜏-leptons in the final state. Using 139 fb−1 of proton–proton
collision data recorded at a centre-of-mass energy of 13 TeV, the efficiency of the di-𝜏 tagger is determined and the background with quark- or gluon-initiated jets misidentified as di-𝜏 objects is estimated. The search for a heavy, narrow, scalar resonance produced via gluon–gluon fusion and decaying into two Higgs bosons is carried out in the mass range 1–3 TeV using the same dataset. No deviations from the Standard Model predictions are observed, and 95% confidence-level exclusion limits are set on this model.
© 2020 CERN for the benefit of the ATLAS Collaboration.
Reproduction of this article or parts of it is allowed as specified in the CC-BY-4.0 license.
Contents
1 Introduction 2
2 ATLAS detector 3
3 Data and simulated events 4
4 Object reconstruction 5
5 Reconstruction and identification of boosted hadronically decaying 𝝉+𝝉−pairs 7
6 Event selection and categorisation 12
7 Estimation of the multi-jet background with a misidentified di-𝝉 object 13
8 Data-driven correction of the di-𝝉 tagger efficiency 14
9 Search for resonant Higgs boson pair production in the 𝒃 ¯𝒃𝝉+𝝉−final state 17
10 Conclusion 22
1 Introduction
The discovery of the Higgs boson (𝐻) by the ATLAS and CMS collaborations at the Large Hadron
Collider (LHC) in 2012 [1, 2] opens new ways of probing physics beyond the Standard Model (SM),
since the Higgs boson may itself appear as one of the intermediate states in the decay of new resonances. Various final states have been used by ATLAS and CMS in searches for both resonant and non-resonant
𝐻 𝐻production [3–8]. In the high-mass regime, for resonance masses typically above 1 TeV, the Higgs
bosons may be produced with large momenta, causing their decay products to be collimated. The standard reconstruction techniques become inefficient in this regime. Therefore, a new technique, referred to as
the di-𝜏 tagger, is developed to reconstruct and identify boosted hadronically decaying 𝜏+𝜏−pairs. For
the identification, a multivariate algorithm is trained to distinguish between 𝜏+𝜏−pairs and the multi-jet background from quark- or gluon-initiated jets by exploiting the calorimetric shower shapes and tracking
information. A similar algorithm was implemented by the CMS Collaboration in Ref. [9].
An application of the di-𝜏 tagger is carried out in a search for a narrow spin-0 resonance in the mass range 1–3 TeV, which is produced via gluon–gluon fusion and decays into a pair of Higgs bosons (𝑋 → 𝐻 𝐻),
as predicted by models with an extended Higgs sector, such as two-Higgs-doublet models [10,11]. This
search considers the final state where one Higgs boson decays into a 𝑏 ¯𝑏 pair and the other one into a
𝜏+𝜏− pair, where both 𝜏-leptons decay hadronically.1 A dedicated benchmark of the di-𝜏 tagger with
an identification efficiency of 60% is designed for this analysis. Using 139 fb−1of proton–proton (𝑝 𝑝)
collision data at a centre-of-mass energy √
𝑠= 13 TeV recorded by the ATLAS experiment in 2015–2018,
various orthogonal event categories are defined in order to correct the efficiency of the di-𝜏 tagger for the benchmark selection, to perform and validate the multi-jet background estimate, and to search for resonantly produced Higgs boson pairs.
This paper is organised as follows. After a brief description of the ATLAS detector in Section2, the
samples of data and simulated events used in this study are described in Section3. The procedures used to
reconstruct and identify physics objects such as electrons, muons, jets and missing transverse momentum
in the detector are described in Section4. Section5 presents the reconstruction and identification of
boosted hadronically decaying 𝜏+𝜏− pairs. In Section6, general event selections and categorisations
are summarised, while Section7focuses on the data-driven estimation of the multi-jet background with
quark- or gluon-initiated jets misidentified as boosted hadronically decaying 𝜏+𝜏−pairs. The data-driven correction of the di-𝜏 tagger efficiency is discussed in Section8and the search for 𝑋 → 𝐻 𝐻 → 𝑏 ¯𝑏 𝜏+𝜏−is presented in Section9, including the statistical analysis used to set 95% confidence-level (CL) limits on the
production cross-section for resonant 𝐻 𝐻 production. Finally, a summary is given in Section10.
2 ATLAS detector
The ATLAS detector [12] at the LHC is a multipurpose particle detector with a forward–backward
symmetric cylindrical geometry and nearly 4𝜋 coverage in solid angle.2 It consists of an inner tracking
system surrounded by a thin superconducting solenoid providing a 2 T axial magnetic field, electromagnetic and hadronic calorimeters, and a muon spectrometer.
The inner detector covers the pseudorapidity range |𝜂| < 2.5. It consists of silicon pixel, silicon microstrip, and transition radiation tracking detectors. For the
√
𝑠= 13 TeV run, a fourth layer of the pixel detector, the insertable 𝐵-layer [13,14], was installed close to the beam pipe at an average radius of 33.2 mm, providing an additional position measurement with 8 𝜇m resolution in the (𝑥, 𝑦) plane and 40 𝜇m along 𝑧.
Lead/liquid-argon (LAr) sampling calorimeters provide electromagnetic energy measurements with high granularity in the region |𝜂| < 3.2. In the central part, |𝜂| < 2.5, the calorimeter is divided into three layers,
one of them segmented in thin 𝜂 strips for optimal 𝛾/𝜋0separation, completed by a presampler layer for
|𝜂| < 1.8. A hadronic steel/scintillator-tile calorimeter covers the central pseudorapidity range (|𝜂| < 1.7). The endcap and forward regions are instrumented with LAr calorimeters for both the electromagnetic and hadronic energy measurements up to |𝜂| = 4.9. The granularity of the calorimeter system in terms of Δ𝜂 × Δ𝜙 is typically 0.025 × 𝜋/128 in the barrel of the electromagnetic calorimeter and 0.1 × 𝜋/32 in the hadronic calorimeter, with variations in segmentation with |𝜂| and the layer [15].
The muon spectrometer surrounds the calorimeters and is based on three large air-core toroidal supercon-ducting magnets with eight coils each. The field integral of the toroids ranges between 2.0 and 6.0 T m across most of the detector. The muon spectrometer includes a system of precision tracking chambers and fast detectors for triggering.
A two-level trigger system [16] is used to select events. The first-level trigger is implemented in hardware and uses a subset of the detector information to reduce the accepted rate to at most 100 kHz. This is followed by a software-based trigger that reduces the accepted event rate to 1 kHz on average.
2ATLAS uses a right-handed coordinate system with its origin at the nominal interaction point (IP) in the centre of the detector
and the 𝑧-axis along the beam pipe. The 𝑥-axis points from the IP to the centre of the LHC ring, and the 𝑦-axis points upwards. Cylindrical coordinates (𝑟, 𝜙) are used in the transverse plane, 𝜙 being the azimuthal angle around the 𝑧-axis. The pseudorapidity is defined in terms of the polar angle 𝜃 as 𝜂 = − ln tan(𝜃/2). Angular distance is measured in units of Δ𝑅 ≡√︁(Δ𝜂)2+ (Δ𝜙)2.
3 Data and simulated events
The studies presented in this paper are performed using a sample of 𝑝 𝑝 collision data recorded at a centre-of-mass energy
√
𝑠 = 13 TeV between 2015 and 2018, during stable beam conditions and when
all detector components relevant to the analysis were operating nominally [17]. This corresponds to an
integrated luminosity of 139 fb−1. Samples of Monte Carlo (MC) simulated events are used to train and
calibrate the di-𝜏 tagger, as well as to model the signal and some SM background processes in the search for resonant Higgs boson pair production.
The signal, i.e. the production of a heavy spin-0 resonance via gluon–gluon fusion and its decay into a pair
of Higgs bosons, 𝑋 → 𝐻 𝐻, was simulated for nine values of the resonance mass, 𝑚𝑋, between 1 and 3 TeV,
using MadGraph5_aMC@NLO v2.6.1 [18] at leading-order (LO) accuracy in quantum chromodynamics
(QCD) with the NNPDF2.3LO [19] set of parton distribution functions (PDFs). The event generator was
interfaced with Herwig v7.1.3 [20,21] to model the parton shower, hadronisation and underlying event,
using the default set of tuned parameters (tune) and the MMHT2014LO [22] PDF set. In the nine signal
samples, a narrow-width approximation was used for the resonance 𝑋, i.e. its natural width was set to a value that remains much smaller than the experimental mass resolution. In addition, the Higgs boson mass
was set to 125 GeV and the SM branching fractions were used for the decays 𝐻 → 𝑏 ¯𝑏and 𝐻 → 𝜏+𝜏−. In
order to develop the identification algorithm of the boosted hadronically decaying 𝜏+𝜏−pairs, another set of 𝐻 𝐻 samples was produced, based on a narrow-width spin-2 Kaluza–Klein graviton, as predicted in the
Randall–Sundrum model of warped extra dimensions [23], 𝐺 → 𝐻 𝐻 → (𝜏+𝜏−) (𝜏+𝜏−). Such events were
generated with MadGraph5_aMC@NLO v2.3.3 at LO accuracy in QCD with the NNPDF2.3LO set of
PDFs, interfaced with Pythia v8.212 [24] using the A14 [25] tune. Five samples, with graviton masses of
1.5, 1.75, 2, 2.25 and 2.5 TeV, were generated. Only hadronically decaying 𝜏-leptons were considered in all
𝐻 𝐻signal samples.
The production of 𝑊 and 𝑍 bosons in association with jets (𝑉 +jets) was simulated with Sherpa v2.2.1 [26]
using matrix elements at next-to-leading-order (NLO) accuracy in QCD for up to two jets and at LO
accuracy for up to four jets, calculated with the Comix [27] and OpenLoops [28] libraries. They were
matched with the Sherpa parton shower [29] using the MEPS@NLO prescription [30,31]. The tune
developed by the Sherpa authors and the NNPDF3.0NNLO PDF set were used. The 𝑉 +jets samples
were normalised to a next-to-next-to-leading-order (NNLO) prediction [32]. In the 𝑍 +jets events, jets
are labelled according to the generated hadrons with 𝑝T >5 GeV found within a cone of size Δ𝑅 = 0.4
around the jet axis. If a 𝑏-hadron is found, the jet is labelled as a 𝑏-jet. If no 𝑏-hadron is found but there is a 𝑐-hadron instead, the jet is labelled as a 𝑐-jet. If neither a 𝑏-hadron nor a 𝑐-hadron is found, the jet is labelled as a light (𝑙) jet. Simulated 𝑍 +jets events are then categorised according to the labels of the two
jets that are used to reconstruct the 𝐻 → 𝑏 ¯𝑏candidate. The combination of 𝑍 +𝑏𝑏, 𝑍 +𝑏𝑐, 𝑍 +𝑏𝑙 and 𝑍 +𝑐𝑐
events is referred to as 𝑍 +hf (denoting heavy-flavour jets) in the following, whereas other events belong to the 𝑍 +lf (denoting light-flavour jets) category. This categorisation is not performed for the 𝑊 +jets process because its contribution is small.
The Powheg-Box v2 generator [33–35] was used to generate the 𝑊𝑊 , 𝑊 𝑍 and 𝑍 𝑍 (diboson) processes [36] at NLO accuracy in QCD. The effect of singly resonant amplitudes, as well as interference effects due to 𝑍/𝛾∗and identical leptons in the final state, were included where appropriate (interference effects between
𝑊 𝑊 and 𝑍 𝑍 for same-flavour charged leptons and neutrinos were ignored). Events were interfaced with
Pythia v8.186 [37] for the modelling of the parton shower, hadronisation and underlying event, with
parameters set according to the AZNLO [38] tune. The CT10 [39] PDF set was used for the hard-scattering
The production of a single 125 GeV Higgs boson in association with a 𝑍 boson was simulated up to NLO
accuracy in QCD using Powheg-Box v2 [41–43], with the NNPDF3.0NLO PDF set and subsequently
reweighted to the PDF4LHC15NLO [44] PDF set. The simulation was interfaced with Pythia v8.212,
using the AZNLO tune and the CTEQ6L1 PDF set. The 𝑔𝑔 → 𝑍 𝐻 and 𝑞𝑞 → 𝑍 𝐻 samples were normalised to cross-sections calculated at, respectively, NLO accuracy in QCD including soft-gluon
resummation up to next-to-leading logarithms [45–47] and NNLO accuracy in QCD with NLO electroweak
corrections [48–55]. Other single-Higgs-boson production modes were found to contribute negligibly.
Single-top-quark processes (split into 𝑠-channel, 𝑡-channel and 𝑡𝑊 contributions) and 𝑡 ¯𝑡 events were
simulated using Powheg-Box v2 [56–58] at NLO accuracy in QCD with the NNPDF3.0NLO PDF set.
All events were interfaced with Pythia v8.230 using the A14 tune and the NNPDF2.3LO PDF set. For
the 𝑡𝑊 process, the diagram removal scheme [59] was employed in order to handle the interference
with 𝑡 ¯𝑡 production. The 𝑡 ¯𝑡 sample was normalised to the cross-section prediction at NNLO accuracy in QCD including the resummation of next-to-next-to-leading logarithmic soft-gluon terms calculated using
Top++2.0 [60–66]. For the single-top-quark processes, the cross-sections of the 𝑠- and 𝑡-channels were
corrected to the theory prediction at NLO accuracy in QCD calculated with Hathor v2.1 [67,68], while
the cross-section used for the 𝑡𝑊 sample was based on the approximate NNLO calculation [69,70].
Except when using Sherpa, 𝑏- and 𝑐-hadron decays were performed with EvtGen v1.2.0 or v1.6.0 [71],
while the decays of 𝜏-leptons were handled internally by all event generators. The effect of multiple interactions in the same and neighbouring bunch crossings (pile-up) was modelled by overlaying the original hard-scattering event with simulated inelastic 𝑝 𝑝 events generated with Pythia v8.186 using the
NNPDF2.3LO PDF set and the A3 [72] tune. The MC samples were processed with a simulation [73] of
the detector response based on Geant4 [74] and events were then reconstructed with the same software as
the data.
4 Object reconstruction
The following procedures are used to reconstruct and identify objects, such as electrons, muons, jets and missing transverse momentum, in the ATLAS experiment.
In general, jets refer to the hadronic objects reconstructed using the anti-𝑘𝑡 algorithm with a radius
parameter 𝑅 = 0.4 [75,76], starting from topological clusters of energy deposits in the calorimeter. When used in the following, jets are required to have 𝑝T >20 GeV and |𝜂| < 4.5. The reconstruction of electrons is based on matching inner-detector tracks to energy clusters in the electromagnetic calorimeter. Electrons
are required to have 𝑝T > 7 GeV and |𝜂| < 2.47, excluding the barrel–endcap transition region of the
calorimeter (1.37 < |𝜂| < 1.52). They are then identified using the ‘loose’ operating point provided by
a likelihood-based algorithm [77]. The reconstruction of muons relies on matching tracks in the inner
detector and the muon spectrometer. Muons are required to have 𝑝T > 7 GeV and |𝜂| < 2.5, as well
as to satisfy the ‘loose’ identification criteria and ‘FixedCutLoose’ isolation working point defined in Ref. [78].
In order to avoid double-counting of objects that overlap geometrically, an electron is removed if it shares
an inner-detector track with a muon. Then, anti-𝑘𝑡jets with 𝑅 = 0.4 are discarded if they meet one of the
following two conditions: (i) Δ𝑅 (jet, 𝑒) < 0.2; (ii) the jet has less than three associated tracks and either a muon inner-detector track is associated with the jet or Δ𝑅 (jet, 𝜇) < 0.2. Finally, an electron or muon is discarded if found within a distance Δ𝑅 = min(0.4, 0.04 + 10 GeV/𝑝
𝑒/𝜇
The missing transverse momentum, the magnitude of which is denoted by 𝐸Tmiss in the following, is defined as the negative vector sum of the transverse momenta of all fully reconstructed and calibrated objects, after an overlap removal procedure that is distinct from that used for the electron/muon/jet
disambiguation above [79,80]. The missing transverse momentum also includes a soft term, calculated
using the inner-detector tracks that originate from the primary vertex (defined as that having the largest sum of squared track-𝑝T) but are not associated with reconstructed objects.
In order to capture the decay products of boosted particles, such as Higgs bosons, another type of jets, called large-radius jets, is employed. These are also formed using the anti-𝑘𝑡algorithm, but with a radius parameter 𝑅 = 1.0 and are built from topological clusters of energy deposits calibrated using the local hadronic cell weighting scheme [15]. In the following, the large-radius jet matched to the boosted 𝐻 → 𝑏 ¯𝑏
candidate is referred to as a ‘large-𝑅 jet’ while that of the boosted hadronically decaying 𝜏+𝜏−pair is
referred to as a ‘di-𝜏 object’.
While the reconstruction and identification of boosted 𝐻 → 𝜏+𝜏−decays employ new techniques described
in Section5, a standard procedure is used for boosted 𝐻 → 𝑏 ¯𝑏decays. Large-𝑅 jets are trimmed [81] to remove the effects of pile-up and the underlying event. Trimming proceeds by reclustering the original
constituents of a large-𝑅 jet into a collection of 𝑅 = 0.2 sub-jets using the 𝑘𝑡 algorithm [82, 83] and
removing any sub-jets with 𝑝sub-jetT /𝑝 𝐽
0
T
<0.05, where 𝑝sub-jet
T is the transverse momentum of the sub-jet
under consideration and 𝑝 𝐽
0
T that of the original (untrimmed) large-𝑅 jet. The energy and mass scales of the
trimmed jets are then calibrated using 𝑝T- and 𝜂-dependent calibration factors derived from simulation [84].
After trimming, the large-𝑅 jet is required to have 𝑝T > 300 GeV and its mass is calculated using the
combined mass technique with tracking and calorimeter information as input [85].
In order to identify 𝑏-hadrons within a large-𝑅 jet, variable-radius track-jets [86] are reconstructed using the anti-𝑘𝑡algorithm from inner-detector tracks with a jet-𝑝T dependent radius parameter 𝑅 ( 𝑝T) = 𝜌/𝑝T, where 𝜌 determines how fast the effective size of the jet decreases with its transverse momentum. The lower (𝑅min) and upper (𝑅max) cut-offs prevent the jet from becoming too large at low 𝑝Tand from shrinking below the detector resolution at high 𝑝T, respectively. In this paper, 𝜌 = 30 GeV, 𝑅min= 0.02 and 𝑅max= 0.4 are
used [87]. These track-jets are then matched to an untrimmed large-𝑅 jet by using the ghost-association
method [88,89]. Only track-jets with 𝑝T >10 GeV, |𝜂| < 2.5 and at least two tracks [87] are considered in the following. Events with two collinear track-jets 𝑎 and 𝑏 that fulfil Δ𝑅 (jet𝑎,jet𝑏) < min(𝑅jet𝑎
, 𝑅 jet𝑏) are removed.
The flavour of track-jets is determined using a multivariate approach based on the properties and vertex information of the associated tracks [90,91]. Various 𝑏-jet identification algorithms are used to exploit impact-parameter information, secondary-vertex information, and 𝑏- to 𝑐-hadron decay chain information.
The MV2c10 algorithm [92] then combines information from the various upstream algorithms in a
boosted decision tree (BDT) that is trained to discriminate 𝑏-jets from a background sample made of 93% light-flavour jets and 7% 𝑐-jets. In order to label a track-jet as 𝑏-tagged, a requirement is placed on the output score of the MV2c10 discriminant. This requirement has an average efficiency of 70% for 𝑏-jets
in simulated 𝑡 ¯𝑡 events (decreasing to about 60% for a 𝑏-jet 𝑝T above 500 GeV) with rejection factors of
8.9, 36 and 300 for jets initiated by 𝑐-quarks, hadronically decaying 𝜏-leptons and light-flavour quarks,
respectively [93]. The number of 𝑏-tagged track-jets in the large-𝑅 jet is used to define various event
5 Reconstruction and identification of boosted hadronically decaying 𝝉
+𝝉
−pairs
Hadronically decaying 𝜏-leptons produce a neutrino and visible decay products, typically one or three charged pions and up to several neutral pions, which are reconstructed and identified as 𝜏had-visobjects. In the standard procedure [94], a 𝜏had-visobject is seeded by a jet with 𝑝T >10 GeV and |𝜂| < 2.5, formed
using the anti-𝑘𝑡 algorithm with 𝑅 = 0.4. A multivariate identification stage, using calorimetric shower
shapes and tracking information as input variables, is employed to discriminate 𝜏had-viscandidates with
one or three associated tracks from quark- or gluon-initiated jets. However, in the search for high-mass 𝑋→ 𝐻𝐻 → 𝑏 ¯𝑏 𝜏+𝜏−presented in this paper, more than 50% of the 𝜏+𝜏−pairs have a separation Δ𝑅 < 0.4
when 𝑚𝑋 ≥ 2 TeV, hence they would fail the standard reconstruction procedure. For such events, a new
method for reconstructing boosted hadronically decaying 𝜏+𝜏− pairs, referred to as the di-𝜏 tagger, is
employed.
Boosted di-𝜏 objects are seeded by untrimmed large-radius jets that must have 𝑝T > 300 GeV. Their
constituents are reclustered into anti-𝑘𝑡sub-jets with 𝑅 = 0.2. The original di-𝜏 seeding jet must include at least two such sub-jets and, after ordering in 𝑝T, the two leading sub-jets are used to construct the di-𝜏 system. Tracks are geometrically matched to a sub-jet if they are within a cone of size Δ𝑅 = 0.2 around its axis, and they are labelled as ‘𝜏 tracks’. Other tracks found in the isolation region (i.e. the area of the di-𝜏 seeding large-radius jet excluding the di-𝜏 sub-jets) are labelled as ‘iso-tracks’. A schematic representation of a di-𝜏 object is shown in Figure1. The track selection criteria, as well as the track–vertex matching, are the same as those used for the standard 𝜏had-visobjects [94]. In the following, the two leading sub-jets used
to compute the four-momentum of the di-𝜏 system must have 𝑝T > 10 GeV and at least one associated
track.
Figure 1: Schematic representation of a di-𝜏 object: the large blue cone is the di-𝜏 seeding jet while the two smaller yellow cones are the two leading sub-jets. Tracks found within a cone of size Δ𝑅 = 0.2 around the sub-jet axis are matched to charged pions produced in hadronic decays of 𝜏-leptons, while other tracks found in the isolation region are labelled as ‘iso-tracks’. The closest distance 𝑑0in the transverse plane between the primary vertex and the leading
track matched to a sub-jet is also shown for illustration.
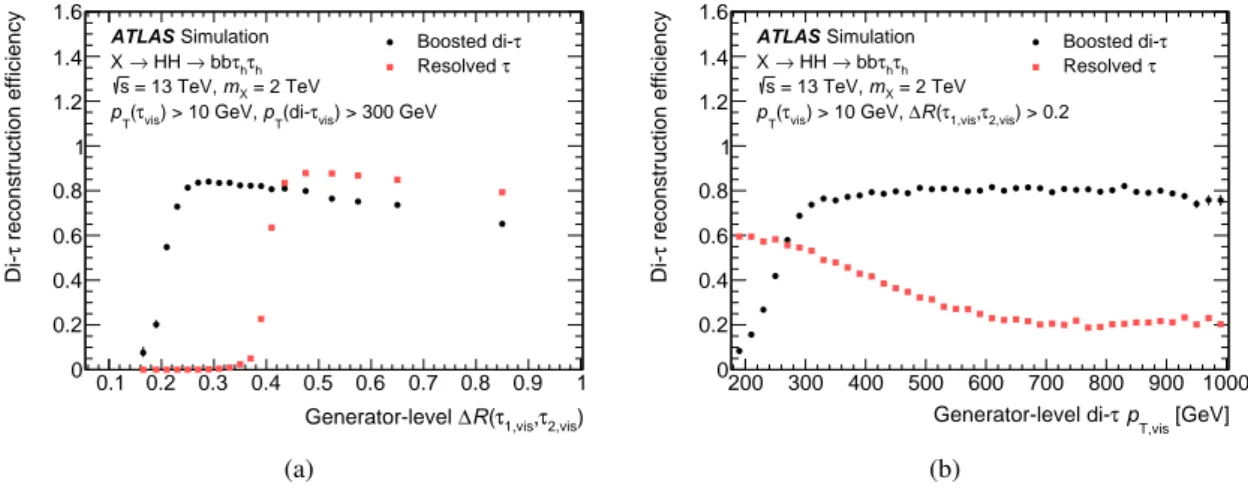
At this stage, the di-𝜏 reconstruction efficiency is defined as the fraction of events in which a boosted di-𝜏 candidate is reconstructed and each of the two leading sub-jets geometrically matches a generated
hadronically decaying 𝜏-lepton for which the 𝑝T of the visible products (neutral and charged hadrons)
the distance Δ𝑅 (𝜏1,vis, 𝜏2,vis) between the visible products of the two hadronically decaying 𝜏-leptons and the visible 𝑝Tof the di-𝜏 system, both computed at generator level. For this purpose, a sample of simulated
𝑋 → 𝐻𝐻 → 𝑏 ¯𝑏 𝜏+𝜏− events is used, in which the resonance mass is set to 2 TeV and both 𝜏-leptons
decay hadronically. In Figure2, the reconstruction efficiency is also shown for standard (resolved) 𝜏had-vis objects. In this case, the efficiency is defined as the fraction of events with at least two reconstructed 𝜏had-vis candidates, with at least one associated track each, that geometrically match a generated hadronically
decaying 𝜏-lepton for which the 𝑝T of the visible products exceeds 10 GeV. This comparison shows
that the boosted di-𝜏 object reconstruction method is necessary at high transverse momenta and low Δ𝑅(𝜏1,vis, 𝜏
2,vis). In particular, Figure2(a)shows that the reconstruction efficiencies decrease sharply when
the visible products of the two hadronically decaying 𝜏-leptons are so close that they merge into one jet. With the resolved 𝜏had-visreconstruction this happens when Δ𝑅 (𝜏1,vis, 𝜏2,vis) < 0.4, while the boosted di-𝜏 reconstruction extends the sensitivity down to Δ𝑅 (𝜏1,vis, 𝜏2,vis) = 0.2 by resolving the smaller sub-jets. In addition, as the distance Δ𝑅 (𝜏1,vis, 𝜏2,vis) increases, the reconstruction efficiency of both boosted di-𝜏
and resolved 𝜏had-vis objects decreases slowly, because the sub-leading generated 𝜏-lepton is found to
become softer, and hence less likely to exceed the 10 GeV 𝑝Tthreshold imposed on its visible products.
Also, in contrast to the reconstruction efficiency of resolved 𝜏had-visobjects, which is based on at least two candidates, the di-𝜏 reconstruction method loses some efficiency due to the fact that only the two leading
sub-jets are considered. Finally, as shown in Figure2(b), the reconstruction efficiency reaches a plateau
when the 𝑝Tof the di-𝜏 system exceeds 300 GeV, while the location of the turn-on is set by the 𝑝Tcut on
the seeding jet.
0.1 0.2 0.3 0.4 0.5 0.6 0.7 0.8 0.9 1 ) 2,vis τ , 1,vis τ ( R ∆ Generator-level 0 0.2 0.4 0.6 0.8 1 1.2 1.4 1.6 reconstruction efficiency τ Di-τ Boosted di-τ Resolved Simulation ATLAS h τ h τ bb → HH → X = 2 TeV X m = 13 TeV, s ) > 300 GeV vis τ (di-T p ) > 10 GeV, vis τ ( T p (a) 200 300 400 500 600 700 800 900 1000 [GeV] T,vis p τ Generator-level di-0 0.2 0.4 0.6 0.8 1 1.2 1.4 1.6 reconstruction efficiency τ Di-τ Boosted di-τ Resolved Simulation ATLAS h τ h τ bb → HH → X = 2 TeV X m = 13 TeV, s ) > 0.2 2,vis τ , 1,vis τ ( R ∆ ) > 10 GeV, vis τ ( T p (b)
Figure 2: Efficiency to reconstruct a di-𝜏 system with (squares) resolved 𝜏had-visobjects and (circles) a boosted di-𝜏
object versus (a) the distance Δ𝑅 (𝜏1,vis, 𝜏2,vis) between the visible products of the two hadronically decaying 𝜏-leptons
and (b) the 𝑝Tof the di-𝜏 system, both at generator level. The reconstruction efficiency is computed in simulated
𝑋 → 𝐻𝐻 → 𝑏 ¯𝑏 𝜏+𝜏−events, where the resonance mass is set to 2 TeV and both 𝜏-leptons decay hadronically (similar patterns are observed for other masses though). The vertical error bars only account for statistical uncertainties.
As in the case of standard 𝜏had-vis objects, a separate identification stage using multivariate techniques
is employed to reduce the background from quark- and gluon-initiated jets. For this purpose, a BDT discriminant is built using information about the clusters in the calorimeter, tracks and vertices. Multi-jet
events with quark- or gluon-initiated jets misidentified as di-𝜏 objects are expected to have lower-𝑝T
sub-jets, with a larger fraction of energy in the isolation region. Also, multi-jet events typically have fewer collimated tracks and a higher track multiplicity with, accordingly, a smaller fraction of the transverse
and are used in the BDT training.
Table 1: Discriminating variables used in the di-𝜏 identification BDT, aimed at rejecting the background from quark-and gluon-initiated jets. Here, LRJ refers to the seeding large-radius jet of the di-𝜏 object, sj1and sj2stand for the
first and second sub-jets ordered in 𝑝T, respectively, and tracks refer to those matched to a sub-jet (𝜏 tracks), unless
specified otherwise. Variable Definition 𝐸sj1 Δ𝑅<0.1/𝐸 sj1 Δ𝑅<0.2and 𝐸 sj2 Δ𝑅<0.1/𝐸 sj2
Δ𝑅<0.2 Ratios of the energy deposited in the core to that in the full cone, for
the sub-jets sj1and sj2, respectively
𝑝sj2 T /𝑝 LRJ T and ( 𝑝 sj1 T + 𝑝 sj2 T )/𝑝 LRJ
T Ratio of the 𝑝Tof sj2to the di-𝜏 seeding large-radius jet 𝑝Tand ratio
of the scalar 𝑝Tsum of the two leading sub-jets to the di-𝜏 seeding
large-radius jet 𝑝T, respectively
log(Í𝑝iso-tracks
T /𝑝
LRJ
T ) Logarithm of the ratio of the scalar 𝑝Tsum of the iso-tracks to the
di-𝜏 seeding large-radius jet 𝑝T
Δ𝑅max(track, sj1) and Δ𝑅max(track, sj2) Largest separation of a track from its associated sub-jet axis, for the sub-jets sj1and sj2, respectively
Í [ 𝑝track
T Δ𝑅(track, sj2)]/
Í 𝑝track
T 𝑝T-weighted Δ𝑅 of the tracks matched to sj2with respect to its axis
Í [ 𝑝iso-track
T Δ𝑅(iso-track, sj)]/
Í 𝑝iso-track
T 𝑝T-weighted sum of Δ𝑅 between iso-tracks and the nearest sub-jet
axis log(𝑚tracks, sj1
Δ𝑅<0.1) and log(𝑚
tracks, sj2
Δ𝑅<0.1) Logarithms of the invariant mass of the tracks in the core of sj1and
sj2, respectively
log(𝑚tracks, sj1
Δ𝑅<0.2) and log(𝑚
tracks, sj2
Δ𝑅<0.2) Logarithms of the invariant mass of the tracks with Δ𝑅 < 0.2 from
the axis of sj1and sj2, respectively
log(|𝑑sj0,lead-track1 |) and log(|𝑑sj0,lead-track2 |) Logarithms of the closest distance in the transverse plane between the primary vertex and the leading track of sj1and sj2, respectively
𝑛sj1
tracksand 𝑛
sub-jets
tracks Number of tracks matched to sj1and to all sub-jets, respectively
The training of the BDT is performed using the adaptive boosting (AdaBoost) algorithm [95], with a
boosting parameter of 0.5, in the TMVA toolkit [96]. The di-𝜏 objects in simulated events with a spin-2
graviton, 𝐺 → 𝐻 𝐻 → (𝜏+𝜏−) (𝜏+𝜏−), form the signal training set. Five samples, with graviton masses of 1.5, 1.75, 2, 2.25 and 2.5 TeV, are combined to form the signal. The spin of the resonance is found to have
no impact on the di-𝜏 identification.
The background sample in the BDT training consists of the 3.2 fb−1 of data recorded by the ATLAS
experiment in 2015 using combined jet triggers with transverse energy (𝐸T) thresholds between 100 and
400 GeV. It is dominated by multi-jet events and the contamination from events with a true di-𝜏 object
is found to be negligible. The di-𝜏 𝑝T spectra of the signal and background events are reweighted to
become flat, so that the 𝑝T dependencies of the input variables are eliminated in the BDT training. On the
other hand, no reweighting regarding 𝜂 is performed, since no dependency on this variable is observed.
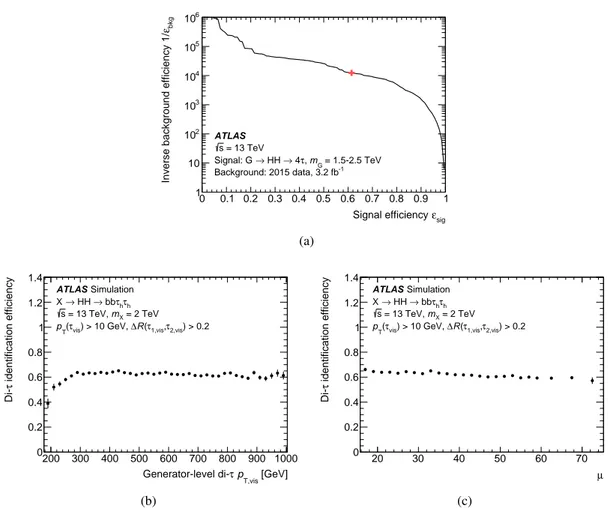
Figure3(a)shows the background rejection factor (defined as the inverse of the background efficiency)
versus the signal efficiency, as obtained after the di-𝜏 reconstruction step. In the following, a requirement is placed on the BDT output score to define a benchmark with a signal efficiency of about 60%, as indicated
by the red cross. This working point corresponds to a background rejection factor of 104. Figure3(b)
shows that the identification efficiency has little dependency on the 𝑝Tof the di-𝜏 system beyond 300 GeV.
As illustrated in Figure3(c), the performance of the BDT is not affected much by the number of pile-up
between the di-𝜏 signature and the multi-jet background is not expected to change significantly across the data-taking period between 2015 and 2018.
0 0.1 0.2 0.3 0.4 0.5 0.6 0.7 0.8 0.9 1 sig ε Signal efficiency 1 10 2 10 3 10 4 10 5 10 6 10 bkg ε
Inverse background efficiency 1/
ATLAS = 13 TeV s = 1.5-2.5 TeV G m , τ 4 → HH → Signal: G -1 Background: 2015 data, 3.2 fb (a) 200 300 400 500 600 700 800 900 1000 [GeV] T,vis p τ Generator-level di-0 0.2 0.4 0.6 0.8 1 1.2 1.4 identification efficiency τ Simulation ATLAS h τ h τ bb → HH → X = 2 TeV X m = 13 TeV, s ) > 0.2 2,vis τ , 1,vis τ ( R ∆ ) > 10 GeV, vis τ ( T p (b) 20 30 40 50 60 70 µ 0 0.2 0.4 0.6 0.8 1 1.2 1.4 identification efficiency τ Simulation ATLAS h τ h τ bb → HH → X = 2 TeV X m = 13 TeV, s ) > 0.2 2,vis τ , 1,vis τ ( R ∆ ) > 10 GeV, vis τ ( T p (c)
Figure 3: (a) Background rejection factor versus identification efficiency for the BDT used to discriminate between di-𝜏 signatures and quark- or gluon-initiated jets, as obtained after the di-𝜏 reconstruction step (the red cross indicates the benchmark used in the analysis, corresponding to a signal efficiency of about 60% and a background rejection factor of 104), and identification efficiency of boosted di-𝜏 objects, as a function of (b) their 𝑝Tat generator level and
(c) the number 𝜇 of pile-up interactions. The vertical error bars only account for statistical uncertainties.
Since the majority of hadronically decaying 𝜏-leptons produce one or three charged pions, the number of tracks matched to each di-𝜏 sub-jet, with a distance Δ𝑅 < 0.1 from its axis, must be either one or three in the following. The efficiency of this additional requirement, computed after the di-𝜏 reconstruction
and identification steps, is shown in Figures4(a)and4(b)as a function of the generator-level 𝑝Tof the
di-𝜏 system and the number 𝜇 of pile-up interactions, respectively. For this purpose, the same sample
of simulated 𝑋 → 𝐻 𝐻 → 𝑏 ¯𝑏 𝜏+𝜏−events is used. The di-𝜏 sub-jet track selection is found to be stable
not only with respect to the 𝑝Tof the di-𝜏 system and the number of pile-up interactions, but also with
respect to pseudorapidity and the distance Δ𝑅 (𝜏1,vis, 𝜏2,vis) between the visible decay products of the two hadronically decaying 𝜏-leptons. This additional requirement further improves the rejection of the background with quark- or gluon-initiated jets by a factor of about five.
In simulated 𝑋 → 𝐻 𝐻 → 𝑏 ¯𝑏 𝜏+𝜏−events, the energy of reconstructed di-𝜏 objects is close to that of the visible decay products of the corresponding two hadronically decaying 𝜏-leptons at generator level, as
200 300 400 500 600 700 800 900 1000 [GeV] T,vis p τ Generator-level di-0 0.2 0.4 0.6 0.8 1 1.2 1.4
track selection efficiency
τ Simulation ATLAS h τ h τ bb → HH → X = 2 TeV X m = 13 TeV, s ) > 0.2 2,vis τ , 1,vis τ ( R ∆ ) > 10 GeV, vis τ ( T p (a) 20 30 40 50 60 70 µ 0 0.2 0.4 0.6 0.8 1 1.2 1.4
track selection efficiency
τ Simulation ATLAS h τ h τ bb → HH → X = 2 TeV X m = 13 TeV, s ) > 0.2 2,vis τ , 1,vis τ ( R ∆ ) > 10 GeV, vis τ ( T p (b)
Figure 4: Efficiency of the track selection for di-𝜏 sub-jets versus (a) the 𝑝Tof the di-𝜏 system at generator level
and (b) the number 𝜇 of pile-up interactions, computed after the boosted di-𝜏 reconstruction and identification steps in simulated 𝑋 → 𝐻 𝐻 → 𝑏 ¯𝑏 𝜏+𝜏−events, where the resonance mass is set to 2 TeV and both 𝜏-leptons decay hadronically. The vertical error bars only account for statistical uncertainties.
regions of the data enriched in boosted di-𝜏 candidates, good agreement is found between simulated and measured di-𝜏 energy distributions; hence no additional energy calibration is applied to di-𝜏 objects.
200 300 400 500 600 700 800 900 1000 [GeV] T,vis p τ Generator-level di-0.92 0.94 0.96 0.98 1 1.02 1.04 1.06 1.08 true vis E/ reco E τ Simulation ATLAS h τ h τ bb → HH → X = 2 TeV X m = 13 TeV, s (a) 200 300 400 500 600 700 800 900 1000 [GeV] T,vis p τ Generator-level di-0.02 0.04 0.06 0.08 0.1 0.12 ) true vis E )/ true vis E-reco E (( σ Simulation ATLAS h τ h τ bb → HH → X = 2 TeV X m = 13 TeV, s (b)
Figure 5: Energy (a) scale and (b) resolution of the di-𝜏 reconstruction as a function of the 𝑝Tof the di-𝜏 system at
generator level, computed in simulated 𝑋 → 𝐻 𝐻 → 𝑏 ¯𝑏 𝜏+𝜏−events, where the resonance mass is set to 2 TeV and all 𝜏-leptons decay hadronically. The requirement of 𝑝T>300 GeV on the seeding jet truncates the reconstructed
energy distribution and leads to a degradation of the energy scale for the lower values of the 𝑝Tof the di-𝜏 system.
6 Event selection and categorisation
This section presents the common event selection and further categorisations used for the multi-jet background estimation, the data-driven correction of the efficiency of the di-𝜏 tagger and the search for
𝑋 → 𝐻𝐻 → 𝑏 ¯𝑏 𝜏+𝜏−. The events are selected using unprescaled triggers requiring the presence of a
large-radius jet with an 𝐸T threshold between 360 and 460 GeV, depending on the data-taking period.
Subsequently, in order to ensure a constant trigger efficiency, an offline 𝑝Tcut that exceeds the trigger
threshold by 40–50 GeV is applied to the leading large-radius jet, independently of whether it is compatible with a boosted 𝑏 ¯𝑏or hadronically decaying 𝜏+𝜏−pair. In order to avoid contamination from non-collision backgrounds, such as those originating from calorimeter noise, beam halo and cosmic rays, events are rejected if they contain an anti-𝑘𝑡 jet with 𝑅 = 0.4 and 𝑝T >20 GeV that does not fulfil the loose quality criteria of Ref. [97]. In addition, events are required to have a vertex with at least two associated tracks with 𝑝
T >500 MeV. Finally, events are vetoed if they contain an electron or muon that meets the requirements described in Section4.
At preselection, events are required to contain at least one reconstructed di-𝜏 object, which must meet the requirements below, in addition to those listed in Section5. If multiple di-𝜏 objects are found, the one with the highest 𝑝Tis selected.
• The number of sub-jets is at most three, and the 𝑝Tthreshold of the two leading sub-jets is raised to 50 GeV in order to reduce the contribution of multi-jet background events.
• The separation Δ𝑅 between the leading and sub-leading sub-jets is less than 0.8 to ensure that both are fully contained in the di-𝜏 seeding jet.
• The charge product of the two leading sub-jets is 𝑄 = 𝑞lead× 𝑞sub-lead= ±1. The charge of the sub-jet is defined as the sum of the charges of the associated tracks.
• The transverse momentum of the di-𝜏 object, computed from the two leading sub-jets, must exceed 300 GeV (or fulfil the tighter 𝑝Trequirement set by the trigger threshold if the seeding large-radius jet fires the trigger), with a pseudorapidity |𝜂| < 1.37 or 1.52 < |𝜂| < 2.0, thereby rejecting the transition region between the barrel and endcap calorimeters.
In addition, 𝐸missT >10 GeV is required in order to define a direction for the missing transverse momentum.
To select boosted 𝐻 → 𝑏 ¯𝑏 decays, large-𝑅 jets with a 𝑝
T exceeding 300 GeV (or the tighter
trigger-dependent threshold if the seeding large-radius jet fires the trigger), |𝜂| < 2.0, a combined mass larger than 50 GeV and a separation Δ𝑅 > 1.0 from the selected di-𝜏 object are required. If multiple large-𝑅 jets fulfil these requirements, the one with the highest 𝑝Tis selected.
Events are then further divided into regions with either misidentified or true di-𝜏 objects. In the latter case,
the event categories contain a significant fraction of di-𝜏 objects from either 𝑍 → 𝜏+𝜏−or 𝐻 → 𝜏+𝜏−
decays. As shown in Table2, the categorisation is based on the charge product 𝑄 of the two leading
di-𝜏 sub-jets, the number 𝑁𝑏-tags of 𝑏-tagged track-jets in the selected large-𝑅 jet, the azimuthal angle
|Δ𝜙| between the selected di-𝜏 object and the missing transverse momentum, the combined mass 𝑚𝐽
of the selected large-𝑅 jet, and the invariant mass of the selected di-𝜏 object and the large-𝑅 jet, 𝑚vis𝐻 𝐻.
Requirements on 𝑚𝐽 and 𝑚vis𝐻 𝐻 are imposed in regions with one 𝑏-tagged track-jet in order to suppress
the contamination from 𝑋 → 𝐻 𝐻 → 𝑏 ¯𝑏 𝜏+𝜏−signal events. Finally, in order to ensure orthogonality to
Table 2: Definition of various categories after the event preselection (see text for details), based on the charge product 𝑄of the two leading di-𝜏 sub-jets (OS for opposite-sign, SS for same-sign), the number 𝑁𝑏-tagsof 𝑏-tagged track-jets
in the selected large-𝑅 jet, the azimuthal angle |Δ𝜙| between the di-𝜏 object and the missing transverse momentum, the large-𝑅 jet mass 𝑚𝐽, and the visible mass 𝑚vis𝐻 𝐻 of the reconstructed 𝐻 𝐻 system.
Name Usage 𝑄 𝑁𝑏-tags |Δ𝜙| 𝑚𝐽[GeV] 𝑚vis𝐻 𝐻[GeV]
FF SS Fake-factor (FF) computation +1 0 - -
-MJ OS 0-tag Closure test, multi-jet 0-𝑏-tag −1 0 >1 -
-MJ OS 1-tag Closure test, multi-jet 1-𝑏-tag −1 1 >1 50–60 or > 160 <1500
Z𝜏𝜏 0-tag Di-𝜏 tagger correction −1 0 <1 -
-Z𝜏𝜏 1-tag Di-𝜏 tagger closure test −1 1 <1 50–60 or > 160 <1500 𝐻 𝐻signal region 𝑋→ 𝐻𝐻 → 𝑏 ¯𝑏 𝜏+𝜏−search −1 2 <1 >60 and < 160 >[0, 900, 1200]
7 Estimation of the multi-jet background with a misidentified di-𝝉 object
Multi-jet events with quark- or gluon-initiated jets misidentified as di-𝜏 objects are a common background for the efficiency measurement of the di-𝜏 tagger and in the search for 𝑋 → 𝐻 𝐻 → 𝑏 ¯𝑏 𝜏+𝜏−. This section describes the data-driven method developed to estimate this background, whereas non-multi-jet background events with a misidentified di-𝜏 object are obtained directly from simulation.A data sample enriched in misidentified di-𝜏 objects is collected using the same event selection as in a region of interest (RoI), except that the selected di-𝜏 object must fail (instead of pass) the BDT-based identification, but it still fulfils a very loose criterion that corresponds to a cut on the BDT output score with an efficiency above 99%. In fact, this very loose criterion is applied to all di-𝜏 candidates in order to keep the composition of misidentified di-𝜏 objects in terms of quarks and gluons close to that in the RoI. The contribution from non-multi-jet processes, obtained using simulation, is subtracted from the data. The remaining events, defined as 𝑁RoIfail, are then reweighted by a fake factor (FF) to predict the yield of events 𝑁mis-ID
RoI with a misidentified di-𝜏 object in the RoI as follows:
𝑁mis-ID
RoI = 𝑁
fail
RoI× FF.
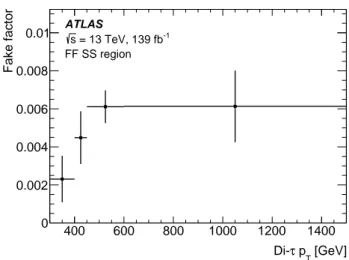
The FF is calculated in the region labelled as ‘FF SS’ in Table2, which requires 𝑄 = +1 for the di-𝜏 object and is enriched in multi-jet events. It is binned in the 𝑝Tof the di-𝜏 object and defined as:
FF = 𝑁pass FF SS 𝑁fail FF SS ,
where the numerator is the number of events passing the BDT-based di-𝜏 identification requirement, while the denominator is the number of events failing this requirement but passing the very loose BDT requirement. The contributions from non-multi-jet processes in the numerator and the denominator are
about 24% and 3% of the total event yields, respectively, and they are subtracted. Figure6shows the FF as
a function of the 𝑝Tof the di-𝜏 object. The observed increase of the FF relates to a reduced rejection of the
background from quark- or gluon-initiated jets at higher 𝑝Tvalues of the di-𝜏 object. On the other hand,
the FF is inclusive in 𝜂, since no significant change in the multi-jet background modelling was found with an additional binning in the pseudorapidity of the di-𝜏 object. The statistical uncertainty of the measured FF comes from the limited size of the samples of data and simulated events used in the computation.
400 600 800 1000 1200 1400 [GeV] T p τ Di-0 0.002 0.004 0.006 0.008 0.01 Fake factor ATLAS -1 = 13 TeV, 139 fb s FF SS region
Figure 6: Fake factor as a function of the 𝑝Tof the di-𝜏 object, computed in the control region labelled as ‘FF SS’ in
Table2, with the requirements of 𝑄 = +1 for the di-𝜏 object and of zero 𝑏-tagged track-jets for the selected large-𝑅 jet. The error bars indicate the statistical uncertainties.
Systematic uncertainties are computed to account for the different event selections used in the analysis.
In particular, a 𝑝T-binned FF is computed in a region with the same selections as those used in ‘FF SS’,
except that the charge requirement for the di-𝜏 candidate is changed to 𝑄 = −1. The deviation (up to 30%) from the nominal FF is taken as a systematic uncertainty in the extrapolation from the SS region to the OS region. In addition, the maximum overall difference (42%) between the FF values evaluated in regions with zero, one or two 𝑏-tagged track-jets in the selected large-𝑅 jet accounts for the systematic uncertainty in the event categorisation based on 𝑏-tagging.
The estimation of the multi-jet background is validated in two regions (‘MJ OS 0-tag’ and ‘MJ OS 1-tag’ in Table2) selected by requiring 𝑄 = −1 for the di-𝜏 candidate, either zero or one 𝑏-tagged track-jet in the selected large-𝑅 jet, and |Δ𝜙| > 1 between the selected di-𝜏 object and the missing transverse momentum
to suppress events with correctly identified di-𝜏 objects. As shown in Figure7, good agreement between
the predicted and measured multi-jet backgrounds is found in the ‘MJ OS 0-tag’ region, while some
discrepancy is observed between the predicted and measured event yields in the ‘MJ OS 1-tag’ region.3
Therefore, an additional, conservative, non-closure systematic uncertainty of 50% is assigned for the multi-jet background estimation in all regions with 𝑁𝑏-tags ≥ 1.
8 Data-driven correction of the di-𝝉 tagger efficiency
To account for differences in the efficiency of the di-𝜏 tagger between simulation and data, a correction is
derived in a region enriched with properly identified di-𝜏 objects from boosted 𝑍 → 𝜏+𝜏−decays. This
region, labelled as ‘Z𝜏𝜏 0-tag’ in Table2, is designed by imposing a veto on events with 𝑏-tagged track-jets in the selected large-𝑅 jet and by demanding that 𝑄 = −1 and that the boosted di-𝜏 system and the missing
3The simulated background events with a true di-𝜏 object are corrected to account for the measured efficiency of the di-𝜏 tagger,
as discussed in Section8, and an additional normalisation factor is subsequently applied to correct for the modelling of the 𝑍+hf background, as discussed in Section9.
Visible HH mass [GeV] 0 10 20 30 40 50 Events / 200 GeV 800 1000 1200 1400 1600 1800 2000 Visible HH mass [GeV] 0.5 1 1.5 Data / Pred. Data Multi-jet +lf τ τ Z +hf τ τ Z Others Uncertainty ATLAS -1 = 13 TeV, 139 fb s MJ OS 0-tag region (a)
Visible HH mass [GeV] 0 2 4 6 8 10 12 14 16 18 Events / 1500 GeV 0 1500
Visible HH mass [GeV] 1 2 Data / Pred. Data Multi-jet +lf τ τ Z +hf τ τ Z Others Uncertainty ATLAS -1 = 13 TeV, 139 fb s MJ OS 1-tag region (b)
Figure 7: Distribution of 𝑚vis𝐻 𝐻 in two regions enriched in multi-jet events, (a) ‘MJ OS 0-tag’ and (b) ‘MJ OS 1-tag’
in Table2. The background referred to as ‘Others’ contains 𝑊 +jets, diboson, 𝑍 𝐻, 𝑡 ¯𝑡 and single-top-quark events. The lower panels show a bin-by-bin comparison of the data and the predicted total background, in terms of event yield ratios. The hatched bands represent combined statistical and systematic uncertainties.
transverse momentum point in the same direction, i.e. |Δ𝜙| < 1. Figure8shows the visible di-𝜏 mass
in this region, as well as 𝑝Tand 𝜂 distributions after an additional requirement on the visible di-𝜏 mass, 30 GeV < 𝑚visdi-𝜏 < 90 GeV, which increases the fraction of 𝑍 → 𝜏+𝜏−events to 87%.4
A scale factor (SF) is computed in the ‘Z𝜏𝜏 0-tag’ region as the ratio of measured to predicted event yields with a true boosted hadronically decaying 𝜏+𝜏−pair. The measured event yield is obtained after subtracting the backgrounds with a misidentified di-𝜏 object from the data:
SF =
𝑁(data) − 𝑁 (non-di-𝜏)
𝑁(true di-𝜏) = 0.84 ± 0.09 (stat)
+0.14
−0.13(𝑍 -modelling)+0.19−0.20(syst).
No significant dependence of the ratio on the 𝑝Tor 𝜂 of the di-𝜏 object is found within the uncertainties, as illustrated in Figures8(b)and8(c). Hence, a single-bin SF is considered in order to minimise the statistical uncertainty. The SF is applied to all simulated (background and signal) events containing a di-𝜏 object matched to a hadronically decaying 𝜏+𝜏−pair at generator level.
The following uncertainties are considered in the SF computation. The statistical uncertainty accounts for the limited size of the data and simulated background samples, and is respectively 10.3% and 2.7% relative to the SF. The uncertainty labelled as ‘𝑍 -modelling’ arises from the cross-section (5%) and the acceptance of 𝑍 +jets events. The latter comes from the choice of PDF set, as well as from variations of 𝛼Sand of the renormalisation, factorisation, matrix-element matching and soft-gluon resummation scales in Sherpa.
4The contribution of 𝑍 → 𝜏+𝜏−events in which one of the 𝜏-leptons decays to an electron or muon is negligible. A muon rarely deposits enough energy in the calorimeter to be reconstructed as a sub-jet of the di-𝜏 object. On the other hand, the di-𝜏 reconstruction and identification algorithms provide only little discrimination against 𝑍 → 𝜏+𝜏−events with an electron in the decay chain. However, the lepton veto, which excludes non-isolated electrons, ensures that such events only have a minor contribution.
mass [GeV] τ Visible di-0 20 40 60 80 100 120 140 Events / 20 GeV 40 60 80 100 120 140 mass [GeV] τ Visible di-0.5 1 1.5 Data / Pred. Data τ True di-Multi-jet Others (before SF) τ True di-Uncertainty ATLAS -1 = 13 TeV, 139 fb s 0-tag region τ τ Z (a) [GeV] T p τ Di-0 20 40 60 80 100 120 140 Events / 100 GeV 300 350 400 450 500 550 600 650 700 750 800 [GeV] T p τ Di-0.5 1 1.5 Data / Pred. Data τ True di-Multi-jet Others (before SF) τ True di-Uncertainty ATLAS -1 = 13 TeV, 139 fb s 0-tag region τ τ Z [GeV] < 90 vis τ di-30 < m (b) η τ Di-0 20 40 60 80 100 120 Events / 0.8 2 − −1.5 −1 −0.5 0 0.5 1 1.5 2 η τ Di-0.5 1 1.5 Data / Pred. Data τ True di-Multi-jet Others (before SF) τ True di-Uncertainty ATLAS -1 = 13 TeV, 139 fb s 0-tag region τ τ Z [GeV] < 90 vis τ di-30 < m (c)
Figure 8: Distributions of (a) the visible mass of the di-𝜏 object, (b) its 𝑝Tand (c) 𝜂 in the region labelled as
‘Z𝜏𝜏 0-tag’ in Table2. All simulated events containing a generator-level 𝜏+𝜏−pair matched to a simulated di-𝜏 object are referred to as ‘True di-𝜏’. The lower panels show a bin-by-bin comparison of the data and the predicted total background, in terms of event yield ratios. The hatched bands represent combined statistical and systematic uncertainties.
The uncertainty related to the cross-section and acceptance of the other simulated processes is found to be negligible. The systematic uncertainties arising from the multi-jet background estimate are discussed in
Section7. In all samples of simulated events, the instrumental systematic uncertainties arise primarily
from the mismodelling of large-𝑅 jets, in particular the jet energy scale and resolution, as well as the jet
mass scale and resolution [99]. Uncertainties arising from the mismodelling of the reconstructed energy
(momentum) measurements for electrons (muons), as well as from the mismodelling of their reconstruction and identification efficiencies [77,78], are found to be negligible. The systematic uncertainties arising from the 𝐸Tmissscale and resolution [79], as well as from the mismodelling of pile-up, are taken into account.
Finally, the uncertainty in the combined 2015–2018 integrated luminosity is 1.7% [100], obtained using
the LUCID-2 detector [101] for the primary luminosity measurements.
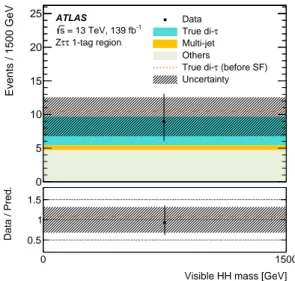
The modelling of di-𝜏 objects from genuine hadronically decaying 𝜏+𝜏−pairs is checked in the region
‘Z𝜏𝜏 1-tag’ with exactly one 𝑏-tagged track-jet in the selected large-𝑅 jet. In the following, for events containing a large-𝑅 jet with 𝑏-tagged track-jets, an additional systematic uncertainty arises from differences between the predicted and measured 𝑏-tagging efficiency and rates at which 𝑐-jets and light-flavour jets are
misidentified as 𝑏-tagged jets [93,102,103]. As shown in Figure9, good agreement between predicted
and measured yields is observed in the region ‘Z𝜏𝜏 1-tag’, within the uncertainties.
Visible HH mass [GeV] 0 5 10 15 20 25 Events / 1500 GeV 0 1500
Visible HH mass [GeV] 0.5 1 1.5 Data / Pred. Data τ True di-Multi-jet Others (before SF) τ True di-Uncertainty ATLAS -1 = 13 TeV, 139 fb s 1-tag region τ τ Z
Figure 9: Predicted and measured event yields in the region labelled as ‘Z𝜏𝜏 1-tag’ in Table2. All simulated events containing a generator-level 𝜏+𝜏−pair matched to a simulated di-𝜏 object are referred to as ‘True di-𝜏’. The main contribution to the background referred to as ‘Others’ comes from the 𝑡 ¯𝑡 process (about 3.6 events). The lower panel shows the event yield ratio of the data and the predicted total background. The hatched bands represent combined statistical and systematic uncertainties.
9 Search for resonant Higgs boson pair production in the 𝒃 ¯
𝒃𝝉
+𝝉
−final
state
The signal region (SR) used in the search for resonant Higgs boson pair production is defined by requiring OS charges for the two leading sub-jets of the di-𝜏 object (𝑄 = −1), |Δ𝜙| < 1, and two 𝑏-tagged track-jets
Higgs boson (60–160 GeV). Finally, a requirement on 𝑚vis𝐻 𝐻 is imposed, which depends on the resonance
mass hypothesis: no requirement is applied if 𝑚𝑋 < 1.6 TeV, whereas the cut-off value is set to 900
(1200) GeV if 𝑚𝑋 ≥ 1.6 (2.5) TeV. These requirements are summarised in the last row of Table2. The
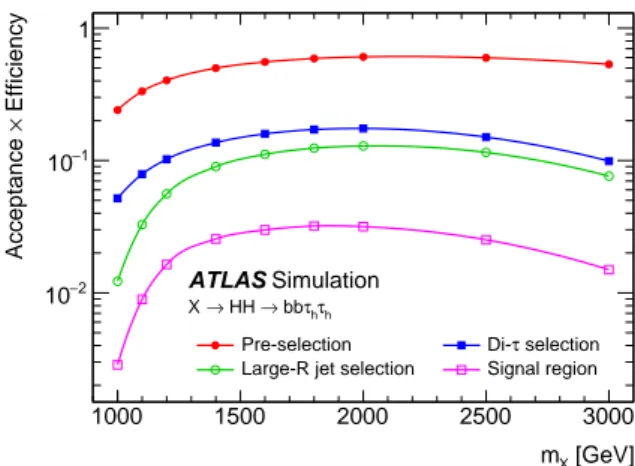
signal acceptance times efficiency at various stages of the event selection is shown in Figure10. The
efficiency at low resonance masses is limited by the trigger thresholds and kinematic requirements on the large-𝑅 jet. 1000 1500 2000 2500 3000 [GeV] X m 2 − 10 1 − 10 1 Efficiency × Acceptance
Pre-selection Di-τ selection
Large-R jet selection Signal region
ATLAS Simulation h τ h τ bb → HH → X
Figure 10: Signal acceptance times selection efficiency as a function of the resonance mass, at various stages of the event selection. From top to bottom: an event preselection (red solid-circle: trigger, object definitions and 𝐸miss
T >10 GeV) is performed first; the requirements on the di-𝜏 object and large-𝑅 jet detailed in the text are then
applied (blue solid-box and green open-circle, respectively); finally, the 𝐻 𝐻 SR definition must be satisfied (pink open-box).
In the SR, the dominant backgrounds arise from multi-jet, 𝑍 𝐻, 𝑍 +hf and 𝑍 +lf events. The multi-jet
background with a misidentified di-𝜏 object is estimated with the data-driven method of Section7. The
distribution shapes of events from the other background processes, with a true di-𝜏 object, are modelled
using simulation, but the data-driven SF computed in Section8is employed for their normalisation. In
addition, the Sherpa event generator was found to underestimate the heavy-flavour contribution in the
𝑍+jets process in previous ATLAS analyses, such as in Ref. [104]. Therefore, the normalisation of the
𝑍 → 𝜏+𝜏−+hf background is further corrected by a normalisation factor derived in a dedicated region
enriched with 𝑍 → ℓ+ℓ−+hf events, where ℓ denotes either an electron or a muon defined as a ‘loose’
lepton in Ref. [104]. This region is selected by requiring two isolated electrons or muons with an invariant
mass 81 GeV < 𝑚ℓ ℓ < 101 GeV and a dilepton transverse momentum 𝑝
ℓ ℓ T
> 300 GeV. In addition, the selected events must contain at least one large-𝑅 jet with 𝑝𝐽T >250 GeV, 𝑚𝐽 > 50 GeV and two associated
𝑏-tagged track-jets. After applying these event selections, the fraction of 𝑍 +hf events is about 80%.
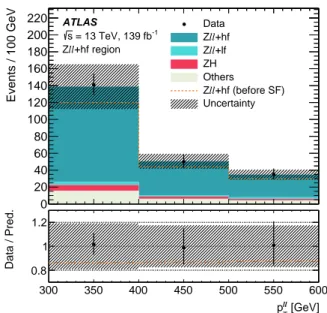
Figure11shows a comparison of the predicted and measured 𝑝ℓ ℓT distributions. After subtracting all other processes from the data and comparing with simulated 𝑍 +hf events, the normalisation factor is found to be 1.20 ± 0.10 (stat) ± 0.28 (syst). The statistical uncertainty accounts for the limited size of the data and simulated event samples, and is respectively 8.3% and 1.7% relative to the normalisation factor. Systematic
uncertainties arise from the instrumental sources detailed in Section8(3.4%) and from neglecting the
differences between the 𝑝Tdistributions of the visible decay products of 𝑍 → ℓ +ℓ−
and 𝑍 → 𝜏+𝜏−, due to the presence of neutrinos in the latter case (23%).
[GeV] ll T p 0 20 40 60 80 100 120 140 160 180 200 220 Events / 100 GeV 300 350 400 450 500 550 600 [GeV] ll T p 0.8 1 1.2 Data / Pred. Data +hf ll Z +lf ll Z ZH Others +hf (before SF) ll Z Uncertainty ATLAS -1 = 13 TeV, 139 fb s +hf region ll Z
Figure 11: Distribution of 𝑝ℓ ℓT in 𝑍 → ℓ+ℓ−events produced in association with heavy-flavour jets. The background labelled as ‘Others’ contains 𝑊 +jets, diboson, 𝑡 ¯𝑡 and single-top-quark events. The lower panel shows a bin-by-bin comparison of the data and the predicted total background, in terms of event yield ratios. The hatched bands represent combined statistical and systematic uncertainties.
and systematic uncertainties. The systematic uncertainties in the multi-jet background estimation and of
instrumental origin are the same as those discussed in Sections7and8. The uncertainty related to the
cross-sections and acceptances of the simulated background processes is found to be negligible compared to the statistical uncertainty. None of the simulated 𝑡 ¯𝑡 events pass the event selection of the 𝐻 𝐻 SR, and hence a +1𝜎 uncertainty of 0.12 events in the associated yield is estimated by considering the simulated events that survive the selection criteria prior to applying requirements on 𝑚𝐽 and 𝑚vis
𝐻 𝐻.
The systematic uncertainties in the modelling of the signal acceptance and efficiency arise from four sources. Those due to missing higher-order corrections are estimated by changing the renormalisation and factorisation scales up and down by a factor of two. Systematic uncertainties arising from the strong coupling parameter are assessed by varying its value. Uncertainties related to the PDF set used for matrix-element generation are computed by comparing the signal acceptance and efficiency across the 100
replicas of the nominal NNPDF2.3LO PDF set, as well as with alternative PDF sets, MMHT2014LO [22]
and CT14 [105]. Finally, the impact of the parton shower and hadronisation modelling is assessed by
comparing the signal acceptance and efficiency between Herwig 7 and Pythia 8 predictions. The latter is the dominant systematic uncertainty in the signal modelling (2–4% for most of the mass hypotheses).
Figure12 shows the 𝑚vis𝐻 𝐻 distribution in the SR, prior to the final selection using that variable. No
significant excess with respect to the background expectation is found and only two events are observed, with 𝑚vis𝐻 𝐻 values of 1012 and 1114 GeV.
In order to extract exclusion limits on the 𝑋 → 𝐻 𝐻 signal cross-section, a single-bin counting experiment is performed for every mass hypothesis, based on a profile-likelihood fit [106]. All sources of systematic uncertainty are accounted for as nuisance parameters that are profiled in the fit. The 95% CL upper
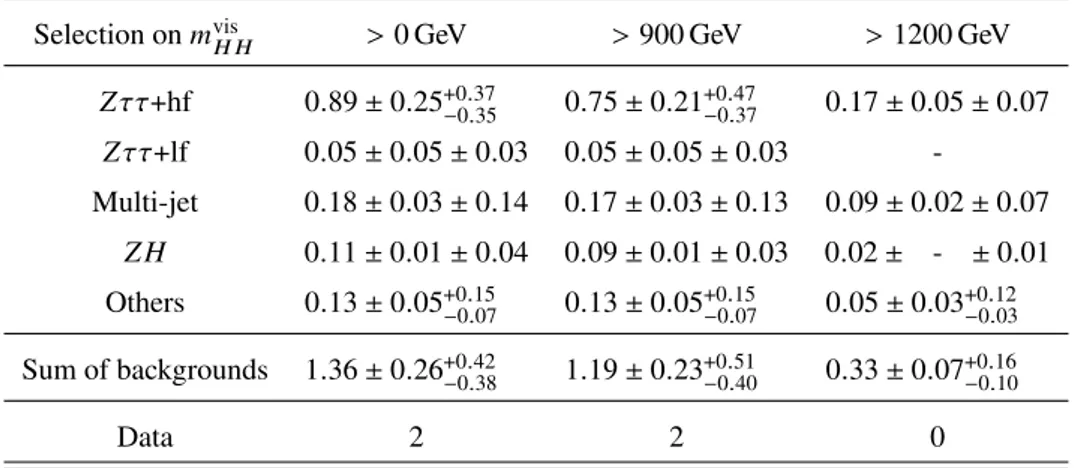
Table 3: Event yields of the various estimated backgrounds and data, computed in the SR of the search for 𝑋 → 𝐻𝐻 → 𝑏 ¯𝑏 𝜏+𝜏−. The background labelled as ‘Others’ contains 𝑊 +jets, diboson, 𝑡 ¯𝑡 and single-top-quark events. Statistical and systematic uncertainties are quoted, in that order. The background yields and uncertainties are pre-fit and are found to be similar to those post-fit. A dash ’-’ indicates a yield or uncertainty below 0.01.
Selection on 𝑚vis𝐻 𝐻 >0 GeV >900 GeV >1200 GeV
𝑍 𝜏 𝜏+hf 0.89 ± 0.25+0.37 −0.35 0.75 ± 0.21+0.47−0.37 0.17 ± 0.05 ± 0.07 𝑍 𝜏 𝜏+lf 0.05 ± 0.05 ± 0.03 0.05 ± 0.05 ± 0.03 -Multi-jet 0.18 ± 0.03 ± 0.14 0.17 ± 0.03 ± 0.13 0.09 ± 0.02 ± 0.07 𝑍 𝐻 0.11 ± 0.01 ± 0.04 0.09 ± 0.01 ± 0.03 0.02 ± - ± 0.01 Others 0.13 ± 0.05+0.15−0.07 0.13 ± 0.05+0.15−0.07 0.05 ± 0.03+0.12−0.03 Sum of backgrounds 1.36 ± 0.26+0.42−0.38 1.19 ± 0.23+0.51−0.40 0.33 ± 0.07+0.16−0.10 Data 2 2 0 600 800 1000 1200 1400 1600 1800 2000
Visible HH mass [GeV] 1 2 3 4 5 6 Events Data =1.2 TeV) X HH (m → X =3.0 TeV) X HH (m → X +hf τ τ Z +lf τ τ Z Multi-jet ZH Others Uncertainty ATLAS -1 = 13 TeV, 139 fb s Signal region
Figure 12: Distributions of 𝑚vis𝐻 𝐻 after applying all the event selections that define the 𝐻 𝐻 SR, except the requirement
on 𝑚vis𝐻 𝐻. The background labelled as ‘Others’ contains 𝑊 +jets, diboson, 𝑡 ¯𝑡 and single-top-quark events. The
𝑋 → 𝐻𝐻 → 𝑏 ¯𝑏 𝜏+𝜏−signal is overlaid for two resonance mass hypotheses with a cross-section set to the expected limit, while all backgrounds are pre-fit. The first and the last bins contain the underflow and overflow bin entries, respectively. The hatched bands represent combined statistical and systematic uncertainties.
Because both the expected and observed event yields are small, the distribution of the test statistic is sampled by generating pseudo-experiments. For each mass hypothesis, 10 000 background-only and 10 000 signal+background pseudo-datasets are produced, and the exclusion limits are obtained by scanning the
signal strength and interpolating to find the value at which CLs= 0.05. The corresponding upper limits on
the production cross-section of a heavy, narrow, scalar resonance decaying into a pair of Higgs bosons are
shown in Figure13.
Two different requirements are applied to 𝑚vis𝐻 𝐻 for the resonance mass hypotheses of 1.6 TeV and 2.5 TeV, leading to discontinuities in the limits (at 1.6 TeV, the difference between imposing no requirement and 𝑚vis
𝐻 𝐻
>900 GeV is less than 1% though). The more stringent requirement on 𝑚vis
𝐻 𝐻 reduces the expected
background for resonance mass hypotheses beyond 2.5 TeV, and no data events survive. This leads to an observed exclusion limit slightly below the expected limit. For resonance masses in the range 1.2–3.0 TeV,
the observed (expected) 95% CL upper limits lie between 94 and 28 fb (74 and 32 fb). For 𝑚𝑋 = 1.0 TeV,
where the analysis is least optimal, mostly due to the 𝑝Trequirements on the large-𝑅 jet at both the trigger and analysis levels, the observed (expected) limit becomes 817 fb (624 fb). These 95% CL upper limits are driven mainly by the statistical uncertainties of the data sample. The relative impact of the systematic uncertainties is estimated by comparing the expected upper limits when taking or not into account the nuisance parameters in the statistical analysis. For resonance mass hypotheses in the range 1.2–2.0 TeV, the expected upper limits deteriorate by 20–30%, mostly due to the uncertainties in the di-𝜏 reconstruction. At lower masses, the uncertainties in the large-𝑅 jet energy and mass scales further affect the expected upper limits (the largest impact from all nuisance parameters reaches 85% at 1 TeV). On the other hand, systematic uncertainties are found to have a negligible impact (less than 10%) on the expected upper limits for mass hypotheses beyond 2.5 TeV.
1000 1500 2000 2500 3000 [GeV] X m 10 2 10 3 10 HH) [fb] → X → (pp σ 95% CL limits on Observed Expected σ 1 ± σ 2 ± ATLAS -1 = 13 TeV, 139 fb s ) h τ h τ HH (bb → X
Figure 13: Expected and observed 95% CL upper limits on the production cross-section of a heavy, narrow, scalar resonance decaying into a pair of Higgs bosons (𝑋 → 𝐻 𝐻). The final state used in the search consists of a boosted 𝑏 ¯𝑏 pair and a boosted hadronically decaying 𝜏+𝜏−pair, and the SM branching fractions of the Higgs boson are assumed. The ±1𝜎 and ±2𝜎 variations about the expected limit are indicated by the green and yellow bands, respectively.
10 Conclusion
In this paper, analysis techniques using large-radius jets and exploiting jet substructure are used in the ATLAS
experiment to reconstruct and identify boosted di-𝜏 systems. These can arise from the decay 𝐻 → 𝜏+𝜏−of
a Higgs boson with a large Lorentz boost. A dedicated benchmark of the di-𝜏 tagger is designed to search for resonant Higgs boson pair production in the high-mass regime, 𝑋 → 𝐻 𝐻 → 𝑏 ¯𝑏 𝜏+𝜏−, where only final states with two hadronically decaying 𝜏-leptons are considered. This benchmark corresponds to a 60% di-𝜏 identification efficiency and a rejection factor of 104for the background of quark- or gluon-initiated jets misidentified as boosted di-𝜏 objects. The efficiency of the di-𝜏 tagger is determined using 139 fb−1of LHC proton–proton collision data at
√
𝑠= 13 TeV.
The search for resonant Higgs boson pair production via gluon–gluon fusion is carried out using the same dataset. No significant deviations from the Standard Model predictions are observed, and 95% confidence-level upper limits are set on the production cross-section of a heavy, narrow, scalar resonance decaying into a pair of Higgs bosons. Assuming SM branching fractions for the Higgs boson, the observed (expected) limits on the 𝑋 → 𝐻 𝐻 production cross-section lie between 94 and 28 fb (74 and 32 fb) for resonance mass hypotheses in the range 1.2–3.0 TeV.
Acknowledgements
We thank CERN for the very successful operation of the LHC, as well as the support staff from our institutions without whom ATLAS could not be operated efficiently.
We acknowledge the support of ANPCyT, Argentina; YerPhI, Armenia; ARC, Australia; BMWFW and FWF, Austria; ANAS, Azerbaijan; SSTC, Belarus; CNPq and FAPESP, Brazil; NSERC, NRC and CFI, Canada; CERN; ANID, Chile; CAS, MOST and NSFC, China; COLCIENCIAS, Colombia; MSMT CR, MPO CR and VSC CR, Czech Republic; DNRF and DNSRC, Denmark; IN2P3-CNRS and CEA-DRF/IRFU, France; SRNSFG, Georgia; BMBF, HGF and MPG, Germany; GSRT, Greece; RGC and Hong Kong SAR, China; ISF and Benoziyo Center, Israel; INFN, Italy; MEXT and JSPS, Japan; CNRST, Morocco; NWO, Netherlands; RCN, Norway; MNiSW and NCN, Poland; FCT, Portugal; MNE/IFA, Romania; MES of Russia and NRC KI, Russia Federation; JINR; MESTD, Serbia; MSSR, Slovakia; ARRS and MIZŠ, Slovenia; DST/NRF, South Africa; MICINN, Spain; SRC and Wallenberg Foundation, Sweden; SERI, SNSF and Cantons of Bern and Geneva, Switzerland; MOST, Taiwan; TAEK, Turkey; STFC, United Kingdom; DOE and NSF, United States of America. In addition, individual groups and members have received support from BCKDF, CANARIE, Compute Canada and CRC, Canada; ERC, ERDF, Horizon 2020, Marie Skłodowska-Curie Actions and COST, European Union; Investissements d’Avenir Labex, Investissements d’Avenir Idex and ANR, France; DFG and AvH Foundation, Germany; Herakleitos, Thales and Aristeia programmes co-financed by EU-ESF and the Greek NSRF, Greece; BSF-NSF and GIF, Israel; La Caixa Banking Foundation, CERCA Programme Generalitat de Catalunya and PROMETEO and GenT Programmes Generalitat Valenciana, Spain; Göran Gustafssons Stiftelse, Sweden; The Royal Society and Leverhulme Trust, United Kingdom.
The crucial computing support from all WLCG partners is acknowledged gratefully, in particular from CERN, the ATLAS Tier-1 facilities at TRIUMF (Canada), NDGF (Denmark, Norway, Sweden), CC-IN2P3 (France), KIT/GridKA (Germany), INFN-CNAF (Italy), NL-T1 (Netherlands), PIC (Spain), ASGC
(Taiwan), RAL (UK) and BNL (USA), the Tier-2 facilities worldwide and large non-WLCG resource providers. Major contributors of computing resources are listed in Ref. [108].