Publisher’s version / Version de l'éditeur:
Proceedings of 36th Conference on Coastal Engineering, Baltimore, Maryland,
2018, p. 59, 2018-12-30
READ THESE TERMS AND CONDITIONS CAREFULLY BEFORE USING THIS WEBSITE. https://nrc-publications.canada.ca/eng/copyright
Vous avez des questions? Nous pouvons vous aider. Pour communiquer directement avec un auteur, consultez la première page de la revue dans laquelle son article a été publié afin de trouver ses coordonnées. Si vous n’arrivez pas à les repérer, communiquez avec nous à [email protected].
Questions? Contact the NRC Publications Archive team at
[email protected]. If you wish to email the authors directly, please see the first page of the publication for their contact information.
Archives des publications du CNRC
This publication could be one of several versions: author’s original, accepted manuscript or the publisher’s version. / La version de cette publication peut être l’une des suivantes : la version prépublication de l’auteur, la version acceptée du manuscrit ou la version de l’éditeur.
For the publisher’s version, please access the DOI link below./ Pour consulter la version de l’éditeur, utilisez le lien DOI ci-dessous.
https://doi.org/10.9753/icce.v36.papers.59
Access and use of this website and the material on it are subject to the Terms and Conditions set forth at
Design and physical model studies of innovative living breakwaters
Baker, Scott; Brashear, Pippa; Tschirky, Paul; Marrone, Joseph; Larson, Max
https://publications-cnrc.canada.ca/fra/droits
L’accès à ce site Web et l’utilisation de son contenu sont assujettis aux conditions présentées dans le site LISEZ CES CONDITIONS ATTENTIVEMENT AVANT D’UTILISER CE SITE WEB.
NRC Publications Record / Notice d'Archives des publications de CNRC:
https://nrc-publications.canada.ca/eng/view/object/?id=77b8461b-7b85-4796-9355-ca1fcc113e0f https://publications-cnrc.canada.ca/fra/voir/objet/?id=77b8461b-7b85-4796-9355-ca1fcc113e0f1
Scott Baker1, Pippa Brashear2, Paul Tschirky3, Joseph Marrone4, and Max Larson5
This paper describes two separate but closely related physical models conducted to support the detailed design of the Living Breakwaters project located in Raritan Bay, New York. One study focused on optimizing and verifying the breakwater design elements to ensure they were well adapted to typical and extreme conditions, while the second study focused on verifying the overall performance of multiple living breakwaters in terms of wave attenuation and impacts on nearshore wave-induced circulation. These investigations generated a large quantity of valuable information concerning the design and performance of the breakwaters that will be used to optimize and support the final design and obtain the necessary permits required for construction.
Keywords: rubble-mound breakwater; living breakwater; physical modeling
PROJECT BACKGROUND AND INNOVATION
In June 2013, the US Department of Housing and Urban Development (HUD) launched “Rebuild by Design”, a design competition to respond to the devastation caused by Superstorm Sandy and to help the impacted region plan and design more resilient communities for the future. The competition was a year-long process during which interdisciplinary design teams engaged with regional experts, government entities, elected officials, non-governmental organizations, and local community groups to develop innovative resilience proposals for some of the most impacted communities in the region. HUD announced the winning proposals in June 2014. The Living Breakwaters: Tottenville Pilot Project for the south shore of Staten Island was one of the seven projects selected for HUD funding. As a result, HUD allocated $60 million in Community Development Block Grant Disaster Recovery program funds to the New York State Governors Office of Storm Recovery (GOSR) to implement the project. GOSR selected a design team led by SCAPE Landscape Architecture D.P.C. for the design of the Living Breakwaters project. Arcadis of New York, Inc. was responsible for the coastal modeling efforts, while COWI North America, Inc. led the coastal engineering design work for the project.
The Living Breakwaters project is an innovative concept consisting of a one mile (1.61 km) long system of breakwaters with reef-like habitat enhancements specifically designed to attenuate damaging storm waves, reduce or reverse long-term coastal erosion, enhance ecosystems by creating structured marine habitat, and foster social resilience by encouraging the use and stewardship of the shoreline and nearshore waters.
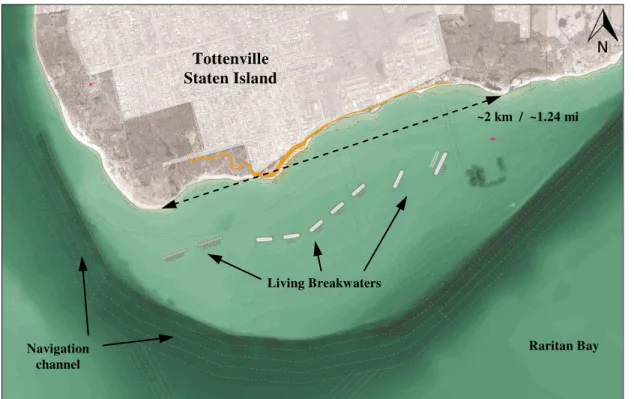
The Living Breakwaters project will be located in the waters of Raritan Bay (Lower New York Harbor) along the shoreline of Tottenville and Conference House Park at the southern tip of Staten Island (see Figure 1). Raritan Bay is a shallow estuary that has historically supported commercial fisheries and shell-fisheries which have been depleted by habitat degradation over the last century. Similarly, the Tottenville shoreline was once a vibrant destination for water-based recreation, but has suffered from high rates of erosion over the past decades, likely due in part to the loss of the extensive oyster reefs that once extended across the shallow waters of the bay, filtering water, enhancing the biodiversity and quality of the fisheries in the lower Harbor, and buffering the south shore from erosion-causing wave action. This area of Staten Island experienced significant wave damage during Superstorm Sandy.
The breakwaters themselves will be constructed with a combination of stone and bio-enhancing concrete units designed to withstand waves from Sandy-like events, as well as create habitat, promoting recruitment and growth of marine organisms. The Living Breakwaters project is intended to support a more resilient Tottenville in Staten Island, while serving as an example for potential integration by other coastal communities in the region (adapted from GOSR, 2017).
The Living Breakwaters are rubble-mound breakwaters, but unlike typical breakwaters, the Living Breakwaters incorporate a variety of integral habitat features to enhance their habitat performance without sacrificing their ability to attenuate waves or manage sediment. These features include “reef
1
National Research Council Canada, Ottawa, ON, Canada, [email protected]
2
SCAPE, New York, NY, USA [email protected]
3
Geosyntec Consultants (formerly with Arcadis), Baton Rouge, LA, USA, [email protected]
4
Arcadis, Sandy Hook, CT, USA, [email protected]
5
ridges” and “reef streets”. The reef ridges are closely-spaced rocky protrusions that extend from the main body of the breakwater segment toward the ocean side. The reef streets are the resulting narrow spaces created between them and are utilized as semi-sheltered habitat. Together, they dramatically increase the intertidal and subtidal zones of the breakwaters, which serve as an area of productive edge habitat and enhance the ecological performance of the breakwaters.
Two types of bio-enhancing concrete units will be incorporated into the breakwater design. Unlike typical cubic concrete armor units, ECOncrete® Armor Units have recesses and striations formed into five of their six sides which are designed to increase surface complexity in order to enhance the marine environment by encouraging growth of various marine organisms, reduce the influence of invasive species, and enhance biodiversity. The armor units proposed for the Living Breakwaters project are cubes measuring 3.94 ft (1.20 m), and will replace stone armor units in the subtidal zone of the breakwaters in select locations. ECOncrete® Tide Pools are designed to create well-defined local ecosystems that simulate natural “tide pools” typical to rocky coasts. The Tide Pools proposed for the Living Breakwaters project are approximately 4.04 ft (1.23 m) long by 3.71 ft (1.13 m) wide by 2.23 ft (0.68 m) tall, and will be placed within the tidal zone on the reef ridges and along the breakwater trunk. Some tide pools are also proposed for use at higher elevations (above MHW) on the leeside face and crest.
Figure 1. Conceptual breakwater layout at the southern tip of Staten Island.
BREAKWATER DESIGN CRITERIA
Figure 2 shows the conceptual Living Breakwater design, which includes a linear trunk section with two roundheads and several reef ridges and reef streets. Water depths at the project site are relatively shallow, ranging between approximately −6 ft (−1.83 m) and −11 ft (−3.35m) (all elevations are given relative to North American Vertical Datum of 1988). Tides at the project site range from −2.62 ft (−0.80 m) (Mean Low Water) to +2.08 ft (+0.63 m) (Mean High Water), while the 100-year storm surge level is +12.9ft (+3.93 m). An extreme water level of +15.4 ft (+4.69 m) was also investigated to account for a severe storm surge with an allowance for 2.5 ft (0.76 m) of sea level rise. Based on a 30-yr wave hindcast, the largest waves tend to approach the project site from the East where the fetch is greatest. The 100-year design storm wave is characterized by a significant wave height of 5.3ft (1.62 m) and peak period of 5.0s. An overload condition with a significant wave height of 7.7ft (2.35 m) and peak period of 7.0s was also investigated.
Raritan Bay Navigation channel Living Breakwaters
Tottenville
Staten Island
~2 km / ~1.24 miFigure 2. Conceptual breakwater design with multiple reef ridges and reef streets.
Figure 3 depicts the low-crested Type A breakwater variant, which features a crenelated crest and numerous reef ridges. The Type A structure is intended for a shallower water area at the western end of the project site, with a mudline depth of −6 ft (−1.83 m) and a crest height of only +5 ft (+1.52 m). The crenelated crest comprises a series of low “saddles” at elevation +1.08 ft (+0.33 m), or one foot below mean high water, along the breakwater. In addition to the reef ridges, these saddles expand the area of intertidal habitat and increase typical flushing and water movement in the reef streets, contributing to greater habitat diversity across the project. Under typical day-to-day conditions, the water levels follow the normal tidal cycle, which will see the reef ridges and saddles go through cycles of being partially exposed and slightly submerged, while the rest of the breakwater trunk remains emergent. Under storm conditions (with extreme surge levels), the entire Type A structure would be completely submerged.
Figure 3. Type A low-crested breakwater design with crenelated crest.
Figure 4 depicts the high-crested Type B breakwater variant, which features an unbroken emergent crest and fewer reef ridges. The Type B structure is intended for a slightly deeper water area across the center of the project site, with a mudline depth of −8 ft (−2.44 m) and a crest height of +14 ft (+4.27 m). Similar to the Type A structure, the water levels will follow the normal tidal cycle under typical day-to-day conditions, which will see the reef ridges go through cycles of being partially exposed and slightly submerged while the bulk of the breakwater trunk remains fully emergent. Under storm conditions (with extreme surge levels), only a small portion of the breakwater crest would remain emergent.
Figure 4. Type B high-crested breakwater design.
SUBTIDAL ZONE INTERTIDAL ZONE EMERGENT CREST SUBMERGED SADDLE EMERGENT CREST SUBTIDAL ZONE INTERTIDAL ZONE REEF STREET REEF RIDGE
A third breakwater variant (identified as Type C) is effectively the same as the Type B variant; however it also features a leeside berm just below MHW. The Type C structures are intended for a slightly deeper water area at the eastern end of the project site, with a mudline depth of −10.5 ft (−3.20 m) and a crest height of +14 ft (+4.27 m).
PHYSICAL MODELING STUDIES
The National Research Council (NRC) was commissioned by Arcadis and SCAPE to conduct physical modeling studies to confirm and refine the initial breakwater design and layout for the Living Breakwaters project. The overall objectives for the physical model studies were: (1) to determine optimal gradations for reef ridge stone classifications, (2) to test and understand any design implications of the crenelated crest and tide pools for the low-crested breakwaters, (3) to confirm optimized breakwater height / width ratio, (4) to determine wave transmission characteristics at higher tide levels, and (5) to qualitatively determine flow characteristics and sedimentation in, on, and around reef ridge / street features for ecological design.
A two-pronged approach involving the design, construction, and operation of two separate but closely related physical models was undertaken to achieve these objectives.
Breakwater Features and Sections Study
Model Setup. The breakwater features and sections study used a combination of 2D and 3D physical modeling and focused on confirming and refining the stability and design of the various Living Breakwater elements and features, particularly for extreme events. The study was conducted in NRC’s 206 ft (62.79 m) long by 46 ft (14.02) m wide by 5 ft (1.52) m tall Coastal Wave Basin. The basin is equipped with a powerful computer-controlled wave machine capable of generating irregular long-crested waves with significant wave heights up to ~1.15 ft (~0.35 m), and is well-suited for assessing the performance of coastal structures in long-crested waves approaching from a singular direction. A relatively large model length scale of 1:20 was used in order to ensure that the wave-driven flows around the model armor stones/units remained rough-turbulent at all times (as in nature), thus increasing model accuracy and ensuring scale effects due to differences in Reynolds number in the model and at full scale were minimized as much as possible.
In order to properly model nearshore wave transformations, a scale model of an idealized foreshore bathymetry was constructed based on transects of the bathymetric data heading offshore from each of the proposed breakwaters. For these tests, the basin floor was set to a depth of −20 ft (−6.10 m) (relative to MSL). A 1:15 slope was modelled between the depths of −20 to −15 ft (−6.10 to −4.57 m), while a 1:175 slope was modelled between the depths of −15 to −5.5 ft (−4.57 to −1.68 m), which was a good representation of the existing seabed fronting the various breakwaters. This representative foreshore allowed construction of various types of breakwaters at different locations to account for the different depths at each structure. The model bathymetry was constructed using a network of plywood templates placed at 3.28 ft (1.00 m) model scale intervals. The templates were erected on a grid of levelled pads and backfilled with fine gravel, which was then compacted to a level approximately 2” (5 cm) below the top of the templates. The 2” (5 cm) gap was filled with a skin of concrete grout that was screeded to match the contours defined by the templates. A smooth finish was achieved through a combination and hand and mechanical troweling.
Model stone materials and gradations were prepared to replicate, so far as reasonably possible, the characteristics of the proposed prototype materials. Five different classes of stone material were defined; three armor classes featuring relatively narrow gradations, and two core classes featuring comparatively wider gradations. Equivalent stone materials at model scale were obtained by sieving locally available crushed limestone aggregate, separating it into different sizes. In some instances, the sieved material was used directly in the model, while in other cases, two or more different stone sizes were blended together to produce a stone class that matched the specifications.
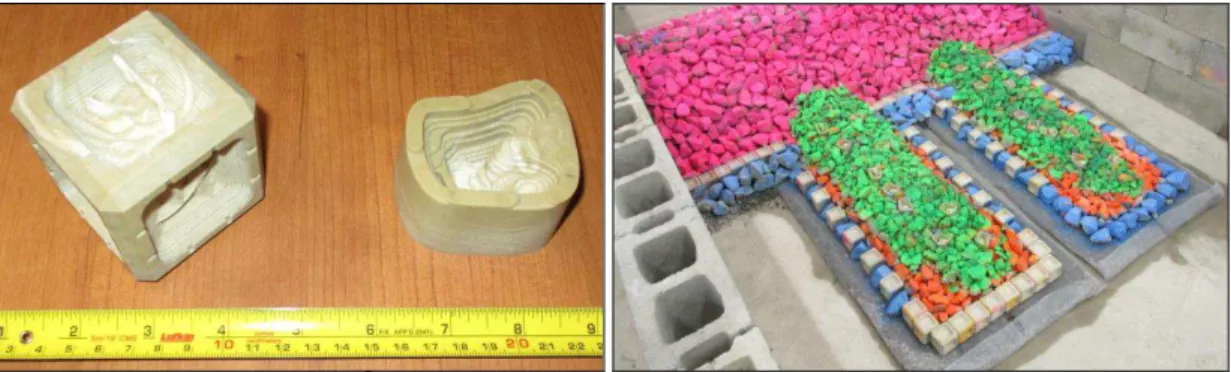
Model scale versions of both types of ECOncrete® units were fabricated (by a third party) for this study (see Figure 5). 3D drawings of the prototype units were geometrically scaled to an equivalent model size (20 times smaller) in order that the model units would be dimensionally accurate. The model scale drawings were used to create a precision re-useable mold for each unit type. The model scale units were produced by an injection molding process using a specially-formulated high-strength resin. Approximately 265 model armor units and 200 model tide pool units were fabricated for this study.
The dimensions (and volumes) of the scale model units were geometrically identical to the prototype versions, however the model unit mass and density was lighter than desired. One of the main reasons for this discrepancy is that the resin material used to mold the model units had a material density of ~144 lb/ft3 (~2,300 kg/m3), whereas the prototype units are intended to be cast with concrete having a density of ~150 lb/ft3 (~2,400 kg/m3). Additionally, injection molding is typically used to fabricate thin-walled parts. Due to the relative thickness of the model units, the injection molding process inevitably resulted in tiny void spaces that further reduced the overall unit weight (especially in the case of the thicker cubic armor units). It should be noted that casting the model units with concrete or another similar material was investigated at the outset of the project, but rejected because it would have been far more time- consuming and more costly; therefore injection molding was selected as the preferred alternative.
Accounting for the difference in material density, as well as the freshwater used in the model to represent seawater, the prototype ECOncrete® Armor Units had a target weight of 5,803 lb (2,632 kg), whereas the model units represented an equivalent prototype unit of 5,439 lb (2,467 kg) (approximately 6% lighter). Similarly, the prototype ECOncrete® Tide Pools had a target weight of 3,095 lb (1,404 kg), whereas the model units represented an equivalent prototype unit of 2,937 lb (1,332 kg) (approximately 5% lighter). Therefore, the model is expected to provide a conservative assessment of unit stability.
Figure 5. Model scale ECOncrete® units fabricated and tested during this study.
A series of undisturbed wave tests (after construction of the model bathymetry, but before construction of any breakwater models) was conducted to obtain and verify the wave machine command signals required to produce the desired wave conditions at the test site. During the wave calibration phase, two-hour long (prototype) versions of each sea state were generated in the basin, and the resulting wave conditions were measured throughout the model domain at fourteen different locations using capacitance-wire wave gauges. An iterative procedure was followed to obtain a set of wave machine command signals which produced measured wave conditions that were in close agreement with specifications.
A photographic damage analysis system comprising eight remotely-operated digital cameras was used to monitor the movement of armor stones on the surface of the breakwaters. Since each camera remained fixed throughout a test series, the movement on individual stones could be detected by comparing photographs taken at different times.
Model Testing. Three unique test series were conducted, involving the construction and investigation of various 2D and 3D breakwater cross-sections. In each test series, breakwater stability was assessed over a range of incident conditions with varying wave heights, wave periods, and water levels.
For Test Series A and B, five parallel concrete block walls were erected in the basin to form four 130 ft (39.6 m) wide flumes (prototype). The flumes were used to simultaneously model and assess the performance of four different 2D breakwater cross-sections.
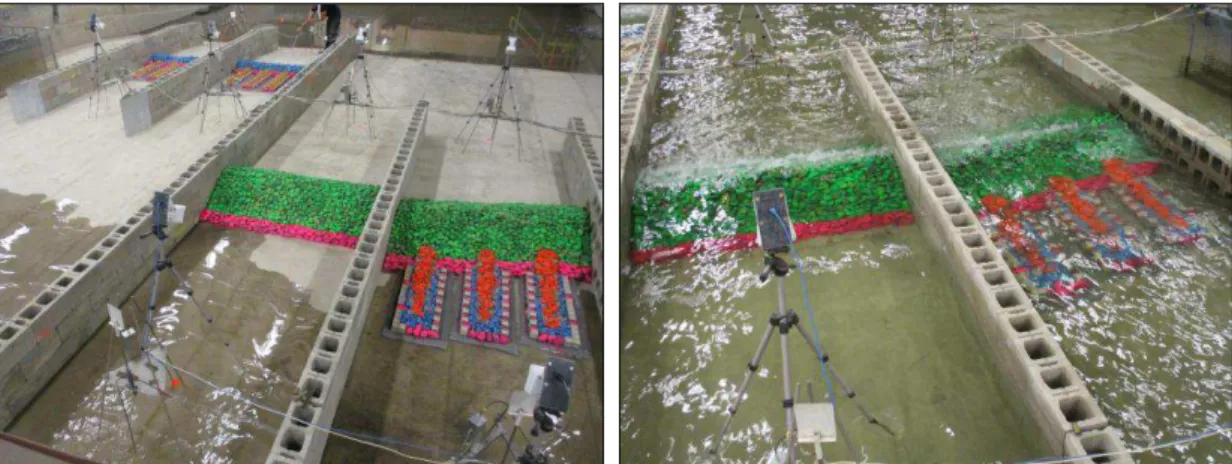
During Test Series A (see Figure 6), Structures 1 and 2 were Type A breakwater cross-sections constructed at the −6 ft (−1.83 m) contour. Structure 1 featured a crenelated crest, while Structure 2 had an unbroken crest, and each cross-section featured four reef ridges. Structure 3 was a Type B breakwater cross-section without any reef ridges, and was constructed at the −8 ft (−2.44 m) contour. Structure 4 was similar to Structure 3, but included three reef ridges, and was constructed with the trunk at a 15° angle relative to the incident waves.
Careful attention was given to the location, dimensions, composition, and methods of construction of the model structures to ensure that they replicated the proposed designs accurately and faithfully. Core material was bulk-placed by shovel, and then gently hand-packed to match the desired profile using wooden trowels. The armor stone, cubic armor units, and tide pool units were individually placed by hand, to simulate the prototype techniques of placement by crane/excavator and to achieve an appropriate amount of interlocking with neighboring units. The core and armor layers of each structure were painted with different colors to assist in visualizing stone motion and damage.
Figure 6. Breakwater model setup and testing for Test Series A.
The measured transmission coefficients for both a standard crest section and the crenulated crest section are shown in Figure 7. In general, the crenulations appeared to have little effect on transmission coefficient. A slightly larger transmission coefficient was observed for a freeboard of around 3 ft (0.91 m), where the bottom of the crenulations is near to the water level.
Figure 7. Transmission coefficient versus breakwater freeboard.
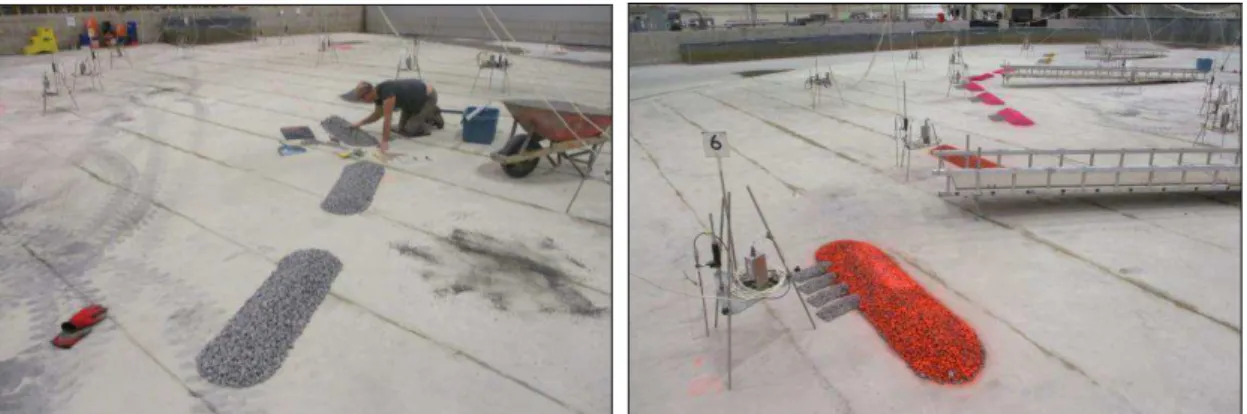
During Test Series B (see Figure 8), Structure 5 was a Type C breakwater with two reef ridges and a leeside berm, and was constructed at the −10.5 ft (−3.20 m) contour. Structure 6 was constructed as a
Type B breakwater located at the −8 ft (−2.44 m) contour with a lower crest height and without reef ridges. Structure 7 was similar to Structure 6, but with a wider crest. Structure 8 was essentially the same as Structure 3, but included an arrangement of emergent tide pools (placed above MHW).
Figure 8. Breakwater model testing for Test Series B.
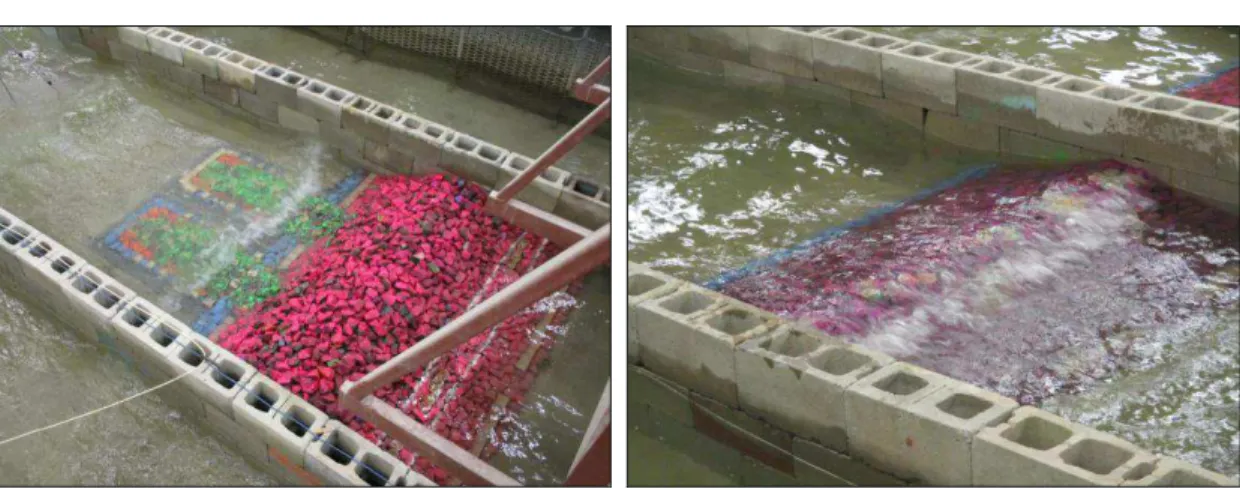
For Test Series C, the flumes were removed to facilitate construction of a 3D model of the breakwaters, for the purpose of assessing the effects of structure orientation, oblique incidence of waves, and roundhead design on armor stability (see Figure 9). Test Series C featured two Type B breakwaters with four reef ridges and one roundhead each. Structure 9 was angled such that the trunk was at a -35° angle relative to the incident wave crests, while the trunk of Structure 10 was angled at +5°. The reef ridges were each oriented at a 15° relative to the breakwater trunk. The two structures were connected by a ‘dummy’ section, and were positioned within the basin such that the adjoining centerlines met at the −8 ft (−2.44 m) contour. As previously described, careful attention was given to the location, dimensions, composition, and methods of construction of the model structures to ensure that they replicated the proposed designs accurately and faithfully.
Figure 9. Breakwater model setup and testing for Test Series C.
Model Conclusions. In general, the stability of the proposed cross-sections was adequate under design and overload conditions; however there were several recommendations made regarding prototype placement requirements for the bio-enhancing concrete units. In particular, due to the relatively large size and spherical nature of the armor stones, it was difficult to find a solid footing for the tide pool armor units placed along the breakwater trunk while also achieving some degree of interlocking with adjacent stones. In some cases, the only way to achieve an acceptable placement was to reorient one or more neighboring armor stones to provide a better foundation. Rather than a flat bottom, it may be worthwhile to incorporate a roughened/notched underside to provide a greater degree of interlocking with the armor stones on which the unit rests. Alternatively, a bedding layer of smaller stones could be used. Tide pools placed on the crest (emergent habitat) were unstable under oblique waves during the 100-yr storm surge water level. Emergent habitat should preferably be placed on the leeward side of the structure, and units placed at lower elevations will be more protected from potentially damaging overtopping flows during storm events at high water level.
The cubic armor units placed along the reef ridge toe were stable in both design and overload conditions. Alternating toe armor stones and cubes along the sides of the reef ridges were stable, provided that the stones were of similar dimensions as the adjacent cubes. Alternating toe armor stones and cubes was not recommended on the head of the reef ridges; either an all-stone or all-cube treatment is recommended. The finer fraction of reef ridge armor was observed to be mobile in both design and overload conditions (for tests at or below MHW), but this did not affect the overall stability of the ridge.
Breakwater System Layout Study
Model Setup. The system layout study focused on validating the overall performance of the Living Breakwaters system, including the degree of wave attenuation along the Staten Island shoreline, for a range of mild to extreme conditions. The study was conducted in NRC’s 165.5 ft (50.44 m) by 97 ft (29.56 m) Large Area Basin, which is equipped with a state-of-the-art directional wave generator. The basin can also be equipped with smaller portable wave machines, capable of producing long-crested waves with heights up to ~0.46 ft (~0.14 m). While the Breakwater Features and Section modeling required a relatively large model scale in order to properly investigate issues related to breakwater stability, the Breakwater System study focused on the overall performance of the nine breakwaters in terms of wave attenuation and wave-structure interactions, and as such was conducted at a comparatively smaller model scale of 1:80. This scale represents a reasonable compromise between minimizing scale and boundary effects without exceeding the limits of the testing facility.
Since breakwater stability was not a focus for this part of the study, a simplified approach to scaling the weight of armor stone was followed. In this case, the model armor stone was purposely selected to be slightly oversized to prevent damage during the course of testing, while the sizing of the model core stone was selected to be reasonably similar to the prototype such that wave transmission through the model breakwaters would behave similarly.
In order to properly model nearshore wave transformations, a faithful 1:80 scale model bathymetry was constructed for this study. The model bathymetry was designed based on existing seabed surveys. Transects through the topographic and bathymetric data were extracted along pre-set gridlines, with data points obtained every 10 ft (3.05 m) (prototype scale) along the length of each gridline (which ran approximately north-south). The gridlines themselves were spaced 3.28 ft (1.00 m) apart at model scale (approximately east-west), equivalent to 262.5 ft (80.0 m) at prototype.
The model was oriented within the basin so that the segmented wave generator lay along the 20°-200° bearing. With this orientation and layout, the breakwater system could be tested with multi-directional waves approaching from directions in the range of 80° to 140°. This layout also allowed for the use of a portable wave machine for generating long-crested waves approaching from 247.5°.
The model bathymetry was accurately modelled from the −40 ft (−12.19 m) depth contour (approximately the depth of the navigation channel) up to the mean high waterline. Above the mean high waterline, the actual topographic data was modified to create a mild (1:10) slope up to a flat observation and working area at +25 ft (+7.62 m) elevation. Realistic topographic features were not recreated above MHW. Consequently, the model was not used or intended to evaluate inland flooding, and does not provide an accurate representation of areas that were flooded during Hurricane Sandy, which was beyond the scope of the current study. Nevertheless, several streets and dwellings were painted onto the observation area to provide a sense of scale and location.
The model bathymetry was similarly constructed using a network of plywood templates (as described in the Breakwater Features and Sections model). The templates were installed, backfilled with fine gravel, and topped with a skin of concrete grout that was screeded to match the contours defined by the templates.
The test facility was equipped with a state-of-the-art directional wave generator, featuring 72 independent wave boards that can generate short- or long-crested sea states with significant wave heights up to ~1.3 ft (~0.40 m), which was used to generate most of the incident wave conditions. For a few cases, the facility was also equipped with a smaller portable wave machine, capable of producing long-crested waves with heights up to ~0.46 ft (~0.14 m), to verify the breakwater system performance for waves approaching ~160° relative to the dominant wave direction.
A series of undisturbed wave tests (after construction of the model bathymetry, but before construction of the proposed system of breakwaters) was conducted to obtain and verify the wave machine command signals required to produce the desired wave conditions at the test site. An iterative procedure was followed to obtain a set of wave machine command signals which produced measured wave conditions that were in close agreement with specifications.
Wave conditions throughout the model domain were measured at twenty-one different locations using capacitance-wire wave gauges. At one location, four gauges were arranged in a compact array in order to collect the information necessary to resolve the directional properties of the wave field. Initially, four wave gauges were placed in deeper water just offshore of the model bathymetry, seven gauges were placed in intermediate water depths along the proposed alignment of the nine breakwaters, and the remaining eight gauges were placed in shallower waters near the shoreline. A number of wave gauges were relocated at various stages of the model testing in order to better understand the wave field, particularly in the nearshore area. Several gauges remained in fixed locations throughout the test program, which permitted the comparison of incident wave data across different test series to ensure consistent and repeatable wave generation.
Velocities were measured using two 2-axis electromagnetic current meters. The velocity measurements were analyzed to resolve the speed and direction of the low-frequency (wave-induced current) and high-frequency (orbital velocities) components of the flow at each sensor. Circulation patterns along the shoreline and in the vicinity of the breakwaters were also qualitatively assessed by observing plumes of colored dye injected into the model.
Model Testing. Three unique test series were conducted, involving the construction and investigation into the performance of a system of breakwaters. In each test series, the system performance was assessed over a range of incident conditions with varying wave heights, wave periods, wave directions, and water levels.
Nine breakwaters were constructed during for Test Series D (see Figure 10). Careful attention was given to the location, dimensions, composition, and methods of construction of the model structures to ensure that they replicated the proposed design accurately and faithfully. Structures 1 and 2 were
Type A breakwaters that were each 450 ft (137.2 m) long, and were located on the western side of the project site in water depths of approximately −6 ft (−1.83 m). Each structure had twelve reef ridges (perpendicular to the trunk) and featured a crenelated crest with seven saddles. Structures 3 through 7 were Type B breakwaters that were each 300 ft (91.4 m) long, and were located along the middle of the project site in water depths of approximately −8 ft (−2.44 m). Structure 3 had no reef ridges, while Structures 4 through 7 featured four reef ridges constructed at a 15° angle relative to the trunk. Structures 8 and 9 were denoted as Type C breakwaters and were located towards the eastern side of the project site. Structure 8 was 350 ft (106.7 m) long, and was built according to the Type B cross-section and without any reef ridges, but due to its location in slightly deeper water (at a depth of around −10 ft (−3.05 m)) it was named as a Type C. Structure 9 was a true Type C breakwater featuring a leeside berm. The structure was 450 ft (137.2 m) long and featured four reef ridges at a 15° angle relative to the trunk.
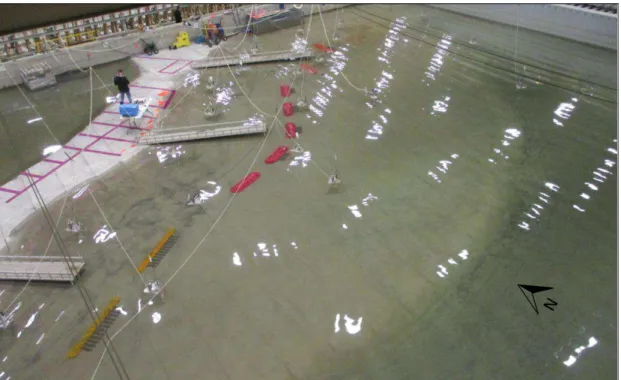
An overview of the Breakwater System Layout model during testing is seen in Figure 11. A comparison of the measured nearshore significant wave heights before and after construction of the breakwater system showed that, as expected, the nearshore wave heights were reduced overall, and in some cases significantly reduced. The degree of reduction is highly dependent on the incident wave direction and also on the water level. Wave attenuation was lower for waves approaching from 90° (approximately 30%), while it was higher for waves approaching from 140° (approximately 50%). At higher water levels, the average reduction was approximately 30%. The average reduction increased to 43% at mean high water level, indicating that (as expected) the breakwaters are more effective at attenuating waves during lower water levels.
During Test Series E, a modified layout of the nine breakwaters was investigated that attempted to shorten some of the gaps between structures and further reduce the nearshore wave agitation. The western low-crested breakwaters (Structures 1 and 2) remained unchanged, while the gap widths between the remaining structures were adjusted by repositioning the high-crested breakwaters. Structures 3 through 9 were entirely removed and carefully rebuilt as previously described.
For waves approaching from 90°, there was a negligible difference in measured nearshore wave heights between Test Series D and E; however the average nearshore wave height actually increased slightly for waves approaching from 120°. This result seems somewhat counter-intuitive, since the overall length of the nine breakwaters was the same in both Test Series D and E, while the gaps between breakwaters were actually reduced in Test Series E. One likely explanation if that more wave energy was allowed to enter the nearshore area from the northeast (beyond Structure 9, since it was shifted westward during Test Series E), and then continued to propagate to the southwest.
Figure 11. Overview of the Breakwater System Layout model during Test Series D.
For Test Series F, a similar modified layout of the nine breakwaters was investigated that attempted to further tighten some of the gaps between structures and reduce the level of nearshore wave agitation. Structures 1 and 2 (Type A) remained unchanged. Structure 3 (Type B) was extended by 25 ft (7.62 m) on its eastern end to a new length of 325 ft (99.1 m). Structures 4 through 6 (Type B) were each extended by 25 ft (7.62 m) on both ends to new lengths of 350 ft (106.7 m). Structure 7 (Type B) was extended by 25 ft (7.62 m) on its western end to a new length of 325 ft (99.1 m). Structure 8 (Type C) was extended by 50 ft (15.24 m) on both ends to a new length of 450 ft (137.2 m). Structure 9 (Type C) was reduced by 100 ft (30.48 m) on its north end to a new length of 350 ft (106.7 m).
As compared to Test Series E, the average nearshore wave heights were reduced by 6% and 17% for waves approaching from 90° and 120°, respectively, during Test Series F. These results are more intuitive, since the overall length of the nine breakwaters was slightly increased.
Model Conclusions. Table 1 provides a summary of the nearshore wave height reductions comparing the results from Test Series D, E, and F with existing conditions (no breakwaters). Values less than 100% indicate that the significant wave heights measured are lower than those measured during existing conditions. All three of the proposed breakwater layouts provided a significant reduction in nearshore wave heights compared to existing conditions (no breakwaters). As a result of optimizations to the breakwater lengths and alignments, the final revised breakwater layout provided the greatest reduction in nearshore wave heights over a range of different wave heights, wave periods, wave directions, and water levels.
Table 1. Comparison of average nearshore wave heights (for each breakwater layout) versus existing conditions.
Sea State ID H1/3 (ft) Dir. (°) WL (ft) TSD vs. Existing TSE vs. Existing TSF vs. Existing A 5.3 90 15.4 75% 78% 82% B 4.2 120 15.4 66% 62% 55% D 5.3 90 12.9 71% 69% 72% E 4.2 120 12.9 52% 63% 41% J 3.0 90 2.08 60% 56% 47% K 3.0 120 2.08 41% 45% 33% CONCLUSIONS
A two-pronged study involving the design, construction, and operation of two separate but closely related physical models was conducted to support the detailed design of the Living Breakwaters project located at the southern tip of Staten Island in Raritan Bay. One study focused on optimizing and verifying the breakwater design elements to ensure they were well adapted to typical and extreme conditions. This study involved both 2D and 3D modeling of breakwater stability in a single facility, offering a high degree of reliability for minimal expense. The second study focused on verifying the overall performance of the breakwater system in terms of wave attenuation and impacts on nearshore wave-induced circulation.
The models were outfitted with wave machines to generate a wide range of realistic sea states, and equipped with instrumentation to measure wave conditions, wave-induced nearshore currents, and breakwater stability.
These investigations generated valuable information concerning breakwater design and performance. This information will be used to optimize and support the final design of the breakwaters and obtain the necessary permits required for construction. The results will also help inform other breakwater designs that look to incorporate reef ridges, crenellations, and ecologically enhanced concrete units to improve ecological performance.
ACKNOWLEDGMENTS
The authors would like to acknowledge the NY Governor’s Office of Storm Recovery for funding this study.
REFERENCES
Governor’s Office of Storm Recovery. 2017. Living Breakwaters Press Packet.
Hughes, S.A. 1993. Physical Models and Laboratory Techniques in Coastal Engineering, World Scientific, Singapore, 568 pp.