Analysis on the impacts of electricity tariffs on the attractiveness of gas fired distributed combined heat and power systems
By Yichen Du
B.S., Physics, Peking University, 2013 B.S., Economics, Peking University, 2013 Submitted to the Engineering Systems Division In partial fulfillment of the requirements for the degree of
Master of Science in Technology and Policy At the
MASSACHUSETTS INSTITUTE OF TECHNOLOGY June 2015
©2015 Massachusetts Institute of Technology. All rights reserved.
Signature of Author__________________________________________________________________________ Engineering Systems Division
May 7, 2015 Certified by___________________________________________________________________________________
Jose Ignacio Perez-‐Arriaga Visiting Professor, Engineering Systems Division Thesis Supervisor Certified by___________________________________________________________________________________
Karen Tapia-‐Ahumada Research Scientist, MIT Energy Initiative Thesis Supervisor Accepted by__________________________________________________________________________________ Dava Newman Professor of Aeronautics and Astronautics and Engineering Systems Director, Technology and Policy Program
Abstract
In order to achieve a more sustainable energy system, regulators and the industry are trying to balance among many challenging issues such as environmental concerns, economic efficiency and security of supply. In Europe, the environmental concerns are getting a higher weight in current discussions. While it is important to continue exploring the potential of renewables as well as other clean energy sources, finding a more effective way to utilize existing resources is also a viable solution. Combined heat and Power (CHP), also known as cogeneration, denotes a group of technologies that generate electricity and useful heat concurrently. Benefits of distributed CHP technologies arise from their direct connection to distribution and customer facilities, which can potentially alleviate transmission and distribution network constraints, lower network energy losses, improve system reliability, and result in CO2 emissions reductions and overall capital cost.
This thesis focuses on understanding the technological, social and economic attractiveness of CHP technologies under different tariff designs, market conditions and incentives. It not only looks at the optimum economic value of CHP to individual customers, but also impacts on the system peak load and the environment. For that purpose, the thesis develops a methodology that focuses on analyzing customers’ reactions to various exogenous parameters by looking at their CHP installation and operation decisions. Moreover, it adopts an overarching framework that integrates and streamlines the processes from simulation of customers’ energy loads, representation of regulatory and market conditions, to the generation and interpretation of the installation and operations decisions.
Results suggest that many distributed CHP technologies could bring positive economic value to the customers even without considering incentives. In the meanwhile, metrics like CO2 emissions, overall efficiency and system peak reduction all improved with the introduction of NGDCHPs. These observations confirm that NGDCHP systems have the potential to reduce costs at both the individual customers’ level and at the system level.
Moreover, we find that customers’ decisions are noticeably influenced by the tariffication and incentive methods. Volumetric-‐only tariffs suffer from potential cross-‐subsidization and insufficient remuneration for network companies, but encourage higher utilization rate and installations because of the higher variable electricity price. In comparison, breaking down the electricity prices based on different cost drivers could send the correct economic signals to the customers while still meeting the sustainability principle for tariff designs. Additionally, we find that changing market conditions can have significant effects on the economic value of CHP systems installed on-‐site, and the annual savings are most sensitive to electricity purchase prices.
In conclusion, the goal of this research is to explore the value of gas fired distributed CHP systems under different settings. It informs the private sector as well as the policymakers by how to realize the potential benefits of distributed CHP systems. In the future, the methodology and framework developed in this thesis could be further applied to analyze scenarios where distributed CHP penetration is high and is coupled with other distributed energy resources.
Acknowledgement
I would like to express my sincere gratitude to many people who generously offered intellectual enlightenment, advice, encouragement and support, not only during the development of my thesis, but throughout my study at the Technology and Policy Program at MIT.
First and foremost, thanks to my advisor, Professor Ignacio Perez-‐Arriaga, for his continuous support of my study and research, for his patience, motivation, enthusiasm, and immense knowledge in the energy industry. His guidance helped me navigate through the research and writing of this thesis. I could not have imagined a better advisor and mentor for my study at MIT.
My sincere thanks also go to Karen Tapia-‐Ahumada, my supervisor at MIT Energy Initiative, for her understanding, patience, suggestions and unconditional support in my research project and the thesis.
I thank my fellow classmates at TPP and group mates at the MIT Energy Initiative: Scott Burger, Nora Xu, Ash Bharatkumar, Jesse Jenkins, Arthur Yip, Danwei Zhang, Jiakun Zhao, Xiaohu Luo, Victoria Clark and Josh Wolf, for the stimulating discussions, for the sleepless nights working together for classes and deadlines, and for all the fun we have had in the past two years.
I am very grateful for MIT and the TPP program, which gave me the opportunity to learn from the best people in this field. Thanks to Barb, Frank and Ed for your help and advise. I would also like to convey my gratitude to the Eni S.p.A, which sponsored my research at MIT Energy Initiative and provided valuable feedback.
Last but not the least, I would like to thank my family and my girl friend: my parents Jun Du and Chunming Huang, for always believing in me and supporting me when I needed; my girlfriend Muxi Li, for her understanding when I get busy with coursework and thesis, and giving me so much happiness during her presence.
Table of Contents
ABSTRACT ... 2
ACKNOWLEDGEMENT ... 4
TABLE OF CONTENTS ... 5
1. INTRODUCTION ... 11
1.1. RESEARCH MOTIVATION ... 12
1.1.1. The European Context ... 12
1.1.2. Natural Gas Fired Distributed CHP (NGDCHP) Technologies ... 13
1.1.3. Challenges for NGDCHP ... 14
1.2. RESEARCH QUESTION ... 15
1.3. METHODOLOGY ... 16
1.4 RESEARCH OUTLINE ... 17
2. LITERATURE REVIEW ... 18
2.1. DISTRIBUTED ENERGY SYSTEMS AND THEIR IMPACT ... 18
2.1.1. The benefits of NGDCHP ... 18
2.1.2. Distributed Energy Resources Changing the Utility Landscape ... 20
2.1.3. Review of NGDCHPs with Capacities up to 10MWe ... 21
2.2. TARIFF DESIGN ... 33
2.2.1. The Process and Principles for Tariffication ... 33
2.2.2. Old Network Tariffs Create Perverse Effects in Face of DER penetration ... 35
2.2.3. A New Proposal of Tariff Framework ... 36
2.2.4. Related Research ... 38
3. REPRESENTATION AND MODELING METHODOLOGIES ... 39
3.1. FRAMEWORK ... 39
3.2. A DESCRIPTION OF DERCAM ... 40
3.3. EQUEST AND THE CONSTRUCTION OF LOAD PROFILES ... 41
3.4 MARKET DATA ... 45
3.4.1 Gas Price ... 45
3.4.2 Electricity Tariff ... 46
3.4.3 CONSTRUCTION AND SUMMARY OF DIFFERENT TARIFF STRUCTURES ... 51
RESULTS AND SENSITIVITY ANALYSIS ... 55
4.1 ANALYSIS METRICS ... 55
4.2 SENSITIVITY ANALYSIS CONSTRUCTION ... 57
4.3 RESULTS FROM THE FOOD PROCESSING FACTORY CASE ... 62
4.3.1. Business as Usual Reference Case ... 62
4.3.2. WHEN NO INCENTIVE IS IMPLEMENTED ... 62
4.3.3 German Cogeneration Law Implementation ... 69
4.3.4. CAPEX Incentive is Implementation ... 73
4.3.5. Sensitivity Analysis ... 77
4.3.6. Summary of the Industrial Case ... 81
4.4. RESULTS FROM THE MULTI-‐FAMILY CASE ... 83
4.4.1. Business as Usual Reference Case ... 83
4.4.2 When no Incentive is Implemented ... 83
4.4.3. German Cogeneration Law Implementation ... 91
4.4.4. When CAPEX Incentive is Implemented ... 96
4.4.6. Summary of the Multi-‐family Building Case ... 105
5. CONCLUSIONS ... 107
5.1. SUMMARY AND CONTRIBUTIONS ... 107
5.2. FINDINGS AND DISCUSSION ... 108
5.3. FUTURE RESEARCH ... 109
5.3.1. Areas of improvement ... 109
5.3.2. Areas for additional research ... 110
BIBLIOGRAPHY ... 112
APPENDICES ... 116
APPENDIX A: MANUFACTURERS DATABASE ... 116
Appendix A.1: Reciprocating Engines ... 116
Appendix A.2: Turbines ... 118
Appendix A.3: Microturbines ... 118
Appendix A.4: Stirling Engines ... 119
APPENDIX A.5: FUEL CELLS ... 119
APPENDIX B: GERMAN ELECTRICITY PRICE BREAKDOWN ACCORDING TO COST DRIVERS ... 120
APPENDIX C: NUMBER OF DAYS FOR THREE DIFFERENT DAY TYPES IN EACH MONTH ... 120
Appendix D: Hourly Marginal CO2 Emission rate on the grid. ... 120
Appendix E: Other assumptions ... 121
List of Figures
FIGURE 1: SHARE OF CHP IN NATIONAL ELECTRICITY PRODUCTION. SOURCE: JOINT RESEARCH CENTER (2012) ... 12
FIGURE 2: AVERAGE OPERATING EFFICIENCY FOR CENTRALIZED POWER PLANTS IN THE US 2003 -‐ 2013. SOURCE: U.S. ENERGY INFORMATION ADMINISTRATION (2014) ... 19
FIGURE 3: OTTO CYCLE USED IN INTERNAL COMBUSTION ENGINES: SOURCE WILLS AND SCOTT (2000) ... 22
FIGURE 4: PART LOAD EFFICIENCY PERFORMANCE IN ICES. SOURCE: EPA (2008) ... 22
FIGURE 5: ELECTRIC EFFICIENCY VS. ELECTRIC OUTPUT FOR COMMERCIALLY AVAILABLE ICES. SOURCE: OWN ELABORATION ... 23
FIGURE 6: AN ILLUSTRATION OF THE GAS TURBINE STRUCTURE. SOURCE: THERMAL POWER PLANT PERFORMANCE ANALYSIS (2012) ... 25
FIGURE 7: AN ILLUSTRATION OF THE MICROTURBINE STRUCTURE. SOURCE: EPA (2008) ... 27
FIGURE 8: FREE PISTON STIRLING ENGINE VITOTWIN 350-‐F AND 300-‐W BY VIESSMANN ... 28
FIGURE 9: FREE PISTON STIRLING ENGINE HYBRIGEN SE. BY KD NAVIEN ... 28
FIGURE 10: AN ILLUSTRATION OF THE STRUCTURE OF A FUEL CELL. SOURCE: ENERGY NEXUS GROUP ... 30
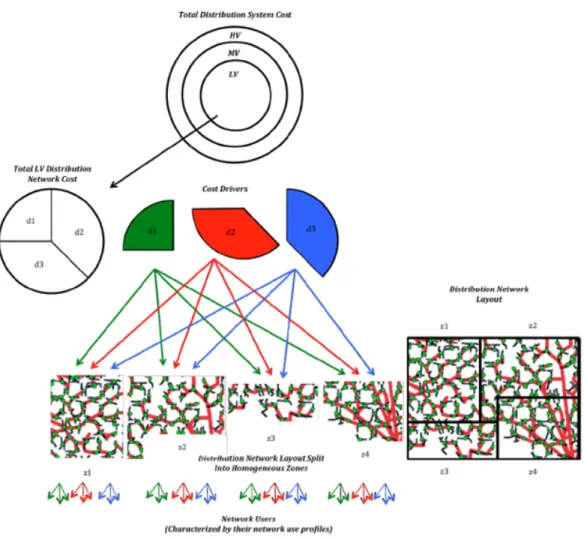
FIGURE 11: COST ALLOCATION UNDER THE PROPOSED DNUOS METHOD. SOURCE: BHARATKUMAR (2015) ... 37
FIGURE 12: THE RESEARCH PROCESS ... 39
FIGURE 13 PEAK ENERGY DEMAND OF THE SAMPLE GERMAN MULTI-‐FAMILY BUILDING FROM JANUARY TO JUNE (KW). SOURCE: SELF-‐GENERATED USING EQUEST ... 44
FIGURE 14 PROCESS ENERGY DEMAND (KW) FOR THE INDUSTRIAL CONSUMER. SOURCE: SELF-‐GENERATION ACCORDING TO VARIOUS DATA ... 45
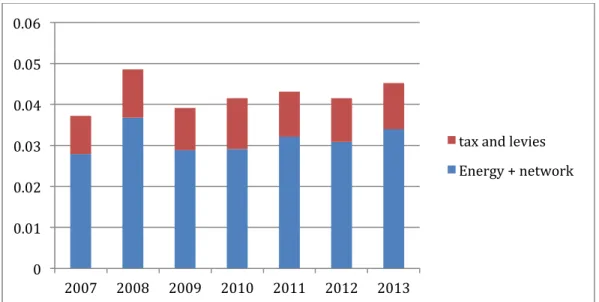
FIGURE 15 REPRESENTATIVE GERMAN NATURAL GAS PRICE CHANGE BY COMPONENTS 2008-‐2012. IN EURO CENTS/ KWH. SOURCE: EC, EPCR METADATA (2013) ... 46
FIGURE 16 ELEMENTS OF CONSUMER PRICES. SOURCE: SWD (2014) ... 47
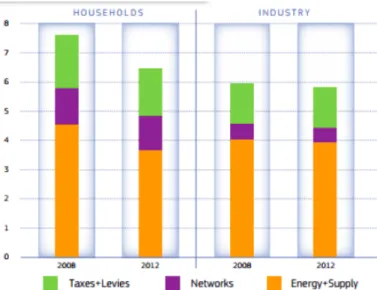
FIGURE 17 ELECTRICITY PRICE CHANGE BY COMPONENTS 2008-‐2013 (IN EURO CENTS/ KWH). SOURCE: EUROSTAT (2014) ... 48
FIGURE 18: GERMAN COGERENATION LAW INCENTIVES FOR DIFFERENT CAPACITY RANGES. SOURCE: BUNDESNETZAGENTUR (2014) ... 50
FIGURE 19: CALCULATION OF AVERAGE INCENTIVES FOR A 2,500 KW CHP PROJECT. SOURCE: SELF-‐ CALCULATION . 50 FIGURE 20: MINI-‐CHP SUPPORT PROGRAM CATEGORIES. SOURCE: BUNDESNETZAGENTUR (2014) ... 50
FIGURE 21: AVERAGE PRICE FOR BASELOAD POWER AT EPEX (EURO/ MWH) ... 51
FIGURE 22: VOLUMETRIC ELECTRICITY PRICE FOR THE RESIDENTIAL CUSTOMER IN A TYPICAL DAY IN JANUARY.TYPICAL DAY IN JANUARY. SOURCE: SELF-‐ CALCULATED. ... 53
FIGURE 23: THE AVERAGE GRID LEVEL EMISSION RATE OF CALIFORNIA IN A TYPICAL DAY OF EACH MONTH IN CALIFORNIA. ... 56
FIGURE 24: RESIDENTIAL NATURAL GAS PRICE IN EUROPE IN 2013. SOURCE: EUROSTAT (2015) ... 57
FIGURE 25: INDUSTRIAL NATURAL GAS PRICE IN EUROPE IN 2013. SOURCE: EUROSTAT (2015). ... 58
FIGURE 26: RESIDENTIAL NATURAL GAS PRICE IN GERMANY FROM 2007 TO 2013. SOURCE: EUROSTAT (2015) ... 58
FIGURE 27: INDUSTRIAL NATURAL GAS PRICE IN GERMANY FROM 2007 TO 2013. SOURCE: EUROSTAT (2015) ... 59
FIGURE 28: RESIDENTIAL ELECTRICITY PRICE IN EUROPE IN 2013. SOURCE: EUROSTAT (2015) ... 59
FIGURE 29: INDUSTRIAL ELECTRICITY PRICE IN EUROPE IN 2013. SOURCE: EUROSTAT (2015) ... 60
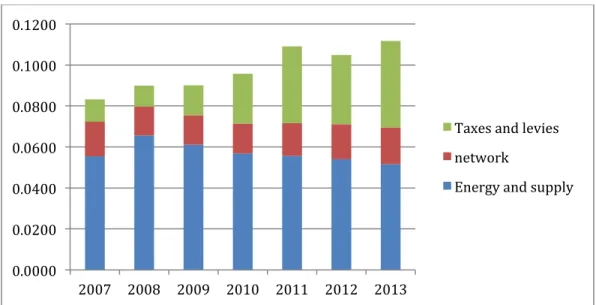
FIGURE 30: RESIDENTIAL ELECTRICITY PRICE IN GERMANY FROM 2007 TO 2013. SOURCE: EUROSTAT (2015) ... 60
FIGURE 31: INDUSTRIAL ELECTRICITY PRICE IN GERMANY FROM 2007 TO 2013. SOURCE: EUROSTAT (2015) ... 61
FIGURE 32: INSTALLED CAPACITY OF 10 TECHNOLOGIES IN 4 TARIFF STRUCTURE SCENARIOS WITH NO INCENTIVES (KW). ... 63
FIGURE 33: OPERATIONAL SCHEDULE IN A TYPICAL DAY FOR TECH 2 SCENARIO 1 ... 64
FIGURE 34: OPERATIONAL SCHEDULE IN A TYPICAL DAY FOR TECH 2 SCENARIO 2 ... 64
FIGURE 35: OPERATIONAL SCHEDULE IN A TYPICAL DAY FOR TECH 2 SCENARIO 3 ... 64
FIGURE 36: OPERATIONAL SCHEDULE IN A TYPICAL DAY FOR TECH 2 SCENARIO 4 ... 65
FIGURE 37: INCREMENTAL GAS CONSUMPTION PER UNIT OF INSTALLED CAPACITY. ... 65
FIGURE 38: PAY-‐BACK PERIOD (YEAR) ... 66
FIGURE 39: ANNUAL SAVINGS AS A PERCENT OF ORIGINAL ANNUAL TOTAL ENERGY COST ... 66
FIGURE 40: MAXIMUM LOAD REDUCTION ... 67
FIGURE 41: REDUCTION IN CONTRIBUTION TO THE SYSTEM PEAK ... 68
FIGURE 42: CHP OVERALL EFFICIENCY ... 68
FIGURE 44: INSTALLED CAPACITY OF 10 TECHNOLOGIES IN 4 TARIFF STRUCTURE SCENARIOS (KW) ... 69
FIGURE 45: INCREMENTAL GAS CONSUMPTION PER UNIT OF INSTALLED CAPACITY. ... 70
FIGURE 46: PART LOAD EFFICIENCY PERFORMANCE IN ICES (LEFT) AND ELECTRICITY EXPORT PERCENTAGE (RIGHT). SOURCE: EPA (2008), SELF-‐CALCULATION ... 71
FIGURE 47: ANNUAL SAVINGS AS A PERCENT OF ORIGINAL ANNUAL TOTAL ENERGY COST ... 71
FIGURE 48: ANNUAL INCENTIVES RECEIVED BY THE CUSTOMER AS A PERCENTAGE OF ANNUAL TOTAL ENERGY COST .. 72
FIGURE 49: PAY-‐BACK PERIOD (YEAR) ... 72
FIGURE 50: INSTALLED CAPACITY OF 10 TECHNOLOGIES IN 4 TARIFF STRUCTURE SCENARIOS (KW) ... 73
FIGURE 51: INCREMENTAL GAS CONSUMPTION PER UNIT OF INSTALLED CAPACITY. ... 73
FIGURE 52: OPERATIONAL SCHEDULE IN A TYPICAL DAY FOR TECH 2 SCENARIO 4 WHEN THERE IS EXPORT INCENTIVE IN PLACE ... 74
FIGURE 53: OPERATIONAL SCHEDULE IN A TYPICAL DAY FOR TECH 2 SCENARIO 4 WHEN THERE IS NO EXPORT INCENTIVE IN PLACE ... 74
FIGURE 54: ANNUAL SAVINGS AS A PERCENT OF ORIGINAL ANNUAL TOTAL ENERGY COST ... 75
FIGURE 55: ANNUALIZED CAPEX INCENTIVES RECEIVED BY THE CUSTOMER AS A PERCENTAGE OF ANNUAL TOTAL ENERGY COST ... 75
FIGURE 56: MAXIMUM LOAD REDUCTION ... 76
FIGURE 57: REDUCTION IN CONTRIBUTION TO THE SYSTEM PEAK ... 76
FIGURE 58: CHP OVERALL EFFICIENCY ... 77
FIGURE 59: CO2 EMISSION REDUCTION RATE ... 77
FIGURE 60: OPERATIONAL SCHEDULE IN A TYPICAL DAY FOR TECH 2 SCENARIO 4 -‐BASE CASE ... 78
FIGURE 61: OPERATIONAL SCHEDULE IN A TYPICAL DAY FOR TECH 2 SCENARIO 4 -‐DECREASED ELECTRICITY PRICE .. 78
FIGURE 62: OPERATIONAL SCHEDULE IN A TYPICAL DAY FOR TECH 2 SCENARIO 4 -‐INCREASED ELECTRICITY PRICE .... 79
FIGURE 63: OPERATIONAL SCHEDULE IN A TYPICAL DAY FOR TECH 2 SCENARIO 4 -‐DECREASE NG PRICE ... 79
FIGURE 64: OPERATIONAL SCHEDULE IN A TYPICAL DAY FOR TECH 2 SCENARIO 4 -‐INCREASE NG PRICE ... 79
FIGURE 65: OPERATIONAL SCHEDULE IN A TYPICAL DAY FOR TECH 2 SCENARIO 4 -‐DOUBLE PX PRICE ... 80
FIGURE 66: ANNUAL SAVINGS THROUGH OPERATIONS FOR TECH 2 SCENARIO 4 IN DIFFERENT MARKET CONDITIONS . 80 FIGURE 67: CHP OVERALL EFFICIENCIES FOR TECH 2 SCENARIO 4 IN DIFFERENT MARKET CONDITIONS ... 81
FIGURE 68: INCREMENTAL NG PURCHASES FOR TECH 2 SCENARIO 4 IN DIFFERENT MARKET CONDITIONS ... 81
FIGURE 69: INSTALLED CAPACITY OF 10 TECHNOLOGIES IN 4 TARIFF STRUCTURE SCENARIOS ... 84
FIGURE 70: OPERATIONAL SCHEDULE IN A TYPICAL DAY FOR TECH 1 SCENARIO 1 ... 85
FIGURE 71: OPERATIONAL SCHEDULE IN A TYPICAL DAY FOR TECH 1 SCENARIO 2 ... 86
FIGURE 72: OPERATIONAL SCHEDULE IN A TYPICAL DAY FOR TECH 1 SCENARIO 3 AND 4 ... 87
FIGURE 73: INCREMENTAL GAS CONSUMPTION PER UNIT OF INSTALLED CAPACITY. ... 87
FIGURE 74: PAY-‐BACK PERIOD (YEAR) ... 88
FIGURE 75: ANNUAL SAVINGS AS A PERCENT OF ORIGINAL ANNUAL TOTAL ENERGY COST ... 88
FIGURE 76: MAXIMUM LOAD REDUCTION ... 89
FIGURE 77: CONTRACTED CAPACITY REDUCTION ... 89
FIGURE 78: REDUCTION IN CONTRIBUTION TO THE SYSTEM PEAK ... 90
FIGURE 79: CHP OVERALL EFFICIENCY ... 90
FIGURE 80: CO2 EMISSION REDUCTION RATE ... 91
FIGURE 81: INSTALLED CAPACITY OF 10 TECHNOLOGIES IN 4 TARIFF STRUCTURE SCENARIOS ... 91
FIGURE 82: OPERATIONAL SCHEDULE IN A TYPICAL DAY FOR TECH 1 SCENARIO 4 -‐WITH INCENTIVE ... 92
FIGURE 83: OPERATIONAL SCHEDULE IN A TYPICAL DAY FOR TECH 1 SCENARIO 4 –BASE CASE ... 93
FIGURE 84: INCREMENTAL GAS CONSUMPTION PER UNIT OF INSTALLED CAPACITY. ... 93
FIGURE 85: ANNUAL INCENTIVES RECEIVED BY THE CUSTOMER AS A PERCENTAGE OF ANNUAL TOTAL ENERGY COST .. 94
FIGURE 86: PAY-‐BACK PERIOD (YEAR) ... 94
FIGURE 87: REDUCTION IN CONTRIBUTION TO THE SYSTEM PEAK ... 95
FIGURE 88: CHP OVERALL EFFICIENCY ... 95
FIGURE 89: CO2 EMISSION REDUCTION RATE ... 96
FIGURE 90: INSTALLED CAPACITY OF 10 TECHNOLOGIES IN 4 TARIFF STRUCTURE SCENARIOS ... 96
FIGURE 91: INCREMENTAL GAS CONSUMPTION PER UNIT OF INSTALLED CAPACITY ... 97
FIGURE 92: ANNUALIZED CAPEX INCENTIVES RECEIVED BY THE CUSTOMER AS A PERCENTAGE OF ANNUAL TOTAL ENERGY COST ... 97
FIGURE 94: CHP OVERALL EFFICIENCY ... 98
FIGURE 95: CO2 EMISSION REDUCTION RATE ... 99
FIGURE 96: OPERATIONAL SCHEDULE IN A TYPICAL DAY FOR TECH 2 SCENARIO 4 -‐BASE CASE ... 100
FIGURE 97: OPERATIONAL SCHEDULE IN A TYPICAL DAY FOR TECH 2 SCENARIO 4 -‐ELECTRICITY PRICE DECREASE .. 100
FIGURE 98: OPERATIONAL SCHEDULE IN A TYPICAL DAY FOR TECH 2 SCENARIO 4 -‐ELECTRICITY PRICE INCREASE ... 101
FIGURE 99: OPERATIONAL SCHEDULE IN A TYPICAL DAY FOR TECH 2 SCENARIO 4 -‐GAS PRICE DECREASE ... 102
FIGURE 100: OPERATIONAL SCHEDULE IN A TYPICAL DAY FOR TECH 2 SCENARIO 4 -‐GAS PRICE INCREASE ... 102
FIGURE 101: OPERATIONAL SCHEDULE IN A TYPICAL DAY FOR TECH 2 SCENARIO 4 -‐DOUBLE EXPORT PRICE ... 103
FIGURE 102: ANNUAL SAVINGS THROUGH OPERATIONS FOR TECH 2 SCENARIO 4 IN DIFFERENT MARKET CONDITIONS
... 104
FIGURE 103: CHP OVERALL EFFICIENCIES FOR TECH 2 SCENARIO 4 IN DIFFERENT MARKET CONDITIONS ... 104
FIGURE 104: INCREMENTAL NG PURCHASES FOR TECH 2 SCENARIO 4 IN DIFFERENT MARKET CONDITIONS ... 105
List of Tables
TABLE 1: NEW INSTALLATION OF NGDCHP AND ALL CHP TECHNOLOGIES IN THE US FROM 1900 TO 2013; SOURCE:
ICF (2013) AND OWN CALCULATION ... 13
TABLE 2: COMMERCIALLY AVAILABLE NG-‐FUELLED RECIPROCATING ENGINES. SOURCE: OWN ELABORATION ... 24
TABLE 3: COMMERCIALLY AVAILABLE NG-‐FIRED TURBINE SYSTEMS. SOURCE: OWN ELABORATION ... 26
TABLE 4: COMMERCIALLY AVAILABLE NG-‐FIRED MICROTURBINE SYSTEMS. SOURCE: OWN ELABORATION ... 27
TABLE 5: COMMERCIALLY AVAILABLE NG-‐FUELLED STIRLING ENGINES. SOURCE: OWN ELABORATION ... 29
TABLE 6: CHARACTERISTICS OF STATIONARY FUEL CELL TYPES. SOURCE: DOE FUEL CELLS TECHNOLOGY PROGRAM ... 31
TABLE 7: FUEL CELL PERFORMANCE AND COSTS CHARACTERISTICS ... 32
TABLE 8: SUMMARY COST AND PERFORMANCE CHARACTERISTICS FOR TECHNOLOGIES IN THE INDUSTRIAL CASE ... 33
TABLE 9: SUMMARY COST AND PERFORMANCE CHARACTERISTICS FOR TECHNOLOGIES IN THE MULTI-‐FAMILY BUILDING CASE ... 33
TABLE 10 KEY FEATURES OF THE TWO CASES UNDER CONSIDERATION. SOURCE: SELF-‐GENERATED USING EQUEST ... 43
TABLE 11 VOLUME WEIGHTED AVERAGE ELECTRICITY PRICE IN GERMANY IN 2013. SOURCE: BUNDESNETZAGENTUR (2014), EUROSTAT (2015) ... 49
TABLE 12: SUMMARY OF THE RATES FOR 4 TARIFF STRUCTURES FOR THE RESIDENTIAL CASE. ... 52
TABLE 13: SUMMARY OF THE RATES FOR 4 TARIFF STRUCTURES FOR THE INDUSTRIAL CASE ... 52
TABLE 14: SUMMARY OF THE BUSINESS AS USUAL INDUSTRIAL CASE ... 62
TABLE 15: SUMMARY OF THE BUSINESS AS USUAL MULTI-‐FAMILY CASE ... 83
1. Introduction
In order to achieve a more sustainable energy system, regulators and the industry are trying to balance among many challenging issues such as environmental concerns, economic efficiency and security of supply, with an increasing weight on the first factor in recent years (EU 2012). While it is important to continue exploring the potential of renewables, which provide alternative sources of energy, as well as other clean energy sources, finding a more effective way to utilize existing resources is also considered, by both the industry and the regulators, as a viable solution.
Indeed, around 65% of all energy used to generate electricity is lost during the energy conversion, transmission and distribution processes (US Energy Information Administration 2009) (European Environment Agency 2015). The room for efficiency improvement is ample for combined heat and power (CHP) technologies on the distributed level.
Benefits of distributed generators arise from their direct connection to distribution and customer facilities, which can potentially alleviate transmission and distribution network constraints, lower network energy losses, improve system reliability, and result in CO2 emissions reductions and overall capital cost (Strachan 2002) (Gil 2006).
However, distributed combined heat and power systems (DCHP) still faces techno-‐ economic challenges, ranging from high initial investment to relatively low electric efficiencies, flexibilities and reliability. Their penetration is influenced by regulatory and market conditions such as fuel price, overall energy mix in the wholesale market, electricity tariff structure, subsidies and incentives.
This thesis tries to understand the value of CHP, not only to the energy consumers, but also to the system and society, based on different scenarios that are both representative and realistic. From the individual customer’s perspective, the essence of this research is to have a relatively realistic representation of the techno-‐ economic scenarios that typical customers face, and draw general insights on how the attractiveness and value of CHP technologies are influenced by external factors. On the other hand, from the viewpoint of regulator, this thesis tries to address the question “What are the merits and drawbacks of various tariffication method based on economic, environmental and efficiency metrics?”
This thesis develops a framework and methodology that can take in energy, technology and market information and find the optimal installation and operation decisions for different CHP technologies. This methodology focuses on analyzing customers’ reactions to various exogenous parameters and utilizes multiple metrics to show the consequent impacts on the energy bill, the grid and the environment.
1.1. Research Motivation
1.1.1. The European Context
Europe is making great efforts to limit greenhouse gas emissions, promote renewable energy resources and improve energy efficiency, as is evidenced by the sustained commitment to the so-‐called “20-‐20-‐20” target, a legally binding climate and energy package established by the European Commission (European Commission 2014). These efforts have given rise to the rapid growth of not only various renewable energy systems, but also distributed energy resources and CHP
technologies1. For instance as early as 2005, 15 European states had already
achieved a distributed generation penetration rate of more than 10% (Frias 2008). The Joint Research of European Commission’s research has shown (see Figure 1) that CHP penetration had reached significant value in certain Northern European
nations by 20122. Moreover, the CODE 2 project, funded by the European Union, has
estimated that CHP could generate 20% of the EU’s electricity by 2030, if proper policies and subsidies are implemented (CODE 2 2015).
Figure 1: Share of CHP in National Electricity Production. Source: Joint Research Center (2012)
This transformative energy landscape will have significant influence on all stakeholders, ranging from governments and regulatory agencies, to equipment manufacturers, utilities, gas companies and customers, especially in the context of the liberalization of the electricity and gas sectors in the EU. It has prompted the interest not only from academia, but also industry. For instance, European conglomerates like ABB and Siemens have articulated their views on a future power system and utility sector with increased integration of decentralized resources (ABB 2010) (Utility Dive n.d.).
1 These three concepts are not mutually exclusive. For example, a small concentrated
solar power (CSP) system that can provide both electricity and heat could be categorized as any one of the three concepts.
2 For comparison, in 2008, cogeneration accounted for 9 percent of the total U.S.
1.1.2. Natural Gas Fired Distributed CHP (NGDCHP) Technologies
Admittedly, the rapid growth of distributed energy resources (DER) and CHP technologies in Europe should be attributed to various tailwinds, ranging from falling costs due to technical advancement and liberalization of the retail market, to the increasing emphasis on policy goals such as reliability and decarbonization (J.A.P. Lopes 2007). However, it is noticeable that the success in the renewable sector and the larger CHP technologies is not observed in the distributed CHP system. The potential opportunities and barriers to distributed CHP systems are less understood.
A distributed level system refers to technologies with electric capacities below 10 MW, a rough threshold for generators connected to distribution networks. Technologies in this range can be further classified as Micro (<50 kW), mini (<500kW), and small (<1MW) respectively.
Combined heat and Power (CHP), also known as cogeneration, denotes a group of technologies that generate electricity and useful heat concurrently. While a detailed discussion of technologies in each category can be found in the next chapter, it is worth noting that in general, the cogeneration feature gives these technologies much higher overall efficiency than the separate generation of electricity and useful heat. In fact, it has a long history within large industrial applications. Several energy intense industries such as chemicals, metal, oil refining and pulp and paper manufacturing account for more than 80 percent of the total global electric CHP
capacity (Center for Climate and Energy Solutions 2010)3. These low hanging fruits
have been long recognized by the industry and thus are mature and saturated. However, there is a clear trend for CHPs to move to smaller applications. For instance, as is shown in Table 1, the newly installed capacity of NGDCHP as a percentage of the total CHP installation has increased steadily from 1900 to 2012 in the US, especially after 2008.
Period NGDCHP (kW) Total CHP (kW) NGDG Penetration
1900-‐2000 1,806,066 66,901,837 2.70%
2001-‐2007 634,593 13,559,976 4.68%
2008-‐2011 418,703 1,975,691 21.19%
2012-‐ 2013 Q1 105,610 468,840 22.53%
Table 1: New Installation of NGDCHP and all CHP Technologies in the US from 1900 to 2013; Source: ICF (2013) and own calculation
3 However, these CHP systems are generally very large and are beyond the scope of
Finally, this thesis focuses on natural gas fired CHP systems specifically because the potentially higher scalability compared with some other fuel sources such as
biofuels, hydrogen and diesels4.
1.1.3. Challenges for NGDCHP
Gas fired distributed CHP projects can yield numerous private and public benefits. As mentioned above, they tend to have higher overall efficiencies and can reduce the environmental impact of power generation. Moreover, on-‐site generation can reduce peak electrical demand on the grid and thus alleviate electric grid constraints and losses, if the customers receive proper economic signals. Prior research also identified other advantages such as better resilience in the face of grid outages, deferred in vestment in the network, potential improvement on the stability from reactive power and voltage support and reduced fuel price volatilities, which will be discussed in more detail in the next chapter.
However, several barriers and technical limitations have hindered the full realization of these benefits. In order to successfully promote and integrate distributed energy resources, efforts must be made not only on improving the current network infrastructure and information and communication technologies, but also updating regulatory and policy frameworks, technical standards, and industry structures. The tariff scheme is the key issue among all these factors, as it connects the upstream regulatory objectives and the downstream industries and customers, with a significant influence on infrastructure investment and operational decisions. Current tariffication methods may not be suitable for the rapidly evolving environment. Electric utilities may apply different rates and special charges to distributed energy projects than that to non-‐producing customers. While the legitimacy of these practices lies in the need to recover reduced income and additional costs associated with special services required for the DGs, if not well designed, they can pose significant and unnecessary obstacles to tap the full potential of these opportunities. An appropriate tariff design should allow the utilities to recover costs and reasonable profits while sending correct economic signals to the end-‐users and on-‐site generators.
In addition to the general issues that DGs face, another four barriers should be addressed to mobilize CHP potential in Europe: insufficient recognition and reward to CHP’s efficiency gains at the energy system level; hurdles for distributed generators in connecting to and operating on the network; uncertainties and risks associated with regulations, and a lack of understanding and planning of usable heat (CODE 2 2015).
4 Besides the advantage of wide availability, factors such as ease of maintenance and
low impurity and pollution are also clear advantages. Moreover, as shale gas and Caspian gas are being developed, sufficient supply may also drive down the fuel cost.
1.2. Research Question
This thesis focuses on understanding the technological, social and economic attractiveness of CHP technologies under different tariff designs, market conditions and incentives. It not only looks at the optimum economic value of CHP to individual customers, but also impacts on the system’s peak load and the environment. The premise is that, even if individual customers are only reacting to economic signals and regulatory constraints, without explicit considerations on the overall social and grid level costs, a good tariff design should be able to send the correct economic signals to all participants so that the welfare of both individual customers and the overall society is improved.
Therefore, the main questions that this thesis attempts to answer are:
• How does relative economic attractiveness of different CHP technologies look like from the perspective of individual customers?
• How do different tariff structures influence the decision making process of individual customers who are considering having distributed CHP technologies on-‐site? More specifically, how do the customers respond to the economic signals by changing their installation capacity and the operation schedules?
• What are the effects in terms of energy efficiency, contribution to peak load, CO2 emissions and natural gas consumption, all of them with implications in the system’s costs and social welfare?
• How sensitive are these observations in relation to key market conditions, technology and regulatory requirements?
On the one hand, from the individual customer’s perspective, the essence of this research is to have a relatively realistic representation of the techno-‐economic scenarios that typical customers face, and draw general insights on how the attractiveness and value of CHP technologies are influenced by external factors. On the other hand, from the regulator’s viewpoint, this thesis tries to address the question “What are the merits and drawbacks of various tariff methods based on economic, environmental and efficiency metrics?”
Complex and interesting dynamics are expected between the overall system’s cost and the individual customers’ decision-‐making, especially when the penetration rate of distributed CHP technologies increases over time. For instance, when lots of distributed CHP technologies are generating electricity at the same time in the peak hours, it is likely that both the short-‐term marginal electricity price and the long-‐ term network investment on the grid level would be different from that in the business as usual case. However, it is beyond the scope of this research to model such interplay. Rather, this thesis focuses on the early adoption phase, when the penetration of distributed CHP is low and their influence on the system is not
significant. This assumption is also in line with the current situation within the European energy sector, as discussed above.
Moreover, this thesis looks at the “economically optimal” decisions that a customer would make when faced with various economic signals. Generally, it is expected that, rational customers will react to economic signals through both demand response, i.e. changing their consumption patterns, and on-‐site generation. As the focus of this research is on CHP technologies, it is assumed that customers do not change their consumption behavior in response to prices, but rather shift their energy source between electricity and gas. In addition, in order to get an “optimal” outcome, CHP technologies should have the flexibility to react in a timely manner to the economic signals. In theory, this would provide CHPs with the potential to create additional value by participating in ancillary markets. However, this mechanism is not widely applied to generators on the distributed level and, thus, has not been included in this analysis. Therefore, the thesis calibrates the maximum value of distributed CHP technologies when holding energy consumption loads fixed and without explicitly including the potential value of providing ancillary services.
1.3. Methodology
In order to understand the impact of different regulatory tariffs on the attractiveness of different CHP technologies, and their complex interactions with other techno-‐economic parameters, the thesis develops a methodology that focuses on analyzing customers’ behavior to various exogenous parameters by looking at their CHP installation and operation decisions. Moreover, it adopts an overarching framework that integrates and streamlines the various processes from the simulation of customers’ energy loads, the representation of regulatory and market conditions, to the generation and interpretation of the installation and operations decisions.
To analyze a specific application case, we first accrue, triangulate and compile three categories of data relevant to the case: energy load, technology specifics and market conditions. First, a thorough review of currently available CHP technologies is conducted, and we parameterize the technologies using some key techno-‐economic metrics such as capital cost, electric efficiency and heat-‐to-‐power ratio. Secondly, we use raw data on weather, building design and end-‐user demand patterns to construct and simulate the energy load profile for a particular customer over a year. For computational efficiency, we then synthesize the data to get load profiles for representative days in a year. Thirdly, we analyze the regulations and price information of the selected market, and construct different tariff structures, incentives and price level scenarios.
Then an optimization model is adopted to determine the economically optimal installation and operational decisions for different CHP technologies, for the
customer utilizing the aforementioned three categories of data. The output from the model in each scenario is then compared with the business as usual (BAU) scenario. The BAU scenario is that when the customer imports electricity solely from the grid and generates heat using a conventional boiler or furnace. Besides comparing the total installation and hourly operation, several metrics are used to show the impacts of CHPs on the environment, peak demand, and the customer’s energy bill. Finally, we conduct a sensitivity analysis to see how changes in market conditions influence our findings.
1.4 Research Outline
The thesis is structured as follows: Chapter 2 starts with a literature review on the recent advances and impacts of distributed energy systems; categories, characteristics and parameters of distributed cogeneration technologies; and a discussion on the topic of the tariff designs and recent developments in this area. Chapter 3 is devoted to explain the methodology, tools and models that are adopted and developed for the analysis; the required data; the assumptions and processes involved in constructing different scenarios; and it defines the metrics to interpret and evaluate the output from the model. Chapter 4 shows and compares the results of different scenarios; and performs sensitivity analyses to critical variables including fuel prices, electricity purchase prices, and electricity export prices. Chapter 5 summarizes the findings, discusses the implications for different stakeholders; and finally identifies the areas of improvement and additional research.
2. Literature Review
2.1. Distributed Energy Systems and their impact
2.1.1. The benefits of NGDCHP
Natural gas fired distributed cogeneration systems have started to attract interest from both the industry and the academia in recent years (MIT Energy Initiative 2014), which should be seen in the context of the overall popularity of distributed energy systems. Like many other DERs, NGDCHP has the potential to improve the energy system on multiple fronts:
• The most obvious advantage of gas fired combined heat and power is higher efficiencies. The typical method of centralized electricity generation and on-‐ site heat generation results in lower usage of the total energy input. As shown in Figure 2, the efficiencies of typical coal and petroleum power plants average around 40% and have not shown an overall improvement in the past
decade5. The efficiency of natural gas fired central plants benefited from the
introduction and improvement of combined cycle gas turbine technology (CCGT), but still falls short of the overall efficiency of 80% that many cogeneration systems can achieve. Admittedly, electricity in general has higher value than heat, and centralized power plants make economic sense in many cases. From the perspective of primary energy saving, however, cogeneration makes better use of the waste heat from the electricity generation process, and thus yields a more attractive outcome. Alternatively, cogeneration reduces the energy consumption in standalone boilers and furnaces devoted to satisfy heat demand as well as the purchase of electricity from the grid, which may result in better economics for individual customers.
• Cogeneration reduces the environmental impact of power and heat generation as it requires less fuel input to achieve the same level of output and, therefore, can lower CO2 emissions. This effect is compounded with the fact that natural gas contains much lower carbon content on a per energy unit basis compared with coal and oil, which makes NGDCHP systems a valuable alternative on the decarbonization roadmap. Besides CO2, other air pollutants such as SO2, NOx and Hg can also be reduced if proper treatment technologies are in place.
• On-‐site DG systems are usually connected to the power grid, and the customers can choose to purchase from or sell electricity back to the grid. This feature gives the technology the potential to reduce peak electrical demand on the grid as well as alleviate constraints and network losses. The
5 Not taking into account transformation losses and heat resistance losses on the
total transmission and distribution losses as of the output from the central power plant ranged between 3% and 12% in European nations in 2011 (The World Bank 2013). About half of these losses arise from the transformation steps (Leonardo Energy 2008). Having DGs on the customer’s site can minimize the transformation steps for on-‐site generation and lower the need to purchase electricity that has to be transformed from the grid. Moreover, the network losses will be highest during peak demand according to Joule’s Law, when the current in the wires reaches maximum capacity. If correct economic signals are sent to the customers, they may choose to use more on-‐ site generation, thus reducing losses on the grid and lessening capacity constraints.
• In addition to the short-‐term benefit of reducing losses, reduced peak demand could also help defer or displace more expensive transmission and distribution infrastructures in the longer term. The life of existing network assets could be lengthened through lowering the adverse impact of grid congestions, not to mention that certain network reinforcement will be no longer necessary if additional demand could be met by on-‐site generations.
• In the face of grid outages, DGs can enhance the resiliency of supply through providing power to critical services, avoiding economic losses on the customers’ site and contributing to the fast restart of the system. Other benefits mentioned in prior research also include reduced fuel price volatility and bringing economic development to local communities (EPA 2015).
Figure 2: Average Operating Efficiency for Centralized Power Plants in the US 2003 -‐ 20136. Source: U.S. Energy Information Administration (2014)
6 The EIA does not distinguish between ordinary gas turbines and combined cycle
gas turbines. Therefore, the natural gas efficiency shown here is an average value.
30% 35% 40% 45% 50% 55% 2003 2004 2005 2006 2007 2008 2009 2010 2011 2012 2013