OF TECHNOLOGY
NUCLEAR ENGINEERING
READING
ROOM MI.
ANALYSIS OF FORCED CONVECTION
DEGRADED CORE COOLING IN LIGHT WATER REACTORS by
S. M. Mohammed and M. S. Kazimi
DEPARTMENT OF NUCLEAR ENGINEERING MASSACHUSETTS INSTITUTE OF TECHNOLOGY
Cambridge, Massachusetts 02139
J
--Xli'
1.
ANALYSIS OF FORCED CONVECTION
DEGRADED CORE COOLING IN LIGHT WATER REACTORS by
S. M. Mohammed and M. S. Kazimi
August 1981
Work Performed with Support from E.G. & G. Idaho, Inc.
RF
ABSTRACT
The literature on heat transfer and hydrodynamics of forced convection
cooling of particle beds is reviewed. The information is used to assess
the characteristics of in-situ cooling of a degraded LWR reactor core
under conditions representative of severe accidents.
It is found that while adequate information exists on the behavior
of particulate beds of uniform size particles, considerable uncertainty
remains about the behavior of beds of nonuniform particle sizes. Important
areas that need further investigation for LWR safety analysis include
the pressure drop as a function of flow rate in beds of mixed size
particles, self-pumping capability, boiling heat transfer and dryout as
a function of flow rate and bed characteristics.
In analyzing the forced convection cooling in a degraded LWR core,
it is found that the pressure head required to force the flow through
a totally degraded core is one to two orders of magnitude higher than
the case of intact core geometry. If, for example, the temperature rise
across the core is to be 20 *C, the minimum water coolant superficial
velocity required to remove the decay heat (conservatively taken as 2%
of the initial total power) is 0.075 m/sec. At such a velocity the pressure
drop in the initial intact core is only 70 Pa. In a totally degraded core,
consisting of particles with a mean diameter equal 1 mm, the pressure drop
is about 110,000 Pa. Even with these conservative assumptions, the
pressure head is within the capability of the main reactor pumps.
80 pm will be swept out by the flow. The sensitivity of the hydraulic characteristics to the allowed coolant temperature rise is also
ACKNOWLEDGEMENTS
Support for this Project provided by EG&G Idaho, Inc. is greatly appreciated.
We are also grateful to Ms. Gail Jacobson for her patience and help in the preparation of this typed manuscript.
This report is based on a thesis submitted by the first author as
part of the requirements of an M.S. degree in Nuclear Engineering at
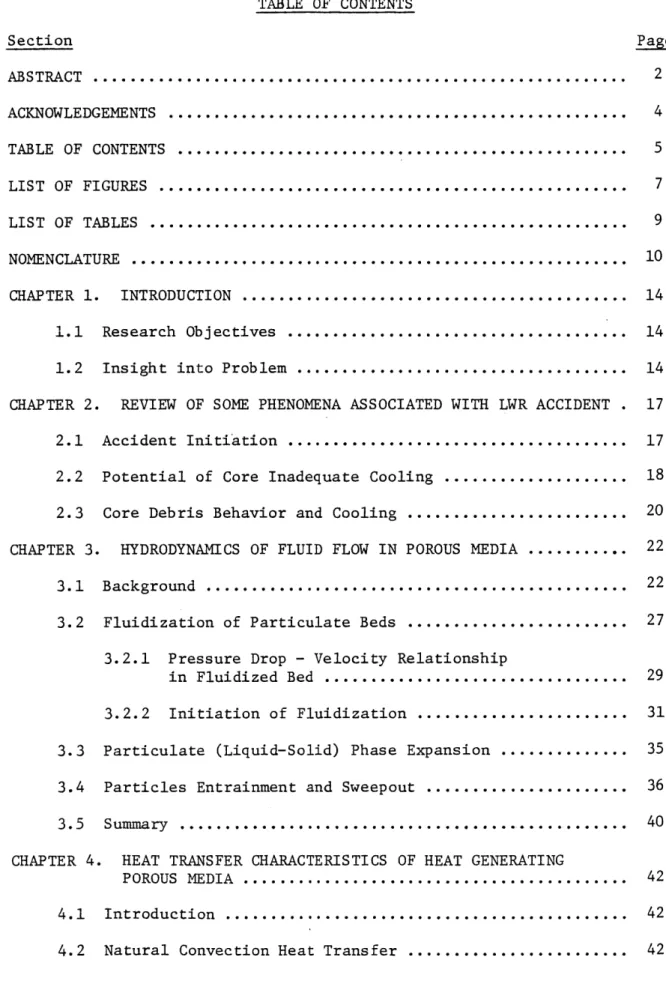
TABLE OF CONTENTS Section ABSTRACT ... ACKNOWLEDGEMENTS ... TABLE OF CONTENTS ... LIST OF FIGURES ... LIST OF TABLES ... NOMENCLATURE ... CHAPTER 1. INTRODUCTION ... 1.1 Research Objectives ...
1.2 Insight into Problem ...
CHAPTER 2. REVIEW OF SOME PHENOMENA ASSOCIATED
2.1 Accident Initiation ...
2.2 Potential of Core Inadequate Cooling
2.3
CHAPTER 3.
3.1
Core Debris Behavior and Cooling
HYDRODYNAMICS OF FLUID FLOW IN
Background ...
PORO
WITH LWR
IS MEDIA
3.2 Fluidization of Particulate Beds
3.2.1 Pressure Drop - Velocity Relationship
in Fluidized Bed ...
3.2.2 Initiation of Fluidization ... 3.3 Particulate (Liquid-Solid) Phase Expansion ... 3.4 Particles Entrainment and Sweepout ...
3.5 Summary ...
CHAPTER 4. HEAT TRANSFER CHARACTERISTICS OF HEAT GENERATING POROUS MEDIA ...
4.1 Introduction ...
4.2 Natural Convection Heat Transfer ...
Page 2 ACCIDENT 42 42 42
Section 4.2.1 4.2.2 4.3 CHAPTER 5 5.1 5.2 5.3 5.4 CHAPTER 6.1 6.2 CHAPTER 7. APPENDIX A. APPENDIX B. Previous Work ...
Correlations Applied to Natural Cooling ...
Convection
4.2.3 Effective Thermal Conductivity of
Particulate Bed ...
4.2.4 Boiling in Debris Bed ...
4.2.5 Dryout Heat Flux Correlations ...
Forced Convection Heat Transfer in Particulate Beds ..
4.3.1 Background ...
4.3.2 Heat Transfer Mechanisms ...
4.3.3 Experimental Findings and Available
Correlations ...
HYDRODYNAMICS AND FLUID FLOW CHARACTERISTICS OF A DEGRADED REACTOR CORE ...
Physical Model ...
Analysis of Flow Through Core Rubblized
Parametric Effect of Fluidization ...
5.3.1 Results and Discussion ... Pressure Drop in Degraded Core ...
ASSESSMENT OF DEGRADED CORE COOLING
Analysis of One Dimensional Heat
Removal in Particulate Beds ...
Results and Discussion ...
Bed
CONCLUSIONS AND RECOMMENDATIONS ... CORE CONFIGURATION AND DEBRIS BED HEIGHT
EFFECTS OF UNCERTAINTY IN POROSITY ON PRESSURE DROP ... .. 00... . . .. . . . .. . ... ... .. .... 0 REFERENCES . 45 48 50 50 58 58 60 63 83 83 89 90 91 99 110 110 113 124 127 131 135 Page 42 6.
LIST OF FIGURES Figure No. 1 2 3 4 5 6 7 8 9 10 11 12 13 14 15 16
Results of Simulated Experiments to Predict Particle Size Distribution Expected in LWR Severe Accident ...
Typical Behavior of Pressure Gradient and Porosity of a Bed as a Function of the Fluid Superficial Velocity
Heat Transfer for a Heat-Generating Porous Bed
Cooled from above ... Natural Convection in a Porous Media with Internal
Heat Generation ... Natural Convection and Mild Boiling in a Porous
Media with Internal Heat Generation ...
Natural Convection and Vapor Column in a Porous
Media with Internal Heat Generation ...
Beginning of Dryout and Melting of Debris due to
Internal Heat Generation ...
Comparison of Theoretical Dryout Heat Flux
Correlations ...
Modes of Heat Transfer in Packed Beds ...
Reported Results for Heat Transfer in Fixed Beds ...
Reported Results for Heat Transfer in Fluidized Beds ...
TNT Reactor Core Schematic ...
Minimum Fluidization Velocity as a Function of
Particle Diameter and for Various Reactor Materials ....
Fluidization and Sweepout Particle Diameter as a Function of Single Phase Coolant Superficial
Velocity, AT = 10 *C ...
Fluidization and Sweepout Particle Diameter as a
Function of Single Phase Coolant Superficial
Velocity, AT = 20 *C ... Fluidization and Sweepout Particle Diameter as a
Function of Single Phase Coolant Superficial
Velocity, AT = 50 *C ...
Page
Figure No. Page
17 Pressure Drop per Unit of Initial Debris Bed
Height as a Function of Coolant Superficial Velocity .. 100 18 Pressure Drop per Unit of Initial Bed Height as
a Function of Coolant Superficial Velocity and
Porosity ... 101
19 Pressure Drop as a Function of Coolant Superficial Velocity for Core with Intact Fuel Rods, Partially
Degraded and Totally Degraded Core ... 103
20 Total Pressure Drop in the Degraded Core as a Function
of the Ratio of Particulate Bed Height to the
Corresponding Intact Fuel Rod Length, Case 1...105
21 Pressure Drop in the Degraded Core as a Function of the Ratio of Bed Height to Original Fuel Rod Length,
Case 2 ... 106
22 Percentage Ratio of Mass Flow Rate in Degraded Core m, to Initial Core Flow Rate, m , as a Function of the
Ra-tio Bed Height to Initial Fuel Rod Length, Case 2 ... 108
23 Coolable Particle Bed Heights Dependence on Decay
Heat Production q"...114
24 Coolable Particle Bed Heights Dependence on
Driving Pressure Difference ... 115
25 Coolant Mass Flow Rate for Saturation at Bed Exit Dependence on Decay Heat Production, in a Totally
Disrupted Core, Case 2 ... 116 26 Heat Flux Leaving Bed Top Surface Dependence on
Coolant Superficial Velocity in a Totally
Degraded Core ... 120
27 Coolant and Debris Bed Axial Temperature Distribution
in a Partially Degraded Core, Case 1 ... 122
28 Debris Bed Axial Temperature Distribution in a
Totally Degraded Core, Case 2 o... 123
A.1 Reactor Core Schematic, before and after the Accident
with Debris Particles Settled in Flow Channels ... 130
A.2 Schematic of Core Configuration after the Accident with Debris Filling the Entire Core Cross Sectional
Area ... 130
The Effect of Void Fraction on Pressure Drop ... 134
LIST OF TABLES Table No. 1 2 3 4 5 6 7 8 Page 28 65 77 84 87 88 92 Data on Sphericity $s . .. . ...
Summary of Particle-to-Fluid Heat Transfer
in Fixed Beds ...
Summary of Particle-to-Fluid Heat Transfer
in Fluidized Beds ... TMI Core Parameters ...
Values of Bed Height LB when the Length L of an Initial
Fuel Rod Li Remains Intact, and Debris Bed Formed
on the Second Grid ...
Values of Bed Height LB when the Length L of an Initial Fuel Rod Lo Remains Intact, for the Case where the
Debris Settles on the Core Bottom Grid ...
Calculated Values of (AP/) M and E for Particulate Debris Beds at Various Conditions (P = 1000 psi) ...
Comparison of Correlations for Heat Transfer
NOMENCLATURE
a = mean specific surface (L~
)
AB bed cross sectional area (L 2
A = fuel cross sectional area (L
)
A = total flow area
Ar = Archimedis number = D 2
C = specific heat at constant pressure
d = core equivalent diameter (L)
d = particle mean diameter (L)
d = bed diameter (L) t D = diffusion coefficient 2 D = column diameter (L) c D = particle diameter (L) D = bed diameter
Fe = Fedorov number used in Ref. [111] Fr = modified Froud number in Ref. [115]
= (D g/U f) 1/2 xPPPf
(1- )2]
g = acceleration due to gravity (
G = mass velocity 2
h = particle heat transfer coefficient -)
p tT2
h = enthalpy of vaporization
fg
KiJ)
tJ =heat transfer factor = c G _ r
(J h fp= heat transfer factor used in Ref. [115]
kf = thermal conductivity of fluid
k = thermal conductivity of solids
p
(t3e
k = thermal conductivity of water
K = Darcy permeability
Keff effective thermal conductivity(
M~)
Ker = thermal conductivity in radial direction
Kob overall bed conductivity (L
L = remaining intact fuel rod length used in Eq. (A.1) (L)
LB bed height (L)
(LB)= mf bed height at minimum fluidization velcoity (L)
L = core active height (L)
n = mass flow rate ( ) t
mn = initial mass flow rate in core (-)
0 t
M =sweepout rate constant
N = number of fuel rods
Nu = particle Nusselt number = (
P = pressure
\Lt/)
Nomenclature (continued)
Ud
Pe = Peclet number =
)
Pr = Prandtl number = (f c /k f)
q''' = volumetric heat generation (M/Lt
)
q" = bed volumetric heat generation rate (M/Lt
)
b3q = dryout heat flux (M/t
)
q = decay heat (ML 2/t3)
Ra = Rayleigh number = P fgSLK/pa) (qbH2 /KB)
Re = particle Reynolds number = (d Up f/yf)
Re = Reynolds number at mimimum fluidization velocity = (dpU fpf / f)
Ret = Reynolds number at particle terminal velocity = (P fUtdp/ f)
St = Stanton number = (h/c G)
p
t = time, a fundamental dimension (t)
T = temperature (6)
U = superficial velocity (L/t)
U = particle terminal velocity (L/t)
U = superficial minimum fluidization velocity (L/t)
3
V = bed volume (L3)
V = initial core volume (L 3 0
x. = fraction of material in size interval i
a. = factor in Eq. (2), or diffusivity in Eq. (33)
S = factor in Eq. (2), or linear thermal expansion in Eq. (33) (6
)
E= void fraction of the bedEd void fraction for dense packed bed E = void fraction for loose packed bed
Nomenclature (continued)
mf = void fraction at minimum fluidization conditions
= temperature, a fundamental dimension (e) 3 y = density of fluid (M/L
)
3 p = density of solid (M/L ) 3 p = density of vapor (M/L ) p= density of liquid (M/L3) s = sphericityV = kinematic viscosity of liquid (L 2/t) 2 V = kinematic viscosity of vapor (L /t)
a = surface tension (M/t2
)
S= ratio of channelling length to particle diameter
CHAPTER 1
INTRODUCTION
1.1 Research Objectives
The objective of this work is to review the state of knowledge of the
heat transfer and the hydrodynamics of a particle bed and assess the
applicability of this information to in-situ cooling of a degraded reactor
core in the forced convection mode. The work is aimed primarily at
conditions representative of what may be expected under Light Water Reactor
(LWR) severe accidents. However the information, in general, has been
originated either in the chemical industry or in Liquid Metal Fast Breeder
Reactor (LMFBR) safety research.
1.2 Insight into Problem
The accident at the Three Mile Island has promoted numerous
investi-gations of the safety aspects of nuclear power plants. As a result of the
sequence of events at TMI, class 9 accidents, in which the events are
classified as highly improbable, gained increased attention in analysis
of safety of the plants.
In one scenario, the loss of coolant, may result in partial uncovering
of the core and subsequent heat up and damage of fuel elements. When
mol-ten core materials encounter liquid coolant, freezing and fragmentation
normally occur. The frozen particles may settle on horizontal surfaces
such as spacer grids forming the so-called debris or rubblized bed. The
fuel in these debris beds will be heated by radioactive decay of retained
fission products.
Previous work on particle bed coolability assumed the presence of an
convection and boiling providing there is an adequate heat sink or coolant
source to maintain the overlying coolant pool. The hazard level which
should be assigned to the resulting post-accident condition depends on the
extent to which natural cooling of the debris may be relied upon. For
sufficiently high decay power, the liquid from the overlying pool cannot
penetrate the particle bed swiftly enough to offset the vaporization. In
this case, portions of the bed dry out and begin heating to above the
coolant boiling point. Thus, even if there is a maintained coolant pool overlying a particle bed, it is still possible under certain conditions
to have structural failure or particle remelt. However, one alternative
method to avoid bed dryout and assure particle coolability would be to
force liquid coolant upward through the bottom of the particulate bed. Determination of the minimum flow rate necessary to prevent bed
dryout requires the understanding and the evaluation of the modes of heat
transfer and the controlling mechanisms as the coolant is forced through
the rubblized bed. The configuration and the geometry of the bed play an
important part in the manner in which heat is transferred from the
particles to the coolant. Depending on the pressure drop, the bed may
exist in a fixed or fluidized state. High rates of heat transfer exist in the bed when the fuel particles fluidize due to the mixing caused by the motion of particles in the coolant.
Considerable experimental effort has been reported on the character-istics of debris beds that may result from a hypothetical LMFBR accident. Most of the investigations focused on the problem of thermal behavior and
dryout of particulate beds when present in a coolant pool. Attention was
information on particle-to-fluid heat transfer under single phase forced
flow is available from research conducted in the chemical industry.
Packed and fluidized particulate beds have been the subject of many
investigations in that field for a variety of applications. It is not
clear, at the present time, as to what extent this information can be
applied to the analysis of degraded LWR cores, since the conditions may
differ considerably from those investigated in the chemical engineering
area.
It is the aim of the present work to try to utilize such information,
where valid, in assessing the coolability of degraded LWR core, and
CHAPTER 2
REVIEW OF SOME PHENOMENA ASSOCIATED WITH LWR ACCIDENT
2.1 Accident Initiation
A hypothetical accident in a pressurized light water reactor (PWR) may
be initiated by events resulting in loss-of-water inventory from inadequate
normal system makeup, a small pipe break, or through a safety/relief valve
(SRV). The latter category includes events that might result in reactor
isolation with SRV actuation, complicated by a stuck-open relief valve
(SRV) such as occurred at the Three Mile Island, TMI plant [1]. It also
includes the case of a SRV opening inadvertantly and remaining open. The
loss of water inventory will result in progressive uncovery of the core and
a consequence heat-up of the top region of the fuel elements. Fuel rods
may burst and zircaloy cladding will embrittle by oxidation and conversion
into zirconium oxide; "liquified fuel" (UO2 dissolved in either molten
zircaloy metal or eutectic liquid formed between zircaloy metal and its
oxide) will also be formed and may flow down between oxidized cladding
shells and freeze upon reaching a lower temperature at a lower level.
However, if the reactor coolant pumps are turned on, the embrittled
clad-ding will be thermally shocked by the influx of coolant (whether steam or
water) shattering it, producing a "rubble" or "debris" bed of cladding
fragments, zircaloy oxide shells, fuel pellets and liquified fuel,
supported by fuel rod stubs and unmelted grid spacers.
Another event that may lead to the fragmentation and dispersal of fuel
is the result of the violent mixing of hot molten fuel with cold liquid
(MFCI). The RIA-ST-4 experiment recently conducted at EG&G [2] under
con-ditions that are more conservative than what may be expected for LWR
reactivity transients produced extensive fuel fragmentation. The
fragmen-tation of the molten fuel debris may have been caused by the violent
release of dissolved gases and entrapped water vapor from within the molten
drops [3], or by a film boiling collapse mechanism [4] or both. The
particle size distributions obtained during the RIA-ST-4 experiment and the
high power excursion tests performed in the (CDC) facility at the Idaho
National Engineering Laboratory are shown in Fig. 1.
2.2 Potential of Core Inadequate Cooling
In a reactor accident, the ultimate coolability of the core materials
is of prime importance. If the heat from decaying fission products cannot
be adequately removed, heating of the core material will occur with
pos-sible fuel melt and damage of the surrounding structure. In an intact
core, decay heat can be removed by natural circulation if there is adequate
coolant available and an ultimate heat sink. However, in a damaged core,
flow paths may be restricted and heat removal made more difficult. Heat
removal is particularly difficult if the core material is in a particle
bed. As discussed in the previous section, particle beds can form either
by thermal fracturing of intact core before melt or by quenching of molten core materials. In either event, flow within the particle bed may be
sufficiently restricted to prevent adequate heat removal. If the debris
bed is not sufficiently cooled, it would melt through the vessel bottom
and form a molten pool [5]. After breaching the pressure vessel, the
molten mass interacts with the concrete base mat. If water is available it
0 '10 20 30 40 50 60 70 80 90 100 Fraction of Particles of Diameters Smaller than
that Indicated (Wt%)
Figure 1: Results of Simulated Experiments to Predict Particle Size Distribution Expected in LWR Severe Accidents [2]
w 3~ N 10 C,, w C-, *i-4 4-) '-I 2 10
is by conduction, but convection may be the principal mechanism within the
bed molten mass. The upper surface of the latter can be cooled by
radia-tion and convecradia-tion to the overlying structure.
2.3 Core Debris Behavior and Cooling
As discussed in the previous section, insufficient cooling of
particu-late bed will result in heat up and remelt of particles with subsequent
damage of core supporting structure. However, the possibility of achieving
coolable geometry depends primarily on the manner in which heat is
trans-ferred from the particles to the surrounding coolant.
In the absence of forced flow, if the bed is submerged in a coolant pool with an adequate coolant source to prevent boil-off, and if the
decay power is sufficiently low, all decay heat produced can be
removed by the boiling process. In this case, the bed will remain
at the boiling temperature of the coolant and the supporting structure
will remain intact. For sufficiently high decay powers, though, the
liquid from the overlying pool cannot penetrate the particle bed swiftly
enough to offset the vaporization. In this case, portions of the bed will
dry out and begin heating to above the coolant boiling point. Because of
the low thermal conductivity of dry particle beds, only a small dry zone
is needed to reach a temperature sufficient to remelt the particles or
weaken the supporting structure. Thus, even if there is a maintained
coolant pool overlying a particle bed, it is still possible to have
particle melt or failure of the supporting structure if the bed drys out.
Forced flow cooling is another important aspect of achieving particle
coolability, however, up to the present time there is no supporting
burnout as a function of flow rate and particle geometry , self-pumping
capability and pressure drop as a function of flow rate and quality.
Therefore, experimental data on through-flow with heating is essential in
assessing the capability of debris bed cooling. In a later section of
this report a theoretical investigation in the area of single phase
forced flow through a degraded LWR core is pursued with regard to the
CHAPTER 3
HYDRODYNAMICS OF FLUID FLOW IN POROUS MEDIA
3.1 Background
There exists now extensive literature on the flow of homogeneous
fluids through porous materials. Most of the early work in this area was
concerned with the flow of liquids at sufficiently low Reynolds numbers so
that the linear Darcy law could be used to describe the flow process.
Interest then turned to the flow of gases through porous materials and
again the linear Darcy law was usually used to describe the flow, with
compressibility taken into account when necessary by employing the perfect
gas law and assuming isothermal conditions. When a fluid flows through a
porous medium, the velocity of a fluid element changes rapidly from point
to point, both in direction and magnitude, along the tortuous flow path.
Hence, if the flow is dominated by viscous effects, then the relation
between applied pressure and flow velocity will be linear and Darcy's
law will hold. However, if inertial effects in fluid acceleration and
deceleration and direction change are significant, then that relation
between pressure and flow will be non-linear and Darcy's law will not be
valid. Hence, Darcy's law will only hold for the "seepage flow" regime
which is laminar flow without significant inertia effects.
Many investigations have been directed towards finding the range
of Reynolds number for which Darcy's law is valid. That the
representa-tion by Reynolds number was chosen originally is due to the assumprepresenta-tion of
an analogy between flow in tubes and in porous media. Capillary models
of porous media, which represent the media as composed of a bundle of
transition from laminar flow to turbulent flow in circular pipes at a
critical Reynolds number of approximately 2,000. This critical Reynolds
number for flow transition in straight tubes is not really applicable to
porous media due to the extensive curvature and tortuosity of the flow
paths. The critical Reynolds number for straight tubes is not directly
comparable for curved tubes. In fact, it has been shown that the critical
Reynolds number is strongly dependent on curvature. The linear
Hagen-Poisenville [6.7] solution for flow in straight tubes also neglects inertia
terms which would be important. Both of these conditions are analogous
to porous media. Sheidegger [8] reports that values of the critical
Reynolds number for transition between linear laminar flow and flow
where inertia terms are important range from about 0.1 to 75. This large
uncertainty is principally due to the difficulty in accurately describing
the correct characteristic hydraulic diameter for porous media in the
reynolds number expression. Due to separate viscous and inertial
regimes in laminar flow, there are three semi-distinct regimes for flow
through porous media. For Reynolds numbers of about 1 or smaller, the
flow is linear laminar as described by the Darcy equation in which the
pressure drop and flow or velocity are related by:
AP _ 1 (1
LB K
AP, LB, K and U are the bed pressure drop, length, Darcy permeability, and superficial velocity, respectively, and y1 the fluid viscosity. For
Reynolds numbers of order 1 through order 1000, the flow is still
are non-linearily related according to a square law. The third flow
regime for Reynolds number higher than 1000, the flow is considered
fully turbulent.
The description of flow outside the Darcy regime started with an
equation postulated by Reynolds [8] where the pressure drop is equivalent
to a sum of two terms, such as
-- = ayu + SpU2 (2)
with factors a and S functions of the media geometry and conditions, and p the fluid density. The first term represents viscous losses and is essentially the Darcy equation. The second term represents kinetic energy
losses due to flow acceleration in magnitude and direction. The basic
form of this equation will not change for fully turbulent flow since the
kinetic energy losses due to inertia terms are of the same type as in
the non-linear laminar flow regime.
Various expressions such as those due to Karman and Kozeny [9], have
been developed to relate the coefficients a and
B
to the mediacharac-teristics such as porosity and specific surface area. For example, the
reciprocal of a is the classical Darcy permeability K. However, the various investigations have not produced consistent results over a wide
range of packing geometries. The scatter of data has been attributed to
the influence of packing, shape, orientation, voidage, and entrance
effects {10].
The most useful approach to correlating momentum transfer data over
proposed a semi-theoretical equation which makes allowance for the mean
hydraulic radius of the flow capillaries and for the effect of voidage.
This equation has been fitted with moderate accuracy to the data of
several workers. The Ergun equation is given as
2 2
AP (1 - E) p U (1 - E) Pf
= 150 3 - 2 + 1.75 3 - 3)
B E (# d ) $ d
s p s p
The relative importance of each term is decided by two statistical
con-stants characteristic of the tortuosity of the flow passages. At low
Reynolds numbers the Ergun equation reduces to the Karman-Kozeny
equation and at high Reynolds numbers to the Blake equation.
2
AP= 150 (1- E) URe dPfU (4)
LB 3 - 2 p < 20 B E ( d P) y s p and 2 - 1.75 p U Re > 1000 (5) LB E3
#
-d PPIn the intermediate region both terms must be used.
For randomly packed beds the Ergun correlation is expected to
repre-sent the data within ±25% [12], however, it is not expected to extend to
non-randomly packed beds, to beds of solids of abnormal void content, or
to highly porous beds. Handley and Heggs [13] showed that the Ergun
equation may be fitted accurately to data obtained from beds covering
Ergun tortuosity constants strongly influence the convective heat transfer
mechanisms within the bed. They correlated their experimental data in a
linear Ergun manner covering a wide range of packing shapes and orientation
with materials having equivalent diameter range from 1.3- 10.4 mm. Their
correlation is of the form:
2 2
AP = (1- E) U (1- E) U (6)
L 3 -2 3 f
-B E d E d
p p
The pressure drop in beds of mixed size particles follows any of the above
correlations for single size particle with d representing the mean particle
diameter of a mixture of different sized particles defined as:
6
(7) p
$ aS
a , being the mean specific surface, .(i.e., surface area per unit volume of
particles only)
all i
a = 6 x) (8)
$s d pi
where x. is the fraction of material in size interval i.
The voidage £ for a mixture of sizes cannot be estimated reliably;
factors that must be considered include the size of the particles and the
shape of the size distribution curve. For example, if the size variation
is large, the small particles may fit into the voids between the large
For nonspherical particles the sphericity $s is used as a parameter
defined as
surface of sphere
\Surface of particleboth of same volume
With this definition, $s = 1 for spheres, and 0< s< 1 for all other
particle shapes. Table 1 lists calculated sphericities of different
solids [12].
3.2 Fluidization of Particulate Beds
If the fluid velocity through a bed of particles is gradually
increased, the bed hydraulic resistance increases until the force
resisting the flow is equal to the bed weight whereupon no further increase
in the hydraulic resistance of the bed occurs. However, further increase
in the fluid velocity leads to expansion of the bed, marking its transition
to the fluidized state.
If the flow rate of fluid is increased above the minimum required to
produce a fluidized bed one of two things will occur: either the bed will
continue to expand so that the average distance between the particles will
become greater, or the excess fluid will pass through the bed in the form
of bubbles, giving rise essentially to a two-phase system. These two
types of fluidization are referred to as being respectively "particulate"
and "aggregate." In general, particulate fluidization occurs with
liquid-solid systems, and with gas-liquid-solid systems when the particles are very
fine, and then over only a limited range of velocities. Aggregate
TABLE 1
Data on Sphericity
#s
[12]Observer Material $
S
Leva et al. [14] sand 0.600, 0.861
iron catalyst 0.578
bituminous coal 0.625
celite cylinders 0.861
Uchida & Fujita [15] broken solids 0.630
Shirai [16] sand 0.534-0.628
liquid-solid systems when the solids are of a high density.
Upon increasing the fluid velocity even more, carry-over of particles
from the bed finally occurs, the fluidized bed undergoes transition to a
bed entrained by a fluidizing stream. At the minimum fluidizing velocity,
which marks a transition from the fixed to the fluidized state, it might
be expected that flow relations for the fixed bed would be applicable to
the fluidized bed. At the other limit, if a bed is fully expanded so that
its voidage approaches unity, it consists effectively of single isolated
particles suspended in the fluid and therefore any relation describing
a fluidized bed should extrapolate to one applicable to an individual
particle. At intermediate conditions, the particulate fluidized bed is
hydrodynamically similar to a sedimentary suspension. In the fluidized
bed the particles undergo no net movement and are supported by the upward
flow of fluid, whereas in a sedimentary suspension the particles are
moving continuously downwards and the only net movement of fluid is that
due to the displacement of fluid by the particles as they settle.
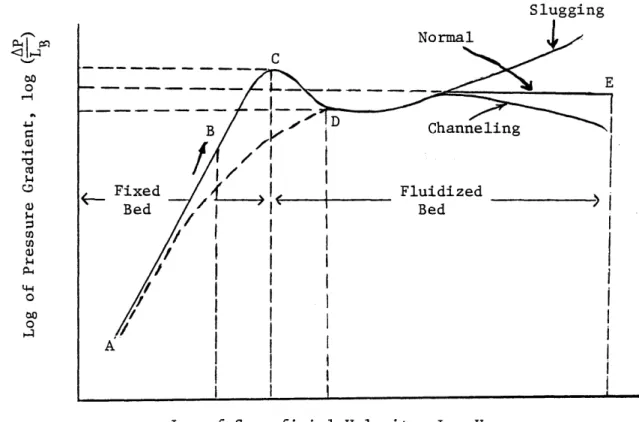
3.2.1 Pressure Drop-Velocity Relationship in Fluidized Beds
The basic interrelationships among the fluidizing variables are shown
in Fig. 2, the upper plot indicating the change in the pressure gradient
as the fluid velocity changes and the bottom plot the shift in the void
fraction (porosity) with fluid velocity. Logarithms of the various
quantities are plotted.
Fixed-bed conditions prevail from A to C with the portion from A to B
varying linearly as would be expected. The deviation from linearity
between B and C is indicative of movements and rearrangements within the
Nor Slugging nal C 0 Q) 0
Log of Superficial Velocity, Log U
I
I
I
I
1L
~~1~-
I
I
I
I
I
1
I
I
I
I
I
I
I
I
I
I
I
I
II
I
II
I
D - I 1.0 I A B C 0Id
CO 0I 5-0 Log UFigure 2: Typical behavior of pressure gradient and porosity of a bed as a function of the fluid superficial velocity B DChanneling Fixed Fluidized Bed Bed A . 0
the direction of flow. Little, if any, change in the bed's void fraction
occurs up to point C. At C fixed-bed behavior terminates, particles and
clusters of particles begin to move continuously, although only a part of
the bed may do so initially. A slight decrease in pressure drop often
occurs as indicated between C and D as dynamic conditions develop. It
apparently results as the particles separate from one another due to
loosening of particle interlocking and of cohesive forces among the
particles. The segment of the curve BCD is not reproduced should the
fluid velocity decrease over that range; the curve diminishes, instead,
approximately as shown by the dotted line. In an ideal situation, the
pressure drop will rise slightly as the minimum at D is passed, but it
will not exceed that indicated by point C. If there is channeling in
the bed the pressure loss will not attain the value of C. In fact,
the extent of the failure to recover is an indication of the channeling
tendancies of the solids being fluidized.
While the pressure drop remains nearly constant once fluidization is
established, bed expansion can theoretically continue until one particle
remains in the space of the original bed. An upper limit for E is thus
established. With liquid fluidization this greatest velocity generally
corresponds closely to the particle's terminal settling velocity Ut' 3.2.2 Initiation of Fluidization
For a fluidized bed there is a minimum void condition in which the
bed can exist, a minimum pressure loss for the fluid that will maintain
(i) Minimum voids
Since there must be a discrete separation of particles for fluid flow
to induce motion within particle masses, this separation sets the minimum
voidage. The minimum voids for fluidization, denoted by ( mf) is
apparently a characteristic of the particles. Values range from about
0.4 for spheres, to 0.8 for very irregular shapes [17]. Such a variation
is to be expected since as the particles become less symmetrical, they
require more space to move about without interference. The minimum void
space decreases as particle size increases unless, of course, there is a
decided change in shape factor or density associated with particle-size
change. Theoretically, the value of Emf should be the same regardless of
whether the fluid is a gas or a liquid. Actually it may be slightly higher
with liquids due to inertial influence but the difference is not large.
(ii) Minimum pressure gradient
The pressure loss at the initial fluidization point (AP mf) is readily
calculated. Fluidization begins when the pressure drop equals the buoyant
weight of the solid material per unit volume of bed and is given by [18]
(AP)f = (ps ~ Pf - f) (LB Mf (9)
(iii) Minimum fluidizing velocity
The minimum fluidizing velocity can be approximated by an expression
for the relation between pressure drop and superficial velocity for a
fixed bed when the pressure drop is equated to the buoyant weight of the
particles. This does, however, necessitate a knowledge of the voidage of
shape and size range of the particles.
Various attempts have been made to relate the value of cf to a shape
factor for the particle, but these have not been entirely satisfactory
[19,20]. The pressure drop above the fluidized bed is given by
Al' = (p - Pf)( LB g) (10)
If the bed expands, the product, (1-E)LB, will remain constant. Combining
Eq. (3) with Eq. (9) will give a quadratic equation in U mf thus
2)3 3
d U pf) 1.50(1- e f) d U gp d 3pf (ps - pf)g
1.75 p mf + mf p Mf f _ p11s
E:3 y2 3 yP 2
S mf smf
However, for small particles diameter (10-100 yrm) and of small
specific weight, Eq. (3) simplifies to Eq. (4), thus Eq. (11) gives
23
U = s d ) 2 P s Pf :
Umf d P Pfg (f Re < 20 (12)
150 (1 Ef)
For large particles Eq. (3) simplifies to Eq. (5). Thus, Eq. (11)
becomes
U2 s p s f gE3 Re > 1000 (13)
mf 1.75 Pf m
If E and/ or s are unknown, the following modification of these
systems that
~ 14 and 2 3 f l1 (14)
s mf s mf
and when replaced in the expression above, this gives for the whole range
of Reynolds numbers
d fU Pf r 0 d3 Pf(p - pf)g 1/2
P f f= (33.7) + 0.0408 p f 33.7 (15)
or for small particle diameter
d (p - P )g
U = f Re < 20 (16)
1650 yi
and for large particle diameter
2 d (p5- pf)g
U2 p sPf Re > 1000 (17)
mf 24.5 pf
These simplified expressions, Eq. (15) to (17), give U in terms of
the usually specified variables of densities, particle size, and fluid
viscosity; and for 284 data points in a Reynolds number range of 0.001
to 4000 these expressions have been found to give predictions of Umf
with a standard deviation of ±34% [22]. Many alternate procedures have
been proposed. These are presented by Leva [21], Wen and Yu [22], and
If the bed contains solid particles of various sizes (or densities),
as U, the superficial velocity, increases the smallest particles are first
fluidized and larger particles later. The corresponding minimum fluidizing
velocities is then dependent on the size distribution or density [24].
3.3 Particulate (Liquid-Solid) Phase Expansion
Liquid-solid fluidized systems generally exhibit the characteristic
of a smooth expansion of the bed as the velocity is increased from the
minimum fluidizing velocity to the free-falling velocity of the particle,
if the particles are uniform. Where there is a spread of particle
pro-perties, there is a marked tendency for segregation to occur within the
bed [28].
A number of workers including Hancock [25], Steinour [26], Lewis et al. [27], and Richardson and Zaki [28], have suggested that the
most convenient way of showing the variation of fluidizing velocity, with
voidage is by means of a Log-log plot of velocity against voidage since
this commonly gives a linear relation;
U En
(18) U
t
Where (U
)
is the particle terminal velocity and (n) is a function of the flow regime and the nature of the particles. Richardson and Zaki [28]related n to the Reynolds number, based on the particle terminal velocity,
Ut d p n = 4.6 0<Re = < 0.2 t y = 4.4 Re 0 .3 3 0.2< Re < 1 t t -0.1 (19) = 4.4 Re . 1 <Re < 500 t t = 2.4 Ret > 500
Equation (18) is applicable also for uniform nonspherical particles, but
the index n has higher values than for spheres. Experimental work [28]
on particles of fixed geometric forms (cubes and cylinders) and for Ret greater than 500 has shown that the index n could be expressed in terms
of the shape factor K defined by the relation
d 3
K= 7 - (20)
6 3 d
p
where d is the diameter of the circle of the same area as the projected
area of the particle when lying in its most stable position, and ds is
the diameter of the sphere with the same surface area as the particle.
The values of n for Re> 500 were given by
n = 2.7 K0.1 6 (21)
3.4 Particles Entrainment and Sweep-out
Core debris particles generated by the quenching of molten core
debris in water are expected to settle downward into available horizontal
net coolant flow, such as through the outlet plenum of a reactor vessel,
then some of the particles may be swept away into the primary loop piping
system instead of settling downward. The final particle locations depend
strongly on the details of the flow field as well as on the particle size
distribution and the physical properties of the solid and liquid phases.
However, the effective parameters may be summarized according to the
fol-lowing general observations:
1. Sweepout is normally insignificant if the bed average size
parti-cles are fluidized with flow rates that are not significantly
above the terminal velocity of the smallest or lightest
parti-cles. If the solid bed is however composed of a wide range of
size components, comprising very small particles, significant
sweepout of these fines may occur at fluid rates which are only
slightly in excess of the terminal velocity of these smallest
particles.
2. For fluid flow rates that are significantly above the terminal
velocities of the particles, sweepout becomes significant even
with beds of relatively narrow size distribution.
3. Sweepout of particles at a given velocity decreases with an increase in bed height and particle irregularity.
The upper limit of coolant flow rate in order to avoid sweepout can
be approximated by the settling, or terminal, velocity Ut of the particles.
Depending on the particle diameters, the values of Ut can be estimated from
Settling Velocity Law g(s - Pf)dp (Stokes) Ut - 18p Re < 0.3 (22a) 0.71 0.71 1.14 0.153 g s(P - Pf) d (Intermediate) (22b) t 0.29 0.43 0.3 < Re < 1000 Pf lf 1/2
1.74
~g(ps
~
f)d]
U= L (Newton) (22c) t 1/2 1000 < Re < 200,000 PfTo determine the rate of entrainment into the coolant flow, it is
assumed that this rate is controlled by the particle characteristics, the
fluid properties, and particle velocities above the bed. Applying
dimen-sional analysis along with experimental data, a correlation for the
speci-fic sweepout rate constant (K) measured in kilogram per square meter of
upper bed surface per second is given as [10]:
- -0.5 -- 0.725 K -5 (U - Ut) d Utf K 1.7x10 p(U - Ut) gdp y 1.15
K
-U-
0.1 Ps Pf U- t (23) Pf U tThe above empirical correlation was obtained by using data based on gas as
the working fluid and the following range of parameters:
0.004 cm < d < 0.015 cm p
To apply the above correlation, an equation must be derived from material
balances to express the amount of each size particle swept-out during a
specified time interval. If c is the concentration of the bed at any time
Woi Wfi
c = (24)
Wfi
where w fi is the amount of particles consisting of size, d., sweepout for
a length of time, t, and wo., is the weight of the particles of that size
present initially, and W is the total weight of the bed.
Differentiating Eq. (24) with respect to t:
dc (W. - W)
t
I - 2 (25)(W
- fibut the change of concentration with time can also be written as
dc = -M 01 fi
(26)
dt W -afi
where M is the sweepout rate constant measured in reciprocal time units. This constant may be expressed
K.A
M W - W fi (27)
where A is the bed cross section. Therefore combining Eqs. (25)
through (27) yields
o_._-_W do f. (o . - o )
oi fi oi fi (28)
or
dwfi (W oi W fi)
--- = K.A
i W -W .
01
Integrating Eq. (29) from 0+t and 0->e .
K
fi
dtf do .i K.IA dtJ
Woi - Wfi) oi 0 ' or K.At 3~ o .w exp fi 0oi o. - W 01The total amount of particles entrained and swept out in time t is obtained
by the sum over all particle sizes:
. f
i
. oi
ifii
[1 -exp
I
(31)3.5 Summary
The following summarizes the important conclusions of this chapter:
1) For a given height and porosity, the pressure drop through a fixed bed can be estimated theoretically using the Ergun equation.
2) In gas-fluidized systems there is a tendancy for the solid to aggregate giving rise to a non-ideal behavior. In liquid-solid
system the dominant flow regime is that of the particulate
fluidization, in which the bed expands uniformly as the liquid
superficial velocity increases.
(29)
3) The relation between bed voidage and velocity in liquid fluidized bed has a simple form given by Eq. (18).
4) The minimum fluidization velocity can be calculated approximately from equations for flow through packed beds, by equating the
pressure-drop through the bed at its maximum stable voidage to
the buoyant weight per unit area of bed.
5) Particles entrainment and sweepout are significant for fluid flow rates that are higher than the terminal velocity of the smallest particles.
CHAPTER 4
HEAT TRANSFER CHARACTERISTICS OF HEAT
GENERATING POROUS MEDIA
4.1 Introduction
Before the discussion of debris bed cooling by forced convection, it
is worthwhile to throw some light on the present literature regarding
natural convection cooling of particulate beds.
4.2 Natural Convection Heat Transfer
4.2.1 Previous Work
Considerable effort has been made in analyzing the thermal behavior of
debris bed that result from a hypothetical core disruptive accident. Gasser
and Kazimi [33] have carried out theoretical analysis for the onset of
convection in a porous medium with volumetric heat source. They considered
a fluid-saturated porous bed with a free surface as an upper boundary
condition and a rigid surface as a lower boundary condition. For bottom
surface temperature, greater or lower than the free surface temperature,
they have obtained a relationship between the critical internal Rayleigh number and the external Rayleigh number.
Sparrow et al., [31] investigated analytically the linear stability
problem for an internally heated fluid layer with both stabilizing and destabilizing temperature profiles in the layer, they showed that the
fluid layer became more prone to instability as the heat generation rate
increased. In other words, the critical Rayleigh number decreased with
increasing departure from the linear temperature profile. Thirlby [32],
among many other theoretical or experimental studies, performed numerical
layer of fluid. He showed that the convection cell size would decrease
with increased Rayleigh number.
Numerous experimental investigations have also been carried out for
the understanding of the debris bed dryout phenomena. Gabor and Sowa [34]
measured the dryout fluxes for sodium or water cooled U02 particulated
beds. The beds were either bottom heated or volumetrically heated. The
bed was believed to have dried out when its temperature was found to
increase rapidly without an increase in the heat input. The volumetric
heated tests were performed by generating heat in the coolant (Joule
heating) rather than in the particles. Gabor and Sowa also conducted
experiments to study the formation of particulate beds and the dryout heat
flux when induction heating rather than Joule heating of the coolant was
employed. The work of Gabor et al, has revealed that the particulate beds can be classified into two categories, deep and shallow beds,
according to the manner in which vapor escapes from the bed. It
was observed that discrete vapor bubbles generated in the lower
portion of a bed coalesce in the upper region to form vapor channels.
These channels extend to the bottom in shallow beds and only part way
into the deep beds. The particles are levitated in the region without
channels. The dryout heat flux is found to be much higher in shallow beds as compared to deep beds. Lee and Nilson [35] gave experimental observa-tions and qualitative interpretaobserva-tions for a series of steady state bench experiments in which decay heat in a debris bed is simulated by Joule heating of the liquid phase. Both single-phase and two-phase boiling
phenomena were examined. More recently, Hardee and Nilson [36] performed an experimental and analytical study on the onset of convection and
convective heat transfer in a porous bed with rigid boundary walls. Rhee
and Dhir [37] determined experimentally how a finite overlying free layer
may enhance natural convection heat transfer and effect the onset of
convective motion in a particulate bed having a uniform internal heat
source.
Dhir and Catton [30] studied the effect of the particle size, bed
porosity and fluid properties on the dryout heat flux in deep and shallow
bottom and volumetrically heated particles. They have also studied and
obtained data on the dryout heat flux when the particulate bed contains
particles of widely different diameters or when both volume heated and
non-heated particles are present in the bed. The effect on dryout heat
flux of relative locations of volume heated and non-heated particles was
also determined.
The studies of post accident heat removal phenomena in LNFBR's [38]
at Sandia Laboratory have utilized for the first time fission heated
experiments to better simulate the decay heating of debris beds by using
the annular core pulse reactor operated at a steady-state mode to fission
heat UO 2-fueled PAHR experiment capsules. In two of the experiments,
threshold dryout of the fuel particulate were produced. During several runs, dryout was maintained for a long period. It was concluded that the observed temperature transients during dryout can be explained in
terms of a conduction process in an expanding zone, and that the expansion
is a displacement process. Expansion of the zone reduces the height
of the overlying convection zone and that while the bed dryout may be
a necessary condition for remelting of the fuel to occur, it is not
4.2.2 Correlations Applied to Natural Convection Cooling
In the analysis of post-accident heat removal, it is important to know
whether the fuel particulate can be adequately cooled by natural convection
of coolant which lies within and above the debris bed. The fluid flow and
heat transfer characteristics of heat-generating porous medium are strongly
dependent on conditions at the boundaries of the region. If the walls of
the containing vessel have high thermal .mass and high conductivity they can
be treated as constant temperature surfaces. Since the walls would be
cooler than the generating bed, a descending boundary layer flow develops
at the walls. If the walls of the containing vessel have negligible thermal
mass and conductivity, they can be treated as adiabatic surfaces, and the
onset of convection is determined by the balance between buoyant and
vis-cous forces. Below some critical Rayleigh numbers, the heat flow is by
conduction alone. Above this Raleigh number, cellular natural convection
predominates. If the heat generation rate is large, boiling and eventual
dryout of the bed can occur. For a heat-generating porous bed which is
cooled from above, but otherwise insulated, the onset of convection has
been calculated by Buretta and Berman [39] as Rac = 33, and the heat
transfer data of these authors and that of Sun [40] can be represented
by the correlation
Nu = 0.116 Ra0.
5 7 3
where Ra is the Rayleigh number defined as
V 2 Ra=pgSLK (EbH) Ra = p K l _(33)
ya K B
where K is the permeability of the bed for single phase coolant flow, S
the linear thermal expansion coefficient, jy the viscosity, a the
diffusi-vity and qb the bed volumetric heating rate. According to the analysis,
the onset of convection corresponds to a critical Raleigh number;
Rac = 33.0. The permeability of typical particle beds can be obtained from the Kozeny equation as
d 3
K = -1- (34)
36 CK (1-C) 2
where CK is the Kozeny constant CK = 4.94 [41].
An analytical model of a single-phase convective roll cell derived
by an approximate technique [36] showed that the onset of convection can be given as Ra = 32, and the heat transfer by
Nu = 0.177 Ra0.5 (35)
Figure 3 shows the experimental findings of Hardee and Nilson [36]. The
combined behavior for conduction and single-phase convection Eq. (35)
is represented by the solid curve, the family of dashed branch lines
Single Phase
Convection
sed Height Permeability Aspect Ratio
(cm) (Darcy's) (L/D)
o0
5 100 0.2O 12 100 0.4
101 10
2
-10Rayleigh Number - Ra
Heat Transfer for a Heat-Generating Porous Bed Cooled from Above [36]
10 1 Q) z 10 0 Conduction 10 100 4S o 36 A 36 100 300 2.2 6.0 Figure 3:
Natural convection heat transfer can be improved by the presence of
an overlying finite layer of coolant. Experimental observations [42]
showed that increasing the height of the liquid layer over the bed tended
to lower the internal Rayleigh number Rac at which onset of convection
occurred. For overlying liquid layer height ratios of 4 or greater, the
natural convection is given as Ra ~ 15. The heat transfer for Ra>15 is
0.79
Nu = 0.117 Ra (36)
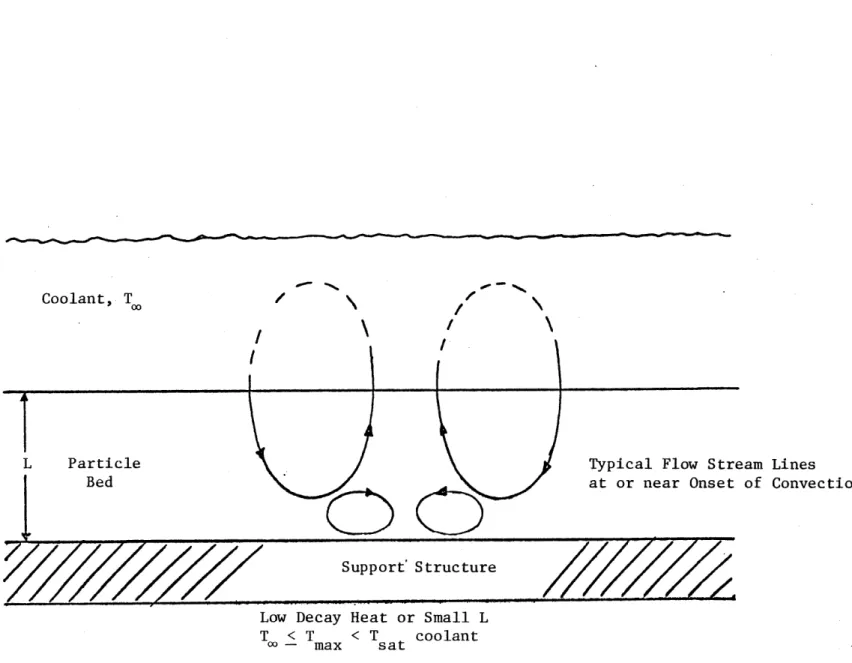
Figure 4 shows the typical flow stream lines at the onset of convection.
4.2.3 Effective Thermal Conductivity of Particulate Bed
Upward heat removal can occur by conduction. Heat conduction is an
effective heat removal mechanism for beds of oxide fuel and steel. The
difficulty in calculating the thermal conductivity of a system composed
of particles interspersed with a continuous liquid phase lies both in
formulating a model that represents the system and in expressing
mathe-matically an effective conductivity on the basis of the model. Any
correlation to apply adequately over a range of conditions must account
for variations in fluid thermodynamic properties as well as particle
properties and dimensions.
If heat is considered as passing through a particulate bed by paths
each composed of one or more discrete steps involving: 1) the solids,
2) the contact surface of the solids, 3) the fluid film near points of
contact between the solids, an analytical expression can be developed
for the bed effective thermal conductivity when the fluid is static [43]
I
L Particle
Bed
I
-IsTypical Flow Stream Lines at or near Onset of Convection
Support' Structure
Low Decay Heat or Small L T < T < Tsat coolant
K = K l- w (37)
eff Lfl~ (1K/K)(7
If f K /K + (1-) (1- K /K )
Where the subscripts f and w denote fuel and water, respectively.
4.2.4 Boiling in Debris Bed
Upward heat removal from particulate beds in water is greatly enhanced
by boiling within the bed. Boiling begins when either the bed loading or the heat generation rate is too great for heat removal by conduction or
where there is insufficient subcooling of the overlying liquid (Fig. 5).
Thicker debris beds and/or higher decay heat will result in more vigorous
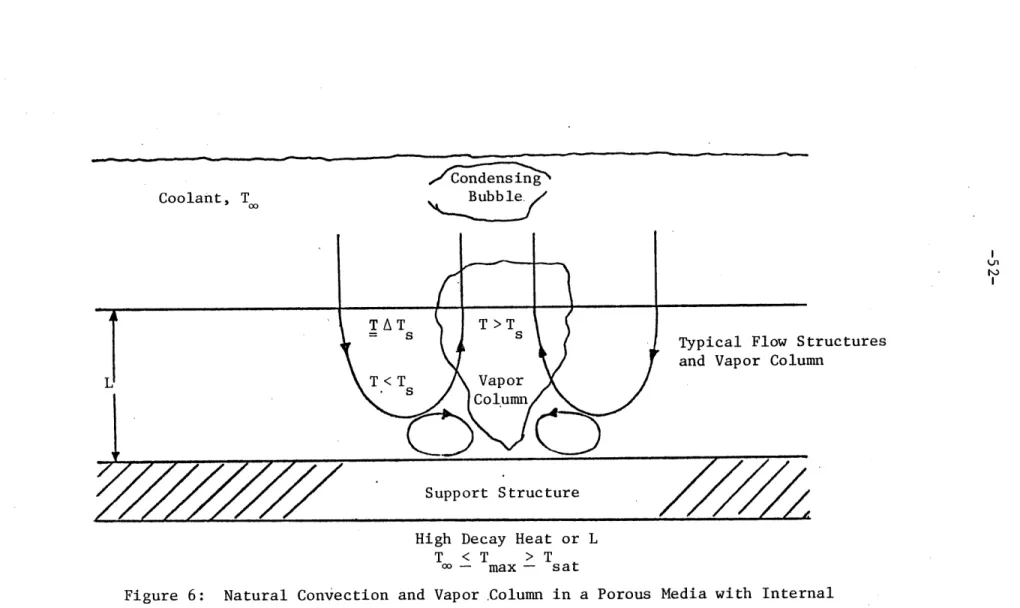
boiling (Fig. 6). Some of the debris may be at temperatures greater than
the coolant saturation temperature, and the steel supporting the structure
could be at temperatures approaching the coolant saturation temperature.
The vapor and liquid may be beginning to interfere with one another.
At very high decay heats or in very deep beds, regions devoid of
liquid will occur (see Fig. 7) because either the vapor blocks the fluid
or the liquid does not have sufficient pressure gradient for it to
pene-trate the debris bed. The dry regions will begin to melt, and the
molten particles will agglomerate. The final form will be a molten layer.
4.2.5 Dryout Heat Flux Correlations
Incipient dryout will occur in debris bed when the vapor generation
rate is sufficiently large that it prevents the adequate flow of
replen-ishing liquid. Incipient dryout thus depends on the fluid material
properties (heat of vaporization, density, viscosity, etc.), particle
sizes and shapes, bed depth, bed packing (space between particles),
/
I
I
Particle BedI
(
/
00
00
0 0 20O
40
0
0$
Typical Flow Stream Linesand Onset of Boiling
Support Structure
Moderate Decay Heat or L
Too < Tmax = Tsat
Figure 5: Natural Convection and Mild Boiling in a Porous Media with Internal Heat Generation
L
I-Typical Flow Structures and Vapor Column
Support Structure
High Decay Heat or L
Too Tmax >
Tsat
Figure 6: Natural Convection and Vapor .Column in a Porous Media with Internal Heat Generation
I
T< sat
Support Structure
Very High Decay Heat or L
T < Tmax Tsat
- Figure 7: Beginning of Dryout and Melting of Debris Due to Internal Heat Generation
7
7,
T > Tsa
I
![Figure 1: Results of Simulated Experiments to Predict Particle Size Distribution Expected in LWR Severe Accidents [2]](https://thumb-eu.123doks.com/thumbv2/123doknet/13966264.453318/20.918.86.824.166.1010/results-simulated-experiments-predict-particle-distribution-expected-accidents.webp)

![Figure 8: Comparison of Theoretical Dryout Heat Flux Correlations [47]](https://thumb-eu.123doks.com/thumbv2/123doknet/13966264.453318/58.918.138.827.63.1022/figure-comparison-theoretical-dryout-heat-flux-correlations.webp)
![Figure 10: Reported Results for Heat Transfer in Fixed Beds, CS, C6, J for Liquid Water, the others for Air [12].](https://thumb-eu.123doks.com/thumbv2/123doknet/13966264.453318/70.918.154.801.145.953/figure-reported-results-heat-transfer-fixed-liquid-water.webp)
