processing: a diffusion-weighted MRI study
The MIT Faculty has made this article openly available. Please share
how this access benefits you. Your story matters.
Citation
Boets, Bart, et al. “Alterations in the Inferior Longitudinal
Fasciculus in Autism and Associations with Visual Processing: A
Diffusion-Weighted MRI Study.” Molecular Autism, vol. 9, no. 1, Dec.
2018.
As Published
http://dx.doi.org/10.1186/s13229-018-0188-6
Publisher
BioMed Central
Version
Final published version
Citable link
http://hdl.handle.net/1721.1/113661
Terms of Use
Creative Commons Attribution
R E S E A R C H
Open Access
Alterations in the inferior longitudinal
fasciculus in autism and associations with
visual processing: a diffusion-weighted MRI
study
Bart Boets
1,2,3*, Lien Van Eylen
1,2, Kevin Sitek
3,4, Pieter Moors
5, Ilse Noens
6, Jean Steyaert
1,2, Stefan Sunaert
7and Johan Wagemans
2,5Abstract
Background: One of the most reported neural features of autism spectrum disorder (ASD) is the alteration of multiple long-range white matter fiber tracts, as assessed by diffusion-weighted imaging and indexed by reduced fractional anisotropy (FA). Recent methodological advances, however, have shown that this same pattern of reduced FA may be an artifact resulting from excessive head motion and poorer data quality and that aberrant structural connectivity in children with ASD is confined to the right inferior longitudinal fasciculus (ILF). This study aimed at replicating the observation of reduced FA along the right ILF in ASD, while controlling for group
differences in head motion and data quality. In addition, we explored associations between reduced FA in the right ILF and quantitative ASD characteristics, and the involvement of the right ILF in visual processing, which is known to be altered in ASD.
Method: Global probabilistic tractography was performed on diffusion-weighted imaging data of 17 adolescent boys with ASD and 17 typically developing boys, matched for age, performance IQ, handedness, and data quality. Four tasks were administered to measure various aspects of visual information processing, together with
questionnaires assessing ASD characteristics. Group differences were examined and the neural data were integrated with previously published findings using Bayesian statistics to quantify evidence for replication and to pool data and thus increase statistical power. (Partial) correlations were calculated to investigate associations between measures.
Results: The ASD group showed consistently reduced FA only in the right ILF and slower performance on the visual search task. Bayesian statistics pooling data across studies confirmed that group differences in FA were confined to the right ILF only, with the evidence for altered FA in the left ILF being indecisive. Lower FA in the right ILF tended to covary with slower visual search and a more fragmented part-oriented processing style. Individual differences in FA of the right ILF were not reliably associated with the severity of ASD traits after controlling for clinical status.
Conclusion: Our findings support the growing evidence for reduced FA along a specific fiber tract in ASD, the right ILF. Keywords: Autism spectrum disorder, Structural connectivity, Diffusion-weighted imaging, Visual processing, Inferior longitudinal fasciculus
* Correspondence:bart.boets@kuleuven.be
Bart Boets and Lien Van Eylen are joint first author.
Bart Boets and Lien Van Eylen contributed equally to this work.
1Center for Developmental Psychiatry, Department of Neurosciences, KU
Leuven, Kapucijnenvoer 7h, PB 7001, 3000 Leuven, Belgium
2Leuven Autism Research (LAuRes), KU Leuven, 3000 Leuven, Belgium
Full list of author information is available at the end of the article
© The Author(s). 2018 Open Access This article is distributed under the terms of the Creative Commons Attribution 4.0 International License (http://creativecommons.org/licenses/by/4.0/), which permits unrestricted use, distribution, and reproduction in any medium, provided you give appropriate credit to the original author(s) and the source, provide a link to the Creative Commons license, and indicate if changes were made. The Creative Commons Public Domain Dedication waiver (http://creativecommons.org/publicdomain/zero/1.0/) applies to the data made available in this article, unless otherwise stated.
Background
Autism spectrum disorder (ASD) is a neurodevelopmen-tal disorder characterized by impairments in social reci-procity and communication, combined with restricted, repetitive and stereotyped patterns of behavior, interests or activities (RRBIs) [1]. Atypical sensory processing is also often reported and has been included in the new diagnostic RRBI criteria of ASD in DSM-5 [1]. Although the etiology of the disorder remains largely unknown, advanced genetic and neuroimaging studies point to-wards the involvement of altered brain connectivity [2], and the core behavioral and cognitive atypicalities have been related to reduced integration of information be-tween different brain regions [3–5]. Reduced long-range connectivity has often been investigated in ASD, but there are many inconsistencies regarding the existence, the direction, and the specific anatomical location of this aberrant brain connectivity [6–10].
Here, we investigated structural brain connectivity in ASD using diffusion-weighted imaging (DWI). This non-invasive magnetic resonance imaging (MRI) technique indirectly assesses the structural properties and orienta-tion of white matter tracts based on the diffusion of water molecules [11]. Typically, reduced diffusivity along the principal axis (i.e., axial diffusivity or AD) and in-creased diffusivity perpendicular to it (i.e., radial diffusiv-ity or RD), resulting in a reduced directionaldiffusiv-ity of diffusion (i.e., lower fractional anisotropy or FA), are considered indicative of reduced white matter integrity and thus reduced structural connectivity [11]. However, this interpretation might be misleading as the exact microstructural and macrostructural substrates of re-duced FA are only partly understood (e.g., axonal dens-ity, axonal diameter, degree of myelination, homogeneity of axon orientation) [12, 13]. Therefore, in the present report, we will refer to the observed diffusion properties per se, without making inferences about white matter integrity.
Previous studies have observed widespread reductions of FA in individuals with ASD and have interpreted these findings as indicative of generally reduced white matter connectivity in ASD [8, 9]. A meta-analysis of diffusion imaging studies revealed four clusters with consistently lower FA in individuals with ASD [8]. The largest cluster was located in the right occipito-temporal region and extended from the inferior occipital and lin-gual gyrus into the fusiform and inferior temporal gyrus. Fiber tracking through this cluster pinpointed aberrant connectivity along the right inferior longitudinal fascic-ulus (ILF) in ASD [8].
Recent findings, however, revealed that differences in diffusion properties may be an artifact resulting from excessive head motion and poorer DWI data quality [14, 15]. Individuals with ASD may be more
prone to greater head motion and the resulting DWI artifacts, as shown by Koldewyn and colleagues [16]. These authors applied diffusion-weighted imaging combined with global probabilistic tractography in school-aged children with ASD versus typically devel-oping (TD) children and showed reduced FA in ASD along multiple white matter tracts. However, after carefully matching data quality and head motion pa-rameters between both groups, all these effects disap-peared, except for consistently reduced FA in one single tract, the right ILF [16]. This study thus chal-lenged the hypothesis of widespread changes in FA-related structural connectivity in ASD and highlighted the importance of matching for data quality.
The ILF is a white matter association tract, extending from the occipital cortex into the anterior temporal lobe [17]. The right ILF connects several brain regions that are crucially involved in face processing (e.g., the occipi-tal face area, the fusiform face area, the superior tem-poral sulcus, and the amygdala) [6], and lesions of the right ILF have been associated with face processing im-pairments [18]. Given the characteristic difficulties of in-dividuals with ASD with processing faces [19–21], Koldewyn and colleagues [16] a priori hypothesized to observe structural abnormalities in the right ILF in indi-viduals with ASD. Yet, as the ILF (both right and left) carries information from many extrastriate visual areas throughout the ventral visual stream, it is also implicated in visual perceptual organization and object recognition in general [17, 22]. Therefore, alterations in the ILF may (at least partially) underlie the known visual processing anomalies of individuals with ASD. Although these per-ceptual atypicalities are often subtle and dependent on particular task and sample characteristics [23], it has been shown that individuals with ASD have problems with global integrative processing and are more inclined to process and attend to parts and details [24–26], as postulated by the Weak Central Coherence (WCC) account [24].
The overall aim of this study was threefold. First of all, we aimed to replicate the findings of Koldewyn and col-leagues [16], obtained in children, in an independent sample of adolescents with ASD and TD controls, using an identical methodological approach. In particular, we expected individuals with ASD to show selectively re-duced FA of the right ILF. Therefore, the right ILF con-stituted the main anatomical target, along with 17 other major white matter tracts that were also included in the study of Koldewyn and colleagues [16]. Second, we ex-plored whether reduced FA of the right ILF is associated with increased ASD symptom severity, both regarding the social and the non-social (i.e., RRBI) domains. Given its involvement in face processing, which is crucial for efficient social communication and interaction, we
mainly expected an association of ILF properties with the social symptom domain. Yet, the ILF also plays a role in visual perception [17, 22], and given that the per-ceptual peculiarities of individuals with ASD are pro-posed to underlie (at least some of ) their RRBIs [27], it is warranted to also explore the association between ILF properties and general RRBI symptomatology. Third, given the involvement of the ILF in ventral visual stream processing, we examined the association between ILF diffusion properties and performance on several visual processing measures. Although both left and right ILF play a role in visual processing, within the context of studying an ASD sample and in line with our previous hypothesis, we mainly focused on the association be-tween individual differences in FA of the right ILF and visual processing measures. Four tasks that are often used in ASD research and that each target visual infor-mation integration in a different manner were adminis-tered: a Fragmented Object Outlines task, a Coherent Motion task, a visual search task, and the Rey-Osterrieth Complex Figure task (ROCF) (for a detailed conceptual and technical description of these tasks, see Van Eylen et al. [23]). Both the Fragmented Object Outlines task and the Coherent Motion task require visual information in-tegration. However, the Fragmented Object Outlines task relies more on ventral visual stream functioning, as it requires form integration [28, 29], whereas the Coher-ent Motion task relies on dorsal visual stream function-ing, since it requires the integration of motion signals [30]. Therefore, it is expected that only performance on the Fragmented Object Outlines task is associated with ILF properties. The visual search task is more controver-sial in terms of the implicated visual processes. While it has traditionally been conceptualized to measure local processing abilities, it also requires various types of grouping and feature integration [31, 32] and may there-fore also be associated with ventral stream ILF diffusion properties. Finally, the ROCF task does not provide an in-dication of processing abilities but provides an inin-dication
of processing style, with a higher score indicating a more fragmented, locally oriented processing style, and a lower score reflecting a more global integrative processing style [23]. For this task, we expect that a more integrative pro-cessing style is related to higher FA in the ILF.
Methods
Participants
Nineteen boys with ASD and 19 TD boys participated in the study. All participants were aged between 11 and 18 years, had a full-scale IQ (FSIQ) above 80 and had normal or corrected-to-normal vision (with glasses or lenses). Data on pubertal development were not col-lected. Participants were excluded if they had a history of epilepsy, traumatic brain injury, and attention deficit/ hyperactivity disorder or if ASD was associated with a genetic syndrome. One individual with ASD had dys-lexia and one had a developmental coordination dis-order. None of the participants took psychotropic medication. Inclusion criteria for the ASD group were (1) a diagnosis of ASD made by the multidisciplinary Expertise Center for Autism (University Hospitals KU Leuven) in a standardized way according to DSM-IV-TR criteria [33]; (2) confirmation of their diagnosis with the Developmental, Dimensional, and Diagnostic interview (3di) [34] and (3) T-scores above 65 on the Social Responsiveness Scale (SRS) [35, 36]. None of the TD participants, nor their first degree relatives, had a history of neurological or psychiatric condi-tions, nor a current medical, developmental or psychi-atric diagnosis. Parents of the control children completed the SRS questionnaire [35, 36] to exclude the presence of substantial ASD characteristics.
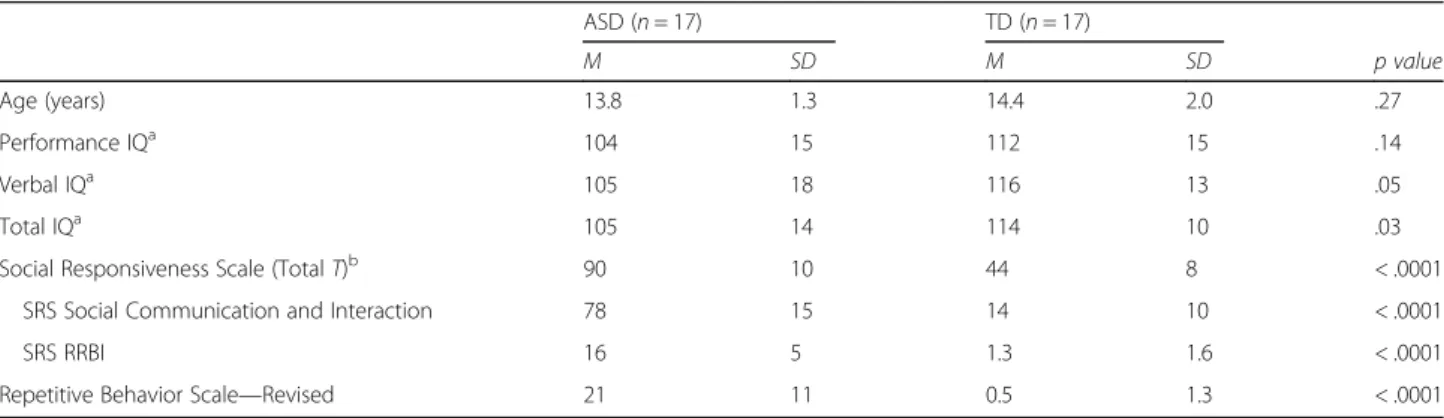
Application of a strict DWI data quality criterion (cf. supra) resulted in the selection of 17 adolescents with ASD (two handed) and 17 TD adolescents (two left-handed), matched for age, performance IQ, sex, handed-ness, and MRI data quality (see Tables 1 and 2). Both groups differed (marginally) significantly with regard to Table 1 Participant characteristics
ASD (n = 17) TD (n = 17) M SD M SD p value Age (years) 13.8 1.3 14.4 2.0 .27 Performance IQa 104 15 112 15 .14 Verbal IQa 105 18 116 13 .05 Total IQa 105 14 114 10 .03
Social Responsiveness Scale (Total T)b 90 10 44 8 < .0001
SRS Social Communication and Interaction 78 15 14 10 < .0001
SRS RRBI 16 5 1.3 1.6 < .0001
Repetitive Behavior Scale—Revised 21 11 0.5 1.3 < .0001
a
Standardized scores with population averageM = 100 and SD = 15
b
verbal and total IQ. However, as we aimed to replicate the study of Koldewyn and colleagues [16] as closely as possible, we ensured to control for the same participant characteristics as these authors (i.e., age, performance IQ, sex, and data quality measures).
The study was approved by the local Ethical Board and informed consent was obtained from all parents/ guardians according to the Declaration of Helsinki, with additional assent from all participating children.
DWI data acquisition
After familiarization in a mock scanner, scanning was performed with a 32 head coil 3T Philips Achieva system at the University Hospitals Leuven. DWI data covering the entire brain and brainstem were acquired using an optimized single-shot spin-echo, echo planar imaging se-quence with the following parameters: 58 contiguous saggital slices, slice thickness = 2.5 mm, repetition time (TR) = 7600 ms, echo time (TE) = 65 ms, field-of-view (FOV) = 240 × 200 × 145 mm2, matrix size = 96 × 94,
in-plane pixel size = 2.12 × 2.5 mm2, acquisition time = 10 min 33 s. Diffusion gradients were applied in 60 non-collinear directions (b = 1300 s/mm2) and one image with-out diffusion-weighting was acquired. Additionally, a high-resolution T1-weighted anatomical scan was col-lected (182 contiguous coronal slices, TR = 9.6 ms, TE = 4.6 ms, FOV = 250 × 250 × 218 mm3, acquisition matrix = 256 × 256, voxel size = 0.98 × 0.98 × 1.2 mm3, acquisition time = 6 min 23 s).
DWI data processing
DWI data were analyzed using anatomically constrained global probabilistic tractography combined with an ex-tensive data quality control, identical to the approach pursued by Koldewyn and colleagues [16]. Tractography was carried out using the Tracts Constrained by Under-lying Anatomy (TRACULA) tool within FreeSurfer [37] (Fig. 1a). TRACULA is a tool for automatic reconstruc-tion of 18 major white matter pathways in native subject-space from diffusion-weighted MR images. It uses global probabilistic tractography with anatomical Table 2 Between-group differences for DWI data quality measures and for FA per tract
ASD (n = 17) TD (n = 17) F p value
M SD M SD
DWI data quality measures
Average translation 1.4279 0.3591 1.4271 0.3597 0.00 0.995
Average rotation 0.0130 0.0047 0.0114 0.0041 1.16 0.290
Percentage of slices with drop-out 0.2781 0.4457 0.1903 0.6030 0.23 0.633
Average signal drop-out score 1.0381 0.0437 1.0187 0.0332 2.12 0.155
Fractional anisotropy (FA) per tract
R inferior longitudinal fasciculus*,° 0.4395 0.0259 0.4622 0.0293 5.74 0.023
L inferior longitudinal fasciculus* 0.4561 0.0319 0.4779 0.0286 4.43 0.043
R anterior thalamic radiations 0.3900 0.0261 0.4012 0.0208 1.94 0.173
L anterior thalamic radiations 0.3928 0.0248 0.4033 0.0295 1.26 0.269
R cingulum-angular bundle 0.3131 0.0351 0.2983 0.0215 2.21 0.147
L cingulum-angular bundle 0.2953 0.0379 0.2880 0.0303 0.38 0.541
R cingulum-cingulate gyrus bundle 0.4161 0.0373 0.4302 0.0527 0.81 0.374 L cingulum-cingulate gyrys bundle 0.4492 0.0468 0.4725 0.0596 1.61 0.214
R corticospinal tract 0.5243 0.0196 0.5228 0.0397 0.02 0.888
L corticospinal tract 0.5352 0.0230 0.5197 0.0307 2.79 0.105
R superior longitudinal fasciculus—parietal 0.4037 0.0253 0.4103 0.0263 0.56 0.461 L superior longitudinal fasciculus—parietal 0.4234 0.0485 0.4300 0.0381 0.19 0.662 R superior longitudinal fasciculus—temporal 0.4711 0.0271 0.4816 0.0270 1.30 0.263 L superior longitudinal fasciculus—temporal 0.4642 0.0304 0.4714 0.0274 0.52 0.477
R uncinate fasciculus 0.4002 0.0247 0.4018 0.0276 0.03 0.862
L uncinate fasciculus 0.3810 0.0247 0.3855 0.0244 0.28 0.603
Forceps major (corpus callosum) 0.5252 0.0866 0.5326 0.0759 0.07 0.793 Forceps minor (corpus callosum) 0.4976 0.0329 0.4938 0.0329 0.11 0.737
Note.*
p < .05,°
priors. Prior distributions on the neighboring anatomical structures of each pathway are derived from an atlas and combined with the FreeSurfer cortical parcellation and subcortical segmentation of each subject’s T1 structural image [38] to constrain the tractography solutions. The posterior distribution of each of the white matter path-ways is modeled as the product of (1) a data likelihood term, which uses the ball-and-stick model of diffusion and (2) a pathway prior term, which incorporates prior anatomical knowledge about the pathway trajectory from a set of training subjects. There is no assumption that the pathways have the same shape in the study subjects as in the training subjects, and thus, TRACULA does not rely on perfect alignment between study and training subjects.
Automated parcellation of the T1-weighted images was performed with FreeSurfer 5.3.0 to identify gray and white matter volumes and to define specific cor-tical and subcorcor-tical regions in each participant [39]. All preprocessing of the diffusion-weighted images (image corrections, image quality assessment, intra-subject and inter-intra-subject-registration, mask creation, tensor fitting, estimation of pathway priors), ball-and-stick model fitting, pathway reconstruction, and ex-traction of DWI statistics were done using standard TRACULA settings. For each of the reconstructed tracts, mean values for FA, mean diffusivity (MD), RD, and AD were calculated by averaging the voxel values along the entire tract. In addition, supplemen-tary analyses were performed where we calculated the DWI statistics only for the center of each tract (i.e., the single-voxel wide path with the highest probabil-ity, along the entire tract) or where we calculated a weighted tract average by weighting each DWI meas-ure at each voxel in the tract by the pathway prob-ability at that voxel.
DWI data quality measures comprised the average volume translation, the average volume-by-volume rotation, the percentage of slices with excessive intensity drop-out, and the average drop-out score for slices with excessive intensity drop-out [40]. Subjects ex-ceeding an average translation of 2.5 mm and/or rota-tion of 1.5° were discarded from the sample. This head motion criterion resulted in the removal of two ASD and two TD participants, and resulted in two participant groups that were well matched in terms of the four mo-tion characteristics (see Table 2).
Visual processing measures and behavioral questionnaires
Prior to scanning, all participants performed four visual processing tasks, as part of a study of Van Eylen and col-leagues [23]. In the Fragmented Object Outlines task, the outline of an object was gradually built up in ten steps, from the most fragmented image (showing 10% of the contour) to the completely closed contour, and partici-pants had to correctly identify the object as soon as pos-sible. The main outcome measure was the correct identification latency (in ms), with a higher score reflect-ing slower performance. This task requires bottom-up contour integration, as well as top-down matching of the perceptual input with object representations stored in memory, and semantically labeling it. In the Coherent Motiontask, participants were presented with a random dot kinematogram and had to detect the direction of co-herently moving dots by integrating the motion stimuli. A coherent motion threshold was estimated by varying the percentage of coherently moving dots. This thresh-old reflects the smallest proportion of coherently moving dots that is necessary to reliably perceive the global dir-ection of motion, with higher scores reflecting reduced performance. In the visual search task, participants
b
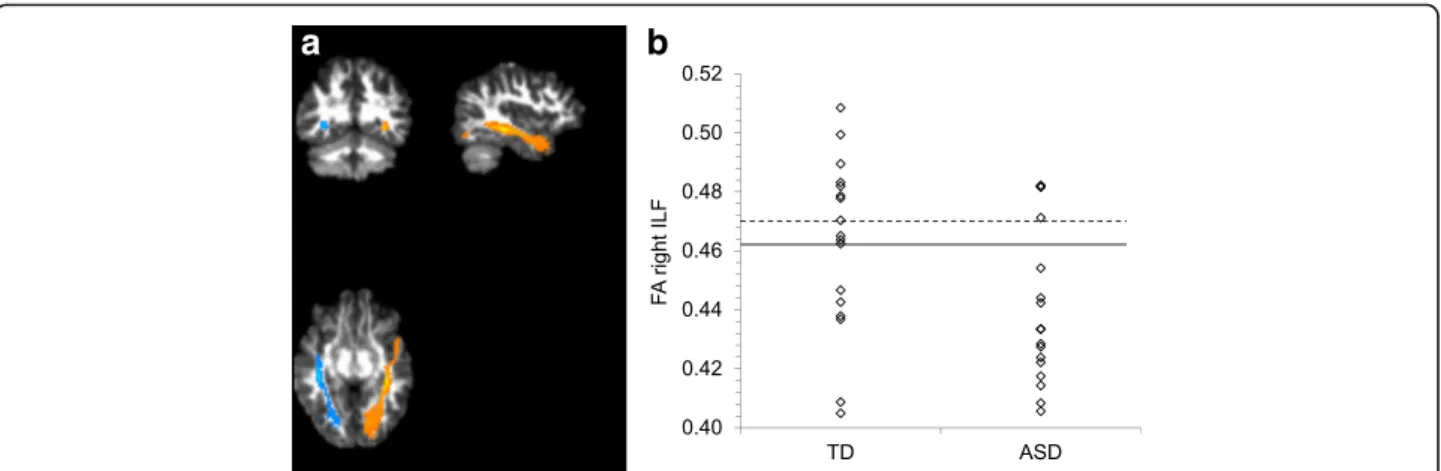
a
Fig. 1 a Illustrative result of the left (in blue) and right (in orange) ILF pathway reconstructed by TRACULA for one representative subject, plotted on its DWI FA map. b Individual FA scores for the right ILF for TD and ASD participants. The solid line indicates the mean of the TD group. The dotted line indicates the mean of the TD group after exclusion of the two outliers
watched a stimulus display containing a pre-specified target hidden among distractors, and participants had to touch the target as soon as possible on a touch screen. Two within-subject factors were manipulated: the num-ber of distractors (14 vs. 24) and the target-distractor similarity (low vs. high). The target detection latency (in ms) was registered, which is the time needed to touch the correct target. Finally, the Rey-Osterrieth Complex Figure(ROCF) task provided an indication of the visual processing style. Participants had to copy the ROCF, and the degree of continuity or coherence in the drawing process was evaluated by calculating a fragmentation score. This score ranged from 0 to 9, with a higher score indicating a more fragmented, locally oriented process-ing style, and a lower score reflectprocess-ing a more global inte-grative processing style. A more detailed description of each of these tasks and their analysis approach is pro-vided by Van Eylen and colleagues [23].
In addition to the experimental tasks, two question-naires were administered to assess ASD characteristics. The Social Responsiveness Scale (SRS) assesses a wide range of behaviors characteristic of ASD and covers sub-scales for “social communication and interaction” and for“restricted and repetitive patterns of behavior and in-terests” (RRBIs) [36]. Likewise, the Repetitive Behavior Scale—Revised (RBS-R) assesses the RRBIs observed in individuals with ASD [41].
Statistical analysis
Distribution analyses were performed and measures were log10or square root transformed to obtain normal distributions. For the DWI data, two outliers were iden-tified in the FA data of the right ILF in the TD group (cf. Fig. 1b). All analyses were performed with these outliers included as well as excluded, and we report the more valid analysis, i.e., including the outliers for the group comparison and excluding the outliers for the correl-ation analyses (since the correlcorrel-ation analyses were dis-turbed by these outliers). Concerning the group comparisons, standard ANOVAs were performed for the DWI measures, the SRS and RBS-R questionnaires, the Coherent Motion test, and the ROCF fragmentation score. For the Fragmented Objects Outline task, a re-peated measures mixed model analysis was carried out with group (ASD vs. TD) as between-subject variable and stimulus type (curved vs. straight) and stimulus homogeneity (low vs. high) as within-subject variables. For the visual search task, a repeated measures mixed model analysis was carried out with group (ASD vs. TD) as between-subject variable and target-distractor similar-ity (low vs. high) and number of distractors (14 vs. 24) as within-subject variables. For the repeated measures analyses, the Kenward-Roger method was used to calcu-late the degrees of freedom, and group contrasts for
specific levels of a within-subject factor were corrected using the Tukey-Kramer procedure. Regarding the cor-relation analyses, whole-sample (partial) Pearson correla-tions were calculated to investigate the association between FA values of the white matter tracts, ASD char-acteristics, and visual processing measures. All analyses were conducted using the general statistical software package SAS Version 9.4 [42].
All reported p values are uncorrected for multiple comparisons, except for a Tukey-Kramer correction for the post-hoc group contrasts in the repeated measures analyses (i.e., when comparing both groups on the low and high similarity condition of the visual search task). A Bonferroni correction for multiple comparisons was applied by dividing the significance level (α = 0.05) by the number of comparisons per type of analysis. For each type of analysis, we also report the Bonferroni cor-rected significance level (α) in the “Results” section. Note, however, that within the context of this replication study, we had a clear a priori hypothesis in which tract to observe group differences in diffusion properties, thus reducing the need to correct for multiple comparisons. Moreover, in a study with a relatively small sample and a large number of measures, correction for multiple com-parisons would not only reduce the chance of making a type I error (i.e., incorrectly rejecting a null hypothesis, which results in false positives) but also dramatically en-hance the cen-hance of making a type II error (i.e., incor-rectly accepting the null hypothesis, which results in false negatives) [43]. As studies in smaller samples are less sensitive to trivial effects and type I errors, correc-tion for multiple comparisons is less relevant and scien-tific importance is better reflected by effect sizes and their confidence intervals [44]. Accordingly, Cohen’s d group effect sizes (and confidence intervals) were calcu-lated by dividing the estimated group difference by the pooled standard deviation. To calculate the pooled standard deviation, a simplified formula could be used (√[(σ12
+σ22)/2]), because our samples have equal size. An effect size ranging from 0.2 to 0.3 is considered small, values around 0.5 are medium, and values of 0.8 or above are considered large effects [45].
Finally, to quantify the success or failure of our at-tempt to replicate the findings of Koldewyn and col-leagues [16] concerning group differences in FA values for the 18 tracts, we performed three Bayes factor tests [46] (for the applied R-script, see Additional file 1). All these Bayes factors express the weighted likelihood ratio between a null hypothesis and an alternative hypothesis. Firstly, the equality-of-effect-size Bayes factor quantifies the evidence for the null hypothesis that the effect sizes in our study equal the effect sizes in the study of Koldewyn and colleagues [16], versus the alternative hypothesis that the effect sizes in both studies are not equal. For this
Bayes factor, values higher than 1 indicate support for the null hypothesis (suggesting successful replication), whereas values lower than 1 indicate support for the alter-native hypothesis. Secondly, the replication Bayes factor quantifies the evidence that the data provide for the hy-pothesis that the effect that we found in our replication at-tempt is consistent with the effect found in the original study of Koldewyn and colleagues [16], versus the null hy-pothesis that the effect is zero. Values higher than 1 indi-cate support for the replication hypothesis, whereas values lower than 1 indicate support for the null hypothesis. However, values between 3 and 1/3 are considered anec-dotal and indicate that the outcome is indecisive [47]. This is the case when the difference between the postulated ef-fect in the null hypothesis and the replication hypothesis is small, so when the effect found in the original study is non-significant and the effect size is close to zero. There-fore, this test is mainly relevant to evaluate the replication success of the significantly lower FA value in the right ILF for the ASD group, as reported by Koldewyn and col-leagues [16]. Thirdly, we calculated the fixed-effect meta-analysis Bayes factor, in which we pooled the data from our study and the study of Koldewyn and colleagues [16]. This factor quantifies the evidence that the pooled data provide for the hypothesis that the true effect is present (i.e., the alternative hypothesis) versus absent (i.e., the null hypothesis), with values higher than 1 providing support for the alternative hypothesis. By pooling the data from both studies, we overcome the power problem of our current study. More specifically, with a sample size of 17 included participants per group, the population effect size
needs to be 0.99 or higher, to achieve a power of 80%. Fur-thermore, only effect sizes of 0.69 or higher achieve a power of 50% and can thus result in a significant group difference (p < 0.05). We therefore lack power to detect more subtle group differences with an effect size smaller than 0.69. However, by pooling the data from both studies and by calculating the fixed-effect meta-analysis Bayes fac-tor, we can quantify the combined evidence for the pres-ence or abspres-ence of an effect for each of the 18 fiber tracts. For all Bayes factors (BFs), values in between 3 and 1/3 in-dicate that the data are ambiguous, making the outcome indecisive.
Results
Statistics for the DWI data quality measures average volume-by-volume translation, average volume-by-volume rotation, percentage of slices with signal drop-out, and average signal drop-out severity are displayed in Table 2 and indicate that groups were well matched in terms of DWI data quality.
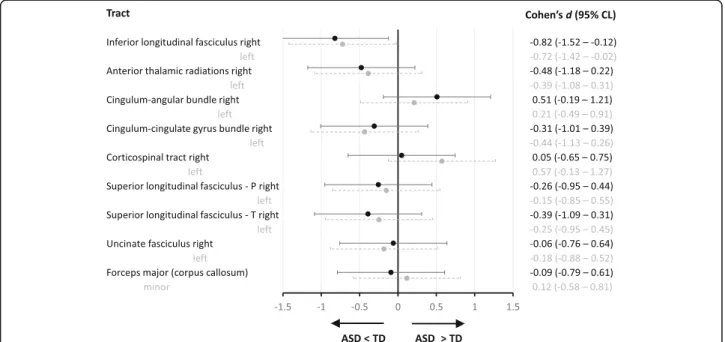
Given our aim to replicate the findings of Koldewyn and colleagues [16], we primarily focused on the FA values of the white matter tracts, especially of the right ILF. A one-way ANOVA comparing ASD vs. TD on each of the 18 tracts revealed similar FA values for both groups on every tract, with the exception of significantly reduced FA in ASD for the right and left ILF (see Table 2, and Figs. 1b and 2). To quantify the evidence that our data provide for replicating the findings from the study of Koldewyn and colleagues [16], we calculated three Bayes Factors (see Table 3). Firstly, the
equality-of-effect-Fig. 2 Effect sizes and 95% confidence limits (CL) for group differences in average FA per tract. Negative scores indicate a lower FA value in the ASD compared to the TD group. P, parietal; T, temporal
size Bayes factor was higher than 1 for all of the tracts, ex-cept for the right CAB, indicating that for all those tracts, there is more evidence that the effect sizes of both studies are equal. However, for several tracts, this Bayes factor was between 3 and 1/3 (i.e., for the left and right ATR, for the left CCG, CST and ILF, and for the right SLFT and CAB), indicating that the evidence for those tracts is indecisive (see Table 3). Secondly, the replication Bayes factor for the right ILF showed that it is 11.6 times more likely that the observed reduction in FA in the ASD group is a replication of the effect found in the study of Koldewyn and colleagues [16] than that this effect is truly zero. Interestingly, for the left ILF, the replication Bayes factor was also larger than 3 (i.e., 4.5). In line with our expectations, the replication Bayes factor was inconclusive (1/3 < BF < 3) for almost all other tracts (see Table 3), since the postulated effect under the replication hypothesis was close to that predicted under the null hypothesis. For the right CAB, however, this Bayes factor indicates that it is 3.8 times more likely that the difference in FA is truly zero than that we replicated the effect described by Koldewyn and colleagues [16]. Thirdly, the fixed-effect meta-analysis Bayes factor also provided strong evidence that the observed lower FA value in the right ILF for the pooled ASD group is a true effect (BF = 125). For the left ILF, the evidence is indecisive (BF = 2), but for all other tracts, this factor indicated that it is 6 to 23 times more likely that the effect is truly zero than that there is a group difference in FA (1/23.3 < BF < 1/6.3).
Concerning AD, RD, and MD, a one-way ANOVA comparing ASD vs. TD revealed similar values for both groups on each of the 18 tracts (all p > .10), with the ex-ception of significantly increased RD in ASD in the right ILF (F(1,32) = 4.54, p = .041, d = .73).
Four supplementary analyses were performed on the DWI statistics. First, we calculated the DWI statistics only for the center of each tract, revealing reduced FA in ASD in right ILF (F(1,32) = 5.09, p = .031, d =− 0.77), marginally significantly reduced FA in ASD in left ILF (F(1,32) = 4.07, p = .052, d =− 0.69), and increased RD in ASD in right ILF (F(1,32) = 6.61, p = .015, d = 0.88), with all other measures similar for both groups (p > .10). Sec-ond, we calculated weighted DWI averages by weighting each DWI measure at each voxel in the tract by the pathway probability at that voxel. This analysis revealed reduced FA in ASD in right ILF (F(1,32) =.4.58, p = .040, d=− 0.73) and increased RD in ASD in right ILF (F(1,32) = 4.49, p = .042, d = 0.72), with all other mea-sures similar for both groups (p > .098). Third, we reana-lyzed the data of FA of right ILF after excluding two outlying TD subjects (as evidenced in Fig. 1b). This ana-lysis revealed significantly reduced FA of the right ILF in ASD (F(1,30) = 12.40, p = .0014, d =− 1.25), which survives Bonferroni multiple comparison correction for the 18 assessed tracts (α = .05/18). Fourth, we reanalyzed the data of FA of the right ILF after excluding the four left-handed subjects, as handedness may reflect lateralization of lan-guage, which in turn may impact upon lateralization of Table 3 An overview of the Bayes factors (BF) per tract to quantify the replication results [46]. For an explanation of each of these BFs, see the“Statistical analysis” section
Equality-of-effect-size BF Replication BF Fixed-effect meta-analysis BF
R inferior longitudinal fasciculus 3.89 11.56 124.67
L inferior longitudinal fasciculus 2.69 4.45 2.00
R anterior thalamic radiations 1.93 0.95 0.05
L anterior thalamic radiations 2.77 1.00 0.05
R cingulum-angular bundle 0.54 0.26 0.12
L cingulum-angular bundle 4.08 1.00 0.16
R cingulum-cingulate gyrus bundle 3.33 0.97 0.12
L cingulum-cingulate gyrys bundle 2.58 1.11 0.14
R corticospinal tract 4.11 0.83 0.08
L corticospinal tract 1.56 1.15 0.04
R superior longitudinal fasciculus—parietal 3.32 0.89 0.06
L superior longitudinal fasciculus—parietal 3.42 0.73 0.09
R superior longitudinal fasciculus—temporal 2.85 1.07 0.13
L superior longitudinal fasciculus—temporal 3.97 1.02 0.15
R uncinate fasciculus 3.89 0.78 0.10
L uncinate fasciculus 3.81 0.86 0.06
Forceps major (corpus callosum) 4.18 0.87 0.10
face-sensitive areas [48]. This analysis again revealed sig-nificantly reduced FA of the right ILF in ASD (F(1,28) = 6.11, p = .019, d =− 0.90).
As expected, individuals with ASD scored significantly higher on each of the questionnaires assessing ASD characteristics, both for impairments in social communi-cation and interaction and for RRBIs (cf. SRS, RBS-R; see Table 1). These results survive Bonferroni correction, since the p value is smaller than 0.0125 (α = 0.05/4).
Pertaining to the visual measures, individuals with ASD were slower to detect the target in the visual search task, particularly in the high-similarity condition with highly similar target-distractor items (see Table 4). When apply-ing a strapply-ingent Bonferroni correction, this last group dif-ference became marginally significant (α = 0.05/4 = 0.0125), although the effect size was medium to large (d = 0.72). No significant group differences were found on the other visual processing measures (i.e., the Fragmented Object Outlines task, the Coherent Motion task, and the ROCF task) (see Table 4).
Next, we calculated whole-group Pearson correlations between FA of the right ILF and ASD characteristics and between FA of the right ILF and visual processing mea-sures (see Additional files 2 and 3). As both groups were preselected to differ in terms of ASD symptoms, group membership was partialed out from all correlations in-volving ASD characteristics. While lower FA in the right ILF showed a slight association with the presence of more ASD characteristics (SRS total score: partial r(29) =− 0.27, p = .15; SRS Social Communication and Inter-action scale: partial r(29) =− 0.26, p = .17; SRS RRBI scale: partial r(29) =− 0.18, p = .34), none of these corre-lations were significant, and the association only approached significance for the RBS-R questionnaire (partial r(29) =− 0.37, p = .05). Pertaining to the visual measures, lower FA in the right ILF showed a marginally significant association with slower visual search (r(29) = − 0.34, p = .059) and a more part-oriented processing
style as indexed by the fragmentation score on the ROCF (r(30) =− 0.34, p = .05). However, these results did not survive Bonferroni correction (α = 0.006). No associ-ation was observed with coherent motion sensitivity (r(30) =− 0.23, p = .22) or performance on the Fragmen-ted Object Outlines task (r(30) =− 0.23, p = .21). Due to the small sample size, none of these correlations sus-tained in the separate participant groups, except for as-sociations in the ASD sample between lower FA in right ILF and a more fragmented processing style (ROCF: r(15) =− 0.50, p = .04) and a trend towards more RRBIs on the RBS-R questionnaire (r(14) =− 0.46, p = .07). In the TD group, the association with ASD characteristics was substantial but not significant (SRS: r(13) =−.42, p = .12). None of the 17 other white matter tracts showed an association with quantitative ASD characteristics or visual processing measures, except for two tracts: lower FA in the left and right cingulate-cingulum gyrus (CCG) bundle was associated with slower performance on the Fragmented Objects Outline task (r(30) =− 0.43, p = .01 and r(30) =− 0.35, p = .04, respectively) and with slower visual search (r(29) =− 0.45, p = .009 and r(29) = − 0.34, p= .049, respectively) (see Additional file 3). However, none of these associations survived Bonferroni correc-tion (α = 0.006).
Discussion
The literature on neural processing in ASD is extensive and characterized by divergent and inconsistent findings. This partially reflects the characteristic heterogeneity of the disorder [49], but may also be due to the use of sub-optimal analysis approaches and less reliable data quality assessment. A recent study applied state-of-the-art glo-bal probabilistic tractography combined with stringent DWI data quality criteria and found that aberrant struc-tural connectivity in children with ASD may be confined to one specific white matter tract, the right inferior lon-gitudinal fasciculus or ILF [16]. To further consolidate Table 4 Between-group differences for the visual processing measures
ASD (n = 17) TD (n = 17) Group test statistic
p value Cohen’s d
M SD M SD
Fragmented Objects Outline Task (ms)a 4335 1252 4031 919
F = 0.91 .35 0.31
Coherent Motion Task (% coherence) 29 12 24 11 F = 2.02 .17 0.48
Visual search task (ms)b 2075 505 1825 295
F = 2.93 .09 0.52
Low similarityc 1792 421 1677 295
t = 0.72 .47 0.25
High similarityc 2360 634 1973 381
t = 2.51 .017 0.72
ROCF fragmentation score 5.4 2.1 4.2 2.8 F = 1.76 .19 0.46
Note. Since the groups were compared on four tasks, a Bonferroni correction results in a significance level (α) of 0.0125
a
Other effects retained in the model for Fragmented Objects Outline Task: within-subject factors type (F(1,1279) = 13.07, p < .001) and homogeneity (F(1,1279) = 54, p = < .001)
b
Other effects retained in the model for visual search: within-subject factors target-distractor similarity (F(1,1285) = 86.07, p < .001), number of distractors (F(1,1285) = 57.67, p < .001), and the interaction between group and target-distractor similarity (F(1,1285) = 7.68, p = .006)
c
this finding, we replicated the study design of Koldewyn and colleagues [16], by applying an identical analysis ap-proach and identical head motion and DWI data quality matching, in adolescents with and without ASD.
Similar to the findings of Koldewyn and colleagues [16], we found that adolescents with ASD showed re-duced FA in the ILF and not in any of the 16 other white matter tracts. In our study, significantly reduced FA in the right ILF was consistently observed across a number of different analysis approaches and the effect size was large (i.e., d =− 0.82 in the current adolescent sample, as compared to d =− 0.68, in the school-aged sample of Koldewyn and colleagues). Furthermore, the Bayes factor tests provided strong evidence that we replicated the findings of Koldewyn and colleagues [16] and that the observed lower FA value in the right ILF for the ASD group is a true effect. Likewise, in both studies, reduced FA in the right ILF was driven by increased RD in the ASD sample. The particular anatomical location of aber-rant diffusion in ASD coincides with the major cluster of reduced FA across a series of whole-brain DWI studies (as calculated in a meta-analysis [8]) and is also supported by a number of DWI tractography studies [50–52]. Together with findings of reduced functional occipito-temporal connectivity [10], this suggests a dysfunction of the right ILF in ASD.
Contrary to previous studies and reviews [6, 8, 9, 16], we also observed significantly reduced FA in the left ILF (d =− 0.72) in the ASD group. However, this group differ-ence was less consistently observed across different ana-lysis approaches, and—as it was not a priori predicted—it did not survive correction for multiple comparisons. A closer look at the data of Koldewyn and colleagues [16] shows that FA in the left ILF was also significantly reduced in ASD in their original analysis without head motion and data-quality matching. Yet, in the more stringent analysis, the group difference was no longer significant, but still substantial (d =− 0.34). The replication Bayes factor also indicated that the observed lower FA value in the left ILF for the ASD group corresponds to the effect reported by Koldewyn and colleagues [16], rather than showing that the effect is zero. However, according to the fixed-effect meta-analysis Bayes factor, the pooled data of both studies provide indecisive evidence. Taken together, this indicates that the observation of reduced FA in the left ILF is not as robust as in the right ILF and should be interpreted with caution.
Concerning the issue of selective alterations in one particular white matter tract in ASD, it should be noted that our sample was too small to reliably demonstrate the absence of more subtle group differences in white matter properties. To overcome this limitation, we cal-culated the fixed-effect meta-analysis Bayes factor on the pooled data from our study and the study of Koldewyn
and colleagues [16]. This Bayes factor provided strong evidence that the observed lower FA value in the right ILF of the ASD group is indeed a true effect (in fact, based on the findings in both studies, it is 125 times more likely that this effect is truly present instead of ab-sent). For the left ILF, the evidence was inconclusive, but for all other tracts, the meta-analysis Bayes factor clearly suggested that group differences are absent (depending on the tract it is 6 to 23 times more likely that FA values across groups are similar instead of different). Therefore, the combined findings across both studies confirm the presence of alterations in right ILF in ASD and may question the common idea of more widespread alter-ations in white matter in ASD (although they leave us with uncertainty regarding the left ILF).
Additionally, our findings also illustrate the heterogen-eity in white matter properties within the ASD popula-tion (see Fig. 1b), indicating that results of group comparisons should be interpreted with caution. This heterogeneity implies that not every individual partici-pant with ASD has reduced FA in the right ILF, despite the observed group difference. Likewise, for the other tracts, the absence of a group difference in FA does not imply that none of the participants with ASD may show alterations in any of these tracts. Besides heterogeneity at the brain level [49], ASD is also characterized by het-erogeneity at the cognitive level [53] and at the behav-ioral level, as each ASD symptom has a wide range of manifestations [1]. This heterogeneity at different levels stimulates a more dimensional approach to examine the link between alterations in white mater organization and variations in cognition and ASD symptom severity.
The observed alterations in white matter organization can potentially underlie some of the cognitive character-istics of ASD. In this study, we focused on the role of the right ILF in visual processing. According to one of the dominant theories on visual processing in ASD (i.e., the Weak Central Coherence account), individuals with ASD show relatively impaired global integrative process-ing and are more inclined to process and attend to parts or details [24]. Nevertheless, group differences in visual processing are often subtle, and many studies yield in-consistent results with weak effect sizes comparing indi-viduals with ASD versus TD controls [25, 26]. The adolescents of our ASD sample showed reduced per-formance on the visual search task, compared to the TD group. Intact performance was found on the Fragmented Object Outlines task, the Coherent Motion task, and the ROCF. This pattern of results is in line with similar find-ings on the same visual measures in larger samples of in-dividuals with and without ASD [23]. Van Eylen and colleagues [23] demonstrated that group differences on visual processing measures were small and depended on the age and/or sex of the participants. More specifically,
the group difference on the ROCF task was only found in girls and the group difference on the Coherent Mo-tion task was restricted to younger children, thus corre-sponding to the absence of group differences in the current sample of adolescent boys. Generally, these find-ings challenge the claim that individuals with ASD have a general inability to integrate information [23], although the cognitive heterogeneity within ASD should be taken into account when interpreting results.
Reduced brain connectivity has been suggested as the biological mechanism underlying atypical visual process-ing in individuals with ASD [4]. Here, we observed re-duced FA in the right ILF of boys with ASD. As the ILF connects the occipital and the temporal lobe, reduced FA along this tract may impact upon information inte-gration along the ventral visual stream. In line with this hypothesis, we found that lower FA in the right ILF was associated with slower performance on the visual search task and a trend towards a more part/detail-oriented processing style. Ortibus and colleagues [22] previously demonstrated that reduced FA of the ILF was also asso-ciated with impaired object recognition in children with cerebral visual impairment. As expected, FA in the ILF was not associated with Coherent Motion sensitivity, a traditional measure of dorsal visual stream functioning [30]. Contrary to our expectations, no correlation was found between FA in the ILF and performance on the Fragmented Object Outlines task, and no group differ-ence was found on this task, despite the lower FA values in the right ILF of the ASD group. A possible explan-ation is that the Fragmented Object Outlines task targets higher-level top-down visual processing and, thus, does not solely rely on diffusion along the ILF. Therefore, specific alterations of the ILF may only partially deter-mine performance on this task, due to compensation by other brain mechanisms. For example, our data pointed towards a possible involvement of the cingulum-cingulate gyrus bundle (CCG), given the observed asso-ciation between FA in the CCG (bilaterally) and per-formance on the Fragmented Object Outlines task. Low-and mid-level visual processing tasks in which the right ILF plays a more unique role are expected to show a higher correlation with FA in the right ILF and a greater impairment in individuals with ASD.
One cognitive process in which the right ILF is particu-larly implicated is face processing, by interconnecting sev-eral key brain regions (i.e., the occipital and the fusiform face area, the superior temporal sulcus and the amygdala) [6, 18, 54–57]. Impaired (emotional) face processing has repeatedly been described in ASD [19–21] and may im-pact upon social functioning and communication in gen-eral. As a result, disruption of the right ILF may be linked with ASD symptom severity via face processing impair-ments. However, after controlling for clinical status, we
could not observe any reliable associations between indi-vidual differences in FA of right ILF and indiindi-vidual differ-ences in socio-communicative ASD characteristics. On the other hand, there was a marginally significant associ-ation between lower FA of the right ILF and the increased presence of RRBI characteristics as rated on the RBS-R questionnaire, which was entirely driven by the ASD sam-ple. As some of these RBS-R items involve atypical sensory processing and a possible preoccupation with parts of ob-jects, the link with altered ILF properties may be partially mediated by atypical visual processing [27].
Although this study replicated the previously observed reduction in FA in the right ILF in individuals with ASD [16], some limitations should be considered. First, as indi-cated above, by itself, our study was underpowered to dem-onstrate the selectivity of the ILF alterations in ASD, i.e., that only the right ILF and no other tracts may display re-duced FA in ASD. Likewise, the power of our study was limited to demonstrate reliable associations with visual processing and ASD characteristics, especially at the sub-group level. Therefore, larger studies are needed to exam-ine these associations more thoroughly, including the association with face processing abilities. Second, although both our study and the one of Koldewyn and colleagues [16] demonstrated reduced FA in right ILF in adolescents and school-aged children with ASD, respectively, it re-mains to be validated whether this ILF alteration is consist-ently present across the developmental trajectory, thus also at preschool and adult age. It may be particularly relevant to investigate how group differences in diffusion properties of association tracts evolve throughout pubertal develop-ment and how this relates to differences in hormone levels, such as testosterone. In this regards, it has been demon-strated that the development of association tracts, such as the ILF, is influenced by this hormone [58, 59] and that boys with and without ASD have different testosterone levels during puberty [60]. Third, the present study (as well as the one of Koldewyn and colleagues [16]) included a relatively selective subset of participants in terms of IQ (above 80), calling into question to what extent the findings may generalize to the whole ASD spectrum.
In this regard, future research should also investigate how heterogeneity at the behavioral level in the ASD population (in terms of IQ, age, comorbid symptoms etc.) may relate to heterogeneity at the neural level [61]. Future research is also needed to directly examine the hypothe-sized association between structural ILF properties and face processing abilities and to investigate (the directional-ity of ) possible causal pathways linking lower FA in right ILF with ASD symptom severity. A longitudinal investiga-tion of the intrinsic associainvestiga-tion between fine-grained local connectivity patterns and (atypical) functional brain activ-ity in the fusiform face area [62] may be particularly eluci-dating in this regard. Finally, more fundamental research
is needed to pinpoint the exact micro- and macrostruc-tural factors underlying the reduced FA in the right ILF in individuals with ASD and the functional implications in terms of brain connectivity, neural communication, and information transmission.
Conclusion
To conclude, our results replicate the findings of Koldewyn and colleagues [16] and support the growing evidence for altered structural connectivity along the right ILF in ASD, although they leave us with uncertainty regarding alter-ations in the left ILF. Nevertheless, these findings need to be interpreted in the light of the known heterogeneity of the disorder. This heterogeneity calls for a more dimen-sional approach to examine the link between alterations in ILF properties and variations in cognition and ASD symp-tom severity. In that regard, this study suggests that alter-ations in structural ILF properties in individuals with ASD may underlie (at least some of) the visual processing atypi-calities and RRBI characteristics of ASD. To move the field forward, we need large interdisciplinary, multi-dimensional studies that examine inter-individual differences at different levels and the corresponding biological pathways. This will increase our understanding of the links between the brain, cognition, and behavior and will reveal the factors that in-duce, or at least increase the risk for, ASD, but may also elucidate protective factors.
Additional files
Additional file 1: Supplementary R-script. The applied R-script to calculated the three Bayes factor tests, to quantify the result of our replication attempt [46]. (TXT 4 kb)
Additional file 2: Figure S1. Scatter plots displaying the association between individual differences in FA in right ILF (depicted on the X axis) and individual differences in quantitative ASD characteristics and visual processing measures (depicted on the Y axis). First row: Associations with (square root transformed) scores on the SRS questionnaire, the SRS Social and Communication subscale, the SRS RRBI subscale, and the RBS-R questionnaire. Second row: Associations with reaction time on the Fragmented Object Outlines task, (log-transformed) percentage coherence threshold on the Coherent Motion Task, (log-transformed) reaction time on the visual search task, and (square root transformed) fragmentation score on the Rey-Osterrieth Complex Figure task. ASD subjects are depicted by empty squares, TD subjects by filled diamonds. (PPTX 130 kb)
Additional file 3: Table S1. Pearson (partial) correlations between ASD characteristics, visual processing measures and fractional anisotropy (FA) in the white matter tracts. (DOCX 19 kb)
Abbreviations
AD:Axial diffusivity; ASD: Autism spectrum disorder; DFlex: Detail and flexibility questionnaire; DWI: Diffusion-weighted Imaging; FA: Fractional anisotropy; FOV: Field-of-view; ILF: Inferior longitudinal fasciculus; MD: Mean diffusivity; MRI: Magnetic resonance imaging; RBS-R: Repetitive Behavior Scale—Revised; RD: Radial diffusivity; ROCF: Rey-Osterrieth Complex Figure; RRBIs: Restricted and repetitive patterns of behavior and interests; SRS: Social Responsiveness Scale; TD: Typically developing; TE: Echo time; TR: Repetition time; TRACULA: Tracts Constrained by Underlying Anatomy
Acknowledgements
We thank all participating children and their families for their time and effort. We also acknowledge S. Ghosh at the McGovern Institute for Brain Research (MIT), for assistance with the implementation of the FreeSurfer and TRACULA analysis pipelines as well as Claudia Dillen and the master students Karen Van Bouwel and Evelyne Vereecke from the KU Leuven, for their assistance during scanning.
Funding
BB was supported by a postdoctoral fellowship of the Research Foundation Flanders and a visiting researcher grant of Fulbright. LVE was supported by a doctoral fellowship of the Research Foundation Flanders and a postdoctoral fellowship of the M.M. Delacroix Foundation. The research was financed by grants from the Research Council of KU Leuven (IDO/08/013 and StG/15/ 014BF awarded to BB) and a long-term structural funding from the Flemish Government (METH/14/02) to JW. The funding bodies in itself had no role in the design of the study nor in the collection, analysis, and interpretation of data or in writing the manuscript.
Availability of data and materials
The datasets generated and/or analyzed during the current study are available from the corresponding author on reasonable request. Authors’ contributions
BB and LVE collected, analyzed, and interpreted the data and wrote the manuscript. BB took the lead in the conception and design of the imaging part of the study and analyzed the imaging data. LVE took the lead in the conception, design, and analyses of the visual processing measures. KS substantially contributed to the analysis of the imaging data. PM contributed to the Bayesian statistics. IN critically revised the manuscript and provided important intellectual content. JS provided feedback on the draft of the manuscript. SS provided support in the design of the imaging protocol. JW aided with the interpretation of the results and gave detailed feedback on the manuscript. All authors read and approved the final manuscript. Ethics approval and consent to participate
The study was approved by the Medical Ethical Committee of the University Hospitals Leuven (ML4827). Informed consent was obtained from all participants and their parents/guardians according to the Declaration of Helsinki.
Consent for publication Not applicable Competing interests
The authors declare that they have no competing interests.
Publisher’s Note
Springer Nature remains neutral with regard to jurisdictional claims in published maps and institutional affiliations.
Author details
1
Center for Developmental Psychiatry, Department of Neurosciences, KU Leuven, Kapucijnenvoer 7h, PB 7001, 3000 Leuven, Belgium.2Leuven Autism
Research (LAuRes), KU Leuven, 3000 Leuven, Belgium.3Department of Brain and Cognitive Sciences, Massachusetts Institute of Technology, Cambridge, MA 02139, USA.4Speech and Hearing Bioscience and Technology, Division of Medical Sciences, Harvard Medical School, Boston, MA 02115, USA.
5
Laboratory of Experimental Psychology, KU Leuven, 3000 Leuven, Belgium.
6Parenting and Special Education Research Unit, KU Leuven, 3000 Leuven,
Belgium.7Translational MRI, KU Leuven, 3000 Leuven, Belgium.
Received: 10 February 2017 Accepted: 10 January 2018
References
1. American Psychiatric Association. Diagnostic and statistical manual of mental disorders: DSM-5. 5th ed. Washington, D.C: American Psychiatric Association; 2013.
2. Ameis SH, Szatmari P. Imaging-genetics in autism spectrum disorder: advances, translational impact, and future directions. Neuroimaging Stimul. 2012;3:46.
3. Belmonte MK, Allen G, Beckel-Mitchener A, Boulanger LM, Carper RA, Webb SJ. Autism and abnormal development of brain connectivity. J Neurosci. 2004;24:9228–31.
4. Hill EL, Frith U. Understanding autism: insights from mind and brain. Philos Trans R Soc B Biol Sci. 2003;358:281–9.
5. Just MA, Cherkassky VL, Keller TA, Minshew NJ. Cortical activation and synchronization during sentence comprehension in high-functioning autism: evidence of underconnectivity. Brain. 2004;127:1811–21. 6. Ameis SH, Catani M. Altered white matter connectivity as a neural
substrate for social impairment in autism spectrum disorder. Cortex. 2015;62:158–81.
7. Aoki Y, Abe O, Nippashi Y, Yamasue H. Comparison of white matter integrity between autism spectrum disorder subjects and typically developing individuals: a meta-analysis of diffusion tensor imaging tractography studies. Mol Autism. 2013;4:25.
8. Hoppenbrouwers M, Vandermosten M, Boets B. Autism as a disconnection syndrome: a qualitative and quantitative review of diffusion tensor imaging studies. Res Autism Spectr Disord. 2014;8:387–412.
9. Travers BG, Adluru N, Ennis C, DPM T, Destiche D, Doran S, et al. Diffusion tensor imaging in autism spectrum disorder: a review. Autism Res. 2012;5: 289–313.
10. Vissers ME, Cohen MX, Geurts HM. Brain connectivity and high functioning autism: a promising path of research that needs refined models, methodological convergence, and stronger behavioral links. Neurosci Biobehav Rev. 2012;36:604–25.
11. Le Bihan D. Looking into the functional architecture of the brain with diffusion MRI. Nat Rev Neurosci. 2003;4:469–80.
12. Song S-K, Sun S-W, Ramsbottom MJ, Chang C, Russell J, Cross AH. Dysmyelination revealed through MRI as increased radial (but unchanged axial) diffusion of water. NeuroImage. 2002;17:1429–36.
13. Jones DK, Knösche TR, Turner R. White matter integrity, fiber count, and other fallacies: the do’s and don’ts of diffusion MRI. NeuroImage. 2013;73: 239–54.
14. Yendiki A, Koldewyn K, Kakunoori S, Kanwisher N, Fischl B. Spurious group differences due to head motion in a diffusion MRI study. NeuroImage. 2014; 88:79–90.
15. Walker L, Gozzi M, Lenroot R, Thurm A, Behseta B, Swedo S, et al. Diffusion tensor imaging in young children with autism: biological effects and potential confounds. Biol Psychiatry. 2012;72:1043–51.
16. Koldewyn K, Yendiki A, Weigelt S, Gweon H, Julian J, Richardson H, et al. Differences in the right inferior longitudinal fasciculus but no general disruption of white matter tracts in children with autism spectrum disorder. Proc Natl Acad Sci U S A. 2014;111:1981–6.
17. Catani M, Jones DK, Donato R, Ffytche DH. Occipito-temporal connections in the human brain. Brain J Neurol. 2003;126(Pt 9):2093–107.
18. Thomas C, Avidan G, Humphreys K, Jung K, Gao F, Behrmann M. Reduced structural connectivity in ventral visual cortex in congenital prosopagnosia. Nat Neurosci. 2009;12:29–31.
19. Harms MB, Martin A, Wallace GL. Facial emotion recognition in autism spectrum disorders: a review of behavioral and neuroimaging studies. Neuropsychol Rev. 2010;20:290–322.
20. Uljarevic M, Hamilton A. Recognition of emotions in autism: a formal meta-analysis. J Autism Dev Disord. 2013;43:1517–26.
21. Weigelt S, Koldewyn K, Kanwisher N. Face identity recognition in autism spectrum disorders: a review of behavioral studies. Neurosci Biobehav Rev. 2012;36:1060–84.
22. Ortibus E, Verhoeven J, Sunaert S, Casteels I, De Cock P, Lagae L. Integrity of the inferior longitudinal fasciculus and impaired object recognition in children: a diffusion tensor imaging study. Dev Med Child Neurol. 2012;54: 38–43.
23. Van Eylen L, Boets B, Steyaert J, Wagemans J, Noens I. Local and global visual processing in autism spectrum disorders: influence of task and sample characteristics and relation to symptom severity. J Autism Dev Disord. 2015; https://doi.org/10.1007/s10803-015-2526-2.
24. Happé FGE, Booth RDL. The power of the positive: revisiting weak coherence in autism spectrum disorders. Q J Exp Psychol. 2008;61:50–63. 25. Simmons DR, Robertson AE, McKay LS, Toal E, McAleer P, Pollick FE. Vision
in autism spectrum disorders. Vis Res. 2009;49:2705–39.
26. Van der Hallen R, Evers K, Brewaeys K, Van den Noortgate W, Wagemans J. Global processing takes time: a meta-analysis on local-global visual processing in ASD. Psychol Bull. 2015;141:549–73.
27. Brunsdon VEA, Happé F. Exploring the‘fractionation’ of autism at the cognitive level. Autism. 2014;18:17–30.
28. Altmann CF, Bülthoff HH, Kourtzi Z. Perceptual organization of local elements into global shapes in the human visual cortex. Curr Biol CB. 2003; 13:342–9.
29. Grill-Spector K, Weiner KS. The functional architecture of the ventral temporal cortex and its role in categorization. Nat Rev Neurosci. 2014;15:536–48. 30. Braddick O, Atkinson J, Wattam-Bell J. Normal and anomalous development
of visual motion processing: motion coherence and‘dorsal-stream vulnerability’. Neuropsychologia. 2003;41:1769–84.
31. Kaldy Z, Giserman I, Carter AS, Blaser E. The mechanisms underlying the ASD advantage in visual search. J Autism Dev Disord. 2016;46(5):1513—27. 32. Wolfe JM. Visual search. In: Pashler H, editor. Attention. Hove: Psychology
Press; 1998. p. 13–73.
33. American Psychiatric Association. Diagnostic and statistical manual of mental disorders: DSM-IV-TR. 4th ed. Washington, DC: American Psychiatric Association. p. 2000.
34. Skuse D, Warrington R, Bishop D, Chowdhury U, Lau J, Mandy W, et al. The developmental, dimensional and diagnostic interview (3di): a novel computerized assessment for autism spectrum disorders. J Am Acad Child Adolesc Psychiatry. 2004;43:548–58.
35. Roeyers H, Thys M, Druart C, De Schryver M, Schittekatte M. Screeningslijst voor autismespectrumstoornissen: SRS. Amsterdan: Hogrefe; 2011. 36. Roeyers H, Thys M, Druart C, De Schryver M, Schittekatte M. Screeningslijst
voor autismespectrumstoornissen: SRS-2. Amsterdan: Hogrefe; 2013. 37. Yendiki A, Panneck P, Srinivasan P, Stevens A, Zöllei L, Augustinack J, et al.
Automated probabilistic reconstruction of white-matter pathways in health and disease using an atlas of the underlying anatomy. Front Neuroinform. 2011;5:23.
38. Fischl B, Salat DH, Busa E, Albert M, Dieterich M, Haselgrove C, et al. Whole brain segmentation: automated labeling of neuroanatomical structures in the human brain. Neuron. 2002;33:341–55.
39. Fischl B. FreeSurfer. NeuroImage. 2012;62:774–81.
40. Benner T, van der Kouwe AJW, Sorensen AG. Diffusion imaging with prospective motion correction and reacquisition. Magn Reson Med. 2011;66: 154–67.
41. Bodfish JW, Symons FJ, Parker DE, Lewis MH. Varieties of repetitive behavior in autism: comparisons to mental retardation. J Autism Dev Disord. 2000;30: 237–43.
42. SAS Institute Inc. SAS University edition, version 9.4. Cary: SAS Institute Inc.; 2013.
43. Nakagawa S. A farewell to Bonferroni: the problems of low statistical power and publication bias. Behav Ecol. 2004;15:1044–5.
44. Friston K. Ten ironic rules for non-statistical reviewers. NeuroImage. 2012;61: 1300–10.
45. Cohen J. Statistical power analysis for the behavioral sciences. 2nd ed. Hillsdale: Lawrence Erlbaum Associates; 1988.
46. Verhagen J, Wagenmakers E-J. Bayesian tests to quantify the result of a replication attempt. J Exp Psychol Gen. 2014;143:1457.
47. Jeffreys H. Theory of probability. 3rd ed. Oxford: Oxford University Press; 1961.
48. Behrmann M, Plaut DC. Distributed circuits, not circumscribed centers, mediate visual recognition. Trends Cogn Sci. 2013;17:210–9.
49. Lenroot RK, Yeung PK. Heterogeneity within autism spectrum disorders: what have we learned from neuroimaging studies? Front Hum Neurosci. 2013;7:733.
50. Ameis SH, Fan J, Rockel C, Voineskos AN, Lobaugh NJ, Soorya L, et al. Impaired structural connectivity of socio-emotional circuits in autism spectrum disorders: a diffusion tensor imaging study. PLoS One. 2011;6: e28044.
51. Cheon K-A, Kim Y-S, Oh S-H, Park S-Y, Yoon H-W, Herrington J, et al. Involvement of the anterior thalamic radiation in boys with high functioning autism spectrum disorders: a diffusion tensor imaging study. Brain Res. 2011;1417:77–86.
52. Pugliese L, Catani M, Ameis S, Dell’Acqua F, Thiebaut de Schotten M, Murphy C, et al. The anatomy of extended limbic pathways in Asperger syndrome: a preliminary diffusion tensor imaging tractography study. NeuroImage. 2009;47:427–34.
53. Geurts H, Sinzig J, Booth R, Happ F. Neuropsychological heterogeneity in executive functioning in autism spectrum disorders. Int J Dev Disabil. 2014; 60:155–62.
54. Haxby J, Gobbini M. Distributed neural systems for face perception. In: Rhodes, G, Calder A, Johnson M, Haxby J, editors. Oxford Handbook of Face Perception. Oxford: Oxford University Press; 2011.
55. Fox CJ, Iaria G, Barton JJS. Disconnection in prosopagnosia and face processing. Cortex J Devoted Study Nerv Syst Behav. 2008;44:996–1009. 56. Kleinhans NM, Richards T, Sterling L, Stegbauer KC, Mahurin R, Johnson LC,
et al. Abnormal functional connectivity in autism spectrum disorders during face processing. Brain J Neurol. 2008;131(Pt 4):1000–12.
57. Rudrauf D, David O, Lachaux J-P, Kovach CK, Martinerie J, Renault B, et al. Rapid interactions between the ventral visual stream and emotion-related structures rely on a two-pathway architecture. J Neurosci. 2008;28:2793–803. 58. Herting MM, Maxwell EC, Irvine C, Nagel BJ. The impact of sex, puberty, and
hormones on white matter microstructure in adolescents. Cereb Cortex. 2012;22:1979–92.
59. Menzies L, Goddings A-L, Whitaker KJ, Blakemore S-J, Viner RM. The effects of puberty on white matter development in boys. Dev Cogn Neurosci. 2015;11:116–28.
60. Croonenberghs J, Van Grieken S, Wauters A, Van West D, Brouw L, Maes M, et al. Serum testosterone concentration in male autistic youngsters. Neuro Endocrinol Lett. 2010;31:483–8.
61. Happé F, Ronald A, Plomin R. Time to give up on a single explanation for autism. Nat Neurosci. 2006;9:1218–20.
62. Saygin ZM, Osher DE, Koldewyn K, Reynolds G, JDE G, Saxe RR. Anatomical connectivity patterns predict face selectivity in the fusiform gyrus. Nat Neurosci. 2012;15:321–7.
• We accept pre-submission inquiries
• Our selector tool helps you to find the most relevant journal • We provide round the clock customer support
• Convenient online submission • Thorough peer review
• Inclusion in PubMed and all major indexing services • Maximum visibility for your research
Submit your manuscript at www.biomedcentral.com/submit