APPLICATION OF LEAN MANUFACTURING TECHNIQUES FOR THE DESIGN OF THE AIRCRAFT ASSEMBLY LINE
by
Victoria Elena Gastelum
B.S. Mechanical Engineering, CETYS Universidad, 1994
Submitted to the Sloan School of Management and the Department of Mechanical Engineering in partial fulfillment of the requirements for the degrees of
MASTER OF SCIENCE IN MANAGEMENT and
MASTER OF SCIENCE IN MECHANICAL ENGINEERING at the
MASSACHUSETTS INSTITUTE OF TECHNOLOGY June 2002
© Massachusetts Institute of Technology. All rights reserved.
Signature of Author
May 8, 2002 MIT Sloan School of Management Department of Mechanical Engineering Certified by
Rof/Welsch, Thesis Advisor Professor of Statistics and Management Science Sloan, chool of Management Certified by
Deborah S. Nighting;le, ThesiVAdvisor Professor of Aeronautics & Astronautics and Engineering Systems Division Accepted by
Dr. Daniel Whitney ior Research Scientist C-atdej for Technology j ey anlIdustrial Developments Accepted by
1argaret''Andrews, Director of MEI&r'r Program -,iMauchool of Management Accepted by
ProfessoeA1riSiin, Chairinan, Graduate Committee RMMAACUSETT$ INSTITUTE Department of Mechanical Engineering
OF TECHNOLOGY
Application of Lean Manufacturing Techniques for the Design of the Aircraft Assembly Line
by
Victoria Elena Gastelum
Submitted to the Sloan School of Management and the Department of Mechanical Engineering in partial fulfillment of the requirements for the degrees of
Master of Science in Management and
Master of Science in Mechanical Engineering
ABSTRACT
The final assembly line for the Boeing Commercial Airplanes 717 Program is currently implementing "The 9 Tactics", a methodology based on the lean manufacturing principles to transform the current processes to continuous moving lines. The first two tactics, Value Stream Mapping and Balancing the Line define the manufacturing system configuration (the quantity of airplanes to load in the conveyor, headcount and workload per workstation) and the process to develop the production execution plans.
Understanding of the tradeoffs in the allocation of resources when selecting the most profitable manufacturing system configuration is a complex task for the Industrial Engineering department. The preparation of these plans is iterative and time-consuming, complicated by constraints such as assembly sequences and space limitations.
The problem solved during the internship was to propose a methodology or framework for the implementation of the Value Stream Mapping and Balancing the Line tactics, considering the economics involved and the frequent production fluctuations in the production rate.
The framework proposed is based on lean techniques and economic analysis, and is
the main product delivered to the sponsor company. The economic analysis of the
assembly line configuration alternatives is supported by the application of the Economic Profit financial metric (also known as Economic Value Added).
Thesis Advisors
Roy Welsch, Sloan School of Management
Deborah S. Nightingale, Department of Aeronautics and Astronautics and Engineering Systems Division
TABLE OF CONTENTS
ABSTRACT ... 3
TABLE OF CONTENTS...5
LIST OF FIGURES AND TABLES...9
ACKNOWLEDGEMENTS...11
EXECUTIVE SUMMARY... 13
I. BACKGROUND...17
Boeing Commercial Airplane Group Approach to the Lean Philosophies...17
BCAG Managing for Value and Economic Profit ... 23
717 C urrent Challenges... 26
T h is T h esis ... 2 7 II. PROBLEM STATEMENT AND APPROACH...29
Problem D efinition ... 29
Approach to Solve the Problem ... 30
Comparing Results and Benchmarking Exercise ... 32
N ext C hapters... 32
III. CURRENT VALUE STREAM MAP PREPARATION...35
V alue Stream M apping ... 35
Current Value Stream Map Construction...36
Results of the Current VSM Exercise ... 40
IV. ASSEMBLY LINE CONFIGURATION SELECTION ... 41
In tro du ction ... 4 1 Project's Economic Analysis: Expanding the Capabilities of Boeing's EPC...44
V. ADJUST THE CURRENT VSM TO THE NEW CONFIGURATION...55
In trodu ction ... 55
A pp ro ach ... 55
Cockpit AIW (Accelerated Improvement Workshop)...56
Results of the Adjusting Exercise ... 59
VI. BALANCE RESOURCES ACROSS THE LINE...61 In troduction ... 6 1
Practical Solutions for Balancing Across the Line ... 64
Results...67
VII. PRODUCTION PLAN PREPARATION... 69
Introduction...69
Axiom atic Design Application... 70
Results...75
VIII. BALANCE CO NTR OL ... 77
Introduction...77
Crew Perform ance to Goal Index...78
Results ... 84
IX. BENCHMARK TO THE 757 PROGRAM...85
Introduction...85
1 -Current Value Stream M ap Preparation...85
2-Assem bly Line Configuration Selection... 88
3-Adjust the Current Value Stream Map to the New Configuration ... 88
4-Balance W ork A cross the Line ... 89
5-Production Plan Preparation ... 89
6-Balance Control ... 89
Results ... 90
X . NEXT STEPS...91
Current V alue Stream M ap M aintenance...91
Better Integration of the Lean-Finance ... 91
The Tool Developed and EPC Upgrades ... 92
JRD and Tim ePiece" Im plem entation ... 92
Test the Effectiveness of the Procedure ... 92
Deploy the M etric ... 93
XI. CONCLUSIONS... 95
The Proposed Fram ework ... 95
The Econom ic Analysis Tool and Lean... 96
Assem bly Line Configuration Tradeoffs and Lean... 97
Use of Heuristic Techniques ... 101
REFERENCES...103
Appendix 1: The 9 Tactics to Improve Operational Efficiency ... 105
Appendix 2: Economic Analysis Tool Screens...109
Appendix 3: Balancing Across the Line Procedure...112
Appendix 4: Axiomatic Design theory ... 115
Appendix 5: Methodology Proposed to Improve and Standardize Administrative Processes:...117
LIST OF FIGURES AND TABLES
Figure I-1: Boeing Production System...20
Figure 1-2: The 9 Tactics to Convert to a Continuous Moving Line ... 22
Figure 1-3: Managing for Value Concept...24
Figure 1-4: Economic Profit Calculation... 24
Figure 1-5:Managing for Value ... 25
Figure 11-1: Problem D efinition ... 29
Figure 11-2: Approach to the Internship Problem... 31
Figure 11-3: Proposed Framework...32
Figure 111-1: Current Value Stream Map Integration...37
Figure 111-2: Current VSM Construction and Analysis...38
Figure 111-3: Condensed Version of the Current VSM ... 39
Figure IV-1: Configuration Selection Using the Tool ... 45
Figure IV-2: 717 Operating Costs Analysis Results... 48
Figure IV-3: Calculation of Total Cost for the 717 Assembly Line ... 49
Figure IV-4: Linear Conceptualization of Lean Techniques ... 51
Figure IV-5: Potential Interactions Between the Lean Techniques and Parameters...52
Figure IV-6: Measuring Improvement for Different Types of Projects...53
Figure V -1: C ockpit Zones... 56
Figure V-2: Cockpit Space Usage for the Current VSM ... 56
Figure V-3: Cockpit AIW Teamwork...57
Figure V-4: Cockpit Space Usage After the AIW ... 60
Figure VI- 1: Idealized Man Load Distribution ... 62
Figure VI-2: Bell Shaped Man Load Distribution ... 63
Figure VII- 1: Balancing the Resources within the Position (fictitious data)...70
Figure VII-2: Design Matrix for Original Sequence... 72
Figure VII-3: Process Re-sequenced...73
Figure V II-4: Final Sequence... 74
Figure VIII-1: Example of EG Distribution for a Position...80
ACKNOWLEDGEMENTS
I wish to acknowledge:
My dear husband Jesus, you are the most important person in my life. Thank you so much for your support during the past two years at school. I couldn't have done it without you.
My mom, who instilled the thirst for continuous improvement in me, and taught me endurance and perseverance to achieve my dreams; my dad, who gave me the passion for learning; my brother Rafa, for his unconditional love.
The Leaders For Manufacturing program for the support and resources made available for my success.
Professors Debbie Nightingale, Roy Welsch and Dan Whitney for your advice and for guiding my thesis to completion.
Robert Stanger for your guidance and support-you made my six months at Boeing an enjoyable learning experience.
The Industrial Engineering team at the 717 program, specially Pete Mitchell, Brad Kraft, Mark Deramo, Dick Schauer, Rick Midland, and Paul Dejeu, whose support was key in shaping the internship project and ultimately this thesis.
James Fitzmartin, Linda Weldon, Brian Metzger, for readily providing me with the resources to achieve the milestones of the project, and in general to the 717 team, for making my transition to work in a different country smooth and joyful.
My friends from the LFM program-I never would have graduated without your friendship and support.
EXECUTIVE SUMMARY
The final assembly line for the Boeing Commercial Airplanes 717 Program is currently implementing "The 9 Tactics", a methodology based on the lean manufacturing principles to transform the current processes to continuous moving lines. The first two tactics, Value Stream Mapping and Balancing the Line define the manufacturing system configuration (the quantity of airplanes to load in the conveyor, headcount and workload per workstation) and the process to develop the production execution plans.
Understanding of the tradeoffs in the allocation of resources when selecting the most profitable manufacturing system configuration is a complex task for the Industrial Engineering department. The department is also required to utilize Boeing's standard method to calculate the profitability of a project, the "Economic Profit" calculation (EP =
net operating profit after taxes - opportunity costs of the assets used). Once the system configuration is selected, the next step for the Industrial Engineers (IE's) is to Balance the Line or evenly distribute the resources via production execution plans or "bar charts" to meet the production requirements. The preparation of these plans is iterative and time-consuming, complicated by constraints such as assembly sequences and space limitations. The process for balancing the line is not standardized and each IE prepares the plans based on his/her experience. For every production rate change, the IE department develops a new assembly line configuration and the corresponding production execution plans. The 717 Program has experienced several rate breaks (production rate changes) during its 2 years in operation and more fluctuations are expected for the future.
The problem solved during the internship was to propose a methodology for the implementation of the first two tactics, Value Stream Mapping and Balancing the Line, considering the economics involved and the frequent production rate breaks.
The following activities are the core elements of the proposed framework:
" A current VSM was constructed using a heuristic approach, analyzing the sequence of only the critical activities. The manufacturing lead time for the assembly line resulting from this analysis was immediately used by the 717 Program management to plan the next production rate slowdown.
" The selection of the optimal assembly line configuration was supported by a spreadsheet tool that calculates the operating costs and costs of capital charge (opportunity costs of the assets used) for different assembly line configurations
and relates this information to Boeing's EP analysis. With this tool
management now has a clear understanding of the tradeoffs in the allocation of the resources for the final assembly line. The tool showed that at low production rates, the resulting optimal configurations have long manufacturing lead times, counterintuitive to the lean manufacturing teachings.
" The future VSM was developed by multidisciplinary teams with employees from production, industrial engineering, quality assurance, lean manufacturing, etc. who re-sequenced the current VSM jobs to the allotted time from the new
configuration. This methodology, called "Sequence Workshops" was
practically applied to re-sequence the current VSM jobs performed in the airplane's flight deck.
" By design, the bar charts balance the use of the resources to the customer requirements. The sequence of steps to prepare the bar charts was optimized or de-coupled using Axiomatic Design. The optimized sequence was standardized in a procedure for further Industrial Engineer's training. This procedure also describes the practices to continuously improve the bar chart's effectiveness on balancing the resources.
The key lessons learned are:
* The application of lean manufacturing techniques
manufacturing systems and production execution
understanding of the economic tradeoffs in the allocation result in designs and plans that will sub-optimize the business.
in the design plans without of the resources
profitability of
* The EP analysis assists the Industrial Engineering activity in understanding the sensitivity of the operating costs and the capital charge to the bottom-line results when selecting from manufacturing system design alternatives.
* Heuristic approaches rather than sophisticated and costly software must be applied when the problems are complex and the planning resources scarce.
of an can the
I. BACKGROUND
The 717 Program
After the McDonnell Douglas - Boeing merger in 1997, the original McDonnell-Douglas MD-95 program was renamed to the 717 Program for the Boeing Commercial Airplanes Division.
The Boeing Commercial Airplanes' 717 Program serves the regional airlines market with a 106-passenger airplane, the 717-200. The 717 Program started customer deliveries in 1999, and since then the 717-200 has had the highest reviews in its class in performance (reliability, fuel efficiency, passenger comfort) by its customers.
The economic health of a commercial airplane program is very sensitive to the market demand, due to the high fixed operating costs. The forecasted customer orders for the 717 Program to date have not reflected the original market projections. Consequently, since the beginning of its operations, the 717 Program has struggled to survive Boeing Commercial Airplane Group (BCAG) financial assessments about the continuity of the program.
Given the financial pressures at the time this thesis was written (January to April, 2002), the 717 Program operates under a continuous cost reduction strategy. Part of this strategy is to be at the vanguard of the implementation of Lean Manufacturing initiatives for cost reduction.
Boeing Commercial Airplane Group Approach to the Lean Philosophies
The Lean principles at the Boeing Commercial Airplanes Group (BCAG) are explained in a clear, simple language that every employee can understand (Reference 1).
Lean is defined by Boeing as "a set of principles, concepts and techniques designed to eliminate waste and produce an efficient just-in-time production system that will deliver to customers exactly what they need, when they need it, in the quantity they need, in sequence, and without defects... applying Lean practices is one way to reduce costs, improve performance and create value for the company".
Two Concepts
The two principal pillars that support Boeing's Lean Production System are the concepts of just-in-time (JIT) and Jidoka (Japanese word for "error-free production"). They are explained below, in Boeing's terms:
JIT: simply means that you get what you need, where and when you need it. The power of JIT lies in what it can do for the bottom line. Having materials arrive at the factory in time to enter the production process allows a company to minimize the amount of inventory it must hold and store-a costly activity. By reducing the overall flow time of our product, we can reduce many of the associated costs of production, such as inventory holding costs.
Jidoka or error-free production: We can achieve high quality, error-free production by doing three things: stop production anytime a defect is detected, design reliable processes and machinery to prevent defects from occurring in the first place, and separate human work from machine work so that machines do the repetitive and dangerous tasks, while people perform the work that requires decision-making and problem-solving skills. By continuously driving out the waste of imperfection and improving the quality of our products, we can eliminate the amount of time and money spent on rework, scrap and lost production time.
Three Key Principles
Boeing also proposes that Lean is based in three key principles:
TAKT Paced Production: it describes the rate of assembly in a factory. Lean does not mean doing things faster; it means doing them at the right pace. Essentially, the customer's rate of demand establishes the pace or TAKT time (TAKT is a German word that means interval of time or rhythm). Rather than a race, Lean sets the pace in the
factory, ensuring that the customer's needs are met on time.
One-Piece Flow: it is the opposite of batch production. Instead of building many products and then holding them in queue for the next step in the process, products go
through each step in the process one at a time, without interruption. Producing a product one at a time continuously improves quality and lowers costs.
Pull Production: it is the opposite of push and means products are made only when the customer has requested them, and not before. Doing so prevents building products that are not needed.
The application of those principles will lead Boeing to faster customer response, higher product quality, more efficient use of space, and lower costs.
The Techniques and their Interaction with the Concepts and Principles:
The Boeing Lean Production System is an application of the existing Lean Manufacturing/ Lean Enterprise literature available: the Japanese concepts from Ohno (Toyota Production System, Reference 2), Hirano (JIT, visual workplace concepts, Reference 3), etc., the American studies in lean performed by Womack and Jones (Lean Thinking, Reference 4), Rother and Shook (Learning to see, Reference 5), Massachusetts
Institute of Technology's Lean Enterprise Initiative (Reference 6), etcetera.
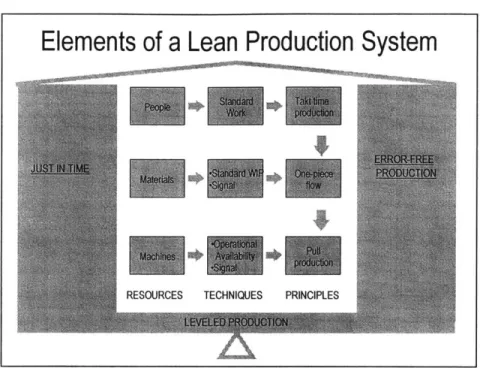
These concepts and principles are put into practice by applying a number of techniques such as standardizing work, using visual signals, defining standard work-in-process, etc. to the three principal resources: people, materials and machinery. Figure I-1 is one graphic representation of the interaction of the different elements of the Boeing Lean Production System. In Boeing's terms:
"In a Lean production system, the right resources and the right tools must be applied to achieve three key Lean principles. For instance, you need people using standard work to produce a product at a pace that matches the rate of customer demand-TAKT time. You also must know the standard quantity of materials you need to keep everyone in the process operating, and you need a signal which can tell you to "build one more" in order to achieve one-piece flow. And you must have machines available when you need them, and again, a signal to tell you when there's a problem".
Figure I-1: Boeing Production System
Value Stream Map
BCAG uses the Value Stream Map methodology developed by Rother and Shook in their book "Learning to See" (Reference 5) to graphically represent the current state of the process analyzed and to determine the desired (future) state after the implementation of
a project. From Boeing's literature:
"Developing a Lean enterprise means looking at the processes inside and outside our factory doors and applying the contributions of our employees at strategic points in what is known as the value stream. Airplane production can be seen as a steady stream of interconnecting processes. A value stream describes the entire set of activities necessary to create and produce a product from detail design through production, delivery and
post-delivery support. Each part of our enterprise-marketing, sales, engineering,
manufacturing, customer services, our suppliers and our suppliers' suppliers-must be lean for the entire enterprise to be lean."
Elements of a Lean Production System
Employee Empowerment and Communication
BCAG conveys a strong message of the benefits to the employees and the role they play in the implementation of the Lean enterprise (Reference 1):
"A Lean enterprise depends on all employees who are empowered to challenge and change existing processes. Boeing relies on you, the people who work with the processes and products every single day. Your ideas and expertise in identifying and removing the waste in our engineering, manufacturing and support processes are essential".
"A Lean enterprise benefits everyone in the value stream. Shareholders get increased profits and share value because of reduced waste. Customers and suppliers gain through partnership with lean companies by increasing their own value, reducing cost, and increasing profitability. Most importantly, you gain through empowerment, because those closest to the work make the improvements. The result is a stronger company, which means growth, and ultimately, better job security. And, through the Share Value program,
you will also see gains associated with stock price increases."
Teamwork
The Boeing Company has established several standardized approaches to teamwork, each designed to achieve the type of improvement desired (Reference 1).
For incremental continuous improvement, it is suggested to conduct accelerated improvement workshops (AIW's), which are Kaizen-like events (Reference 7) that combine training, planning, and implementation to make rapid improvements on the factory floor. During an AIW, managers have the responsibility to empower employees to make significant changes to work procedures, work rules, machines, and the flow of the work.
Other types of teamwork are: the autonomous maintenance workshops (AMW) focused on giving the responsibility to the operators and the maintenance personal for the daily care and critical component checks of their equipment; the distribution workshops, to improve the flow of material and information between the suppliers and the factory; the
production preparation process workshops, to achieve major improvements in the design of parts, equipment, and process.
9 Tactics to Convert to a Moving Line and to Improve the Operational Efficiency
The 9 tactics represent a practical application of Boeing's lean manufacturing concepts, principles and techniques to meet the ultimate goal of implementing a continuous moving line for the aircraft's final assembly manufacturing system (Reference 1).
The 9 Tactics
TACTIC Iz
Value Stream Mapping
TACTIC 2
Balance the Line
-VALUE STREAM MAPPING:
-Define njor processes that determine flow time -Define nmajor sequences ofprocesses that affect flow time
-BALANCE THE LINE:
the assembly ased on takt time
IC 7 pport TACTIC 8 Pulse Line TACTIC 9 Moving Line
Figure 1-2: The 9 Tactics to Convert to a Continuous Moving Line
9 Tactics programs are currently in the process of implementation for the 717, 737, 747, 757, 767, and 777 Programs (See Figure 1-2). See also Appendix 1 for a description of each of the 9 Tactics.
Standard Work -Evenly distribute work across span with job assignments b -Optimize flow time
Visual Controls TACTIC 5 Point of Use TACTIC 6 Feeder Lines TACTI DFM / Su
From Boeing literature for the 9 Tactics: "The Boeing's 9 Tactics represent an approach that can be used in a manufacturing environment to increase efficiency and the ability to manage for value. Although each tactic can provide immediate benefits to an organization, it is the integration of these tactics with the quality system, business plans and supply chain that will provide the greatest benefit to the Boeing enterprise and its employees".
BCAG Managing for Value and Economic Profit Managing for Value
Managing for value is the decision-making process BCAG wants its employees to follow to evaluate all business decisions: from big decisions as the reconfiguration of the assembly line, to small decisions as the rearrangement of tooling in the work area.
Boeing describes this process as follows (Reference 8):
"In its simplest sense, Managing for Value is a decision making process that can be applied to all business decisions- big or small. When faced with multiple options, employees should choose the one that generates the most value as measured by economic profit over the long term. By maximizing economic profit over time, Boeing will provide excellent returns to shareholders, new and innovative products and services for customers, and a secure future for employees.
This process will be used to determine what business opportunities to pursue, what new products and services to offer, and the long-range strategy of the company. It can also be used to make day-to-day decisions. Choices that help improve quality, speed up cycle time, or reduce cost and inventory all add value.
These choices can include rearranging the tools in the work area to streamline production processes, standardizing the computing and telephone equipment in your office, or eliminating variations in processes the work teams use every day.
The goal is to make Boeing one of the top-performing companies in terms of shareholder returns, customer satisfaction, and employee satisfaction" (see Figure 1-3).
Figure 1-3: Managing for Value Concept
Economic Profit
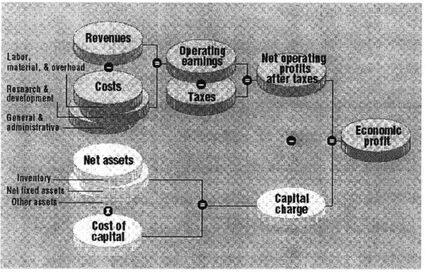
As stated above, Boeing employees should choose the project/decision that generates the most value as measured by economic profit over the long term (Reference 8). The Economic profit measurement is defined as the financial measure net operating profits after taxes (NOPAT, also known as net income) minus the Capital Charge (net assets times the cost of capital, see Figure 1-4).
Boeing also argues that:
"Every organization within Boeing influences costs, the company's use of assets, or the company's revenues. The Economic Profit formula helps the employee to see how his or her organization contributes to the company's overall financial health.
Unlike traditional ways of measuring profit, this formula takes into account a capital charge-that is, how much money Boeing spends on assets (such as facilities, tooling, computers, and inventory) to build products, provide services, and generate sales. If the money generated exceeds the cost of assets, then the particular product or program creates value for the company. If not, then the product or program destroys value".
How the Managing for Value Concept Relates to Economic Profit:
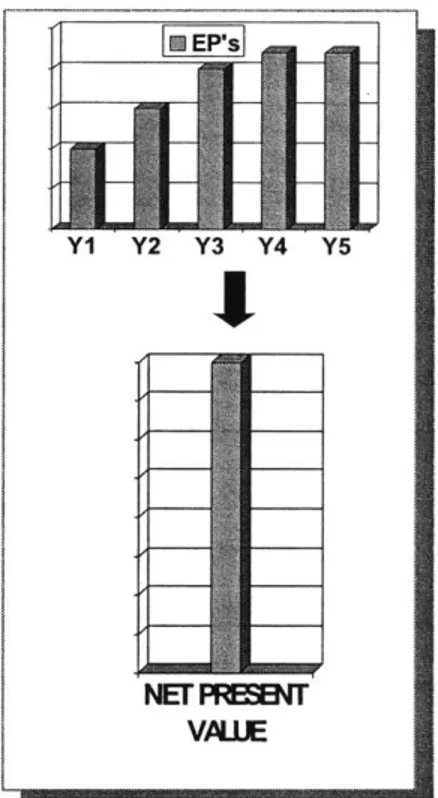
Boeing explains that economic profit is the best single-period financial measure, but relying on it alone can lead to short-term focus on decision-making. When evaluating long-term strategic decisions, Boeing proposes the "value creation" as the appropriate measure. Value creation is the sum of discounted economic profit over time, in a determined time horizon.
Economic profits for each year are discounted at the company's weighted average cost of capital to account for the time value of money (see Figure 1-5).
As the sum of strategy's economic profits over time, value creation is the appropriate criterion for evaluating strategic decisions.
Y1 Y2 Y3 Y4 Y5
NET PREEN VPLLE
717 Current Challenges
These are the current challenges the 717 Program is facing:
Rate Fluctuations: The 717 Program has experienced several rate breaks (production rate changes) during its two years in operation and more fluctuations are expected for the future. The program historically has responded to those disruptions by assessing the economic performance of the current assembly system and deciding if a new manufacturing system configuration (defined principally by the quantity of airplanes to load in the conveyor or positions, the headcount, and the workload per workstation) is necessary.
Cost Reduction: as explained before, the program's strategy is centered in cost reduction. The understanding of the tradeoffs in the allocation of resources for the new assembly line configuration (positions, headcount and workload per workstation, number of operating shifts, etc.) given a rate break is a complex task for the 717 Program management, more specifically to the Industrial Engineering department. The department, as all the other organizations within the Boeing Company, is required to utilize Boeing's standard method to calculate the profitability of a project, the "Economic Profit" calculation (EP = net operating profit after taxes -opportunity costs of the assets used).
9 Tactics implementation: The final assembly line for the Boeing Commercial Airplanes 717 Program is currently implementing "The 9 Tactics", a methodology based on the lean manufacturing principles to transform the current process to a continuous moving line (see Appendix 1 for definition of the 9 Tactics). The 717-200 is currently assembled while traveling on a continuous moving line.
This Thesis
The original internship project statement proposed by the sponsor company was to "work on the implementation of the 9 tactics for the 717 Program in Long Beach, California". After a period of the intern's getting acquainted with the organization, participating in a Lean Manufacturing Assessment exercise and taking Boeing's lean manufacturing courses, the intern and the supervisor agreed to focus the internship on the
implementation of the first two of the 9 Tactics.
Tactic 1, Value Stream Mapping (VSM) and Tactic 2, Balancing the Line (BL), were selected as the focus of the internship because they have the highest impact in the design of the assembly line. They define the manufacturing system configuration and the process to develop the production execution plans. VSM defines the major processes that determine flow time, and the major sequences of processes that affect flow time. BL evenly distributes the work across the assembly span with job assignments based on TAKT time; it also looks for an optimization on the span time or manufacturing flow time. See Appendix I for the methodology proposed by Boeing to implement Tactics 1 and 2.
Giving the magnitude of the economics involved in the design of a production system as large as the airplane final assembly, the implementation of these tactics must be necessarily supported by an economic analysis.
II. PROBLEM STATEMENT AND APPROACH
The LFM internship project must have the potential for developing new knowledge, be intellectually and technically challenging, generate generic and specific engineering and management results for the project and thesis, and support research activities that are critical to participating companies and to the LFM Program. At the same time the project must have a significant impact, meeting a need of the host company.
Problem Definition
The problem was defined as "Propose a methodology for the implementation of the first two tactics, Value Stream Mapping and Balancing the Line, to the final assembly line, considering the economics involved and the frequent production rate breaks."
The problem can be further described as the formula depicted in Figure II-1:
Problem Definition
9 TacticsTACTIC I
TACTIC 2 Balne the Une
+
Manufacturing System Design
+
The first component of the formula is the implementation of the first two tactics. As explained in the Background (Chapter 1), these first two tactics define the configuration of the manufacturing system. The second component, the production rate fluctuations, explains the fundamental need for the project: given a rate fluctuation, the first two tactics might be applied to reconfigure the line. The economics involved with the re-configuration constitute the third element.
These three elements are blended together in the project to define a methodology for the design of the Manufacturing System that will deliver the highest profitability to the 717 Program.
Approach to Solve the Problem
From the problem statement, it was decided that the main product of the internship was the proposal of a framework and specific guidelines for the design of the manufacturing system that contributes the most to the profitability of the 717 Program final assembly line. The framework will integrate the practical application of the first two tactics, an economic analysis, teamwork, and literature research of the lean concepts.
The methodology proposed will assist the different participants in the manufacturing design process -Operations Management, Finance, Supplier Management and the Leadership team- in understanding the role of the design of the manufacturing system in the bottom-line results.
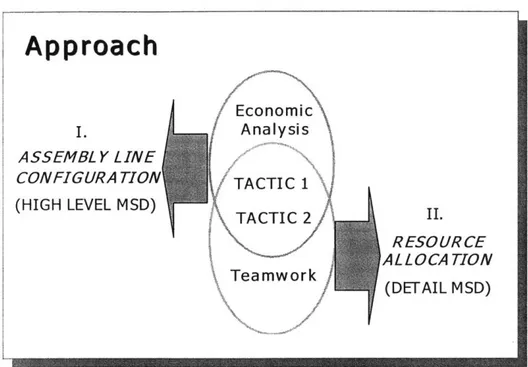
The internship project was divided into two main components: the Assembly Line Configuration (or High Level Manufacturing System Design (MSD)), and the Resource Allocation (or Detail on the MSD). Figure 11-2 depicts how these two components relate to Tactic 1 and Tactic 2. The figure also explains that an economic analysis is required for the Assembly line configuration part of the project, and that strong teamwork is required for the Resource Allocation part of the project.
Approach
I. ASSEMBLY LINE CONFIGURA TION (HIGH LEVEL MSD) Economic Analysis TACTIC 1 TACTIC 2 TeamworkN
f
II. RESOURCE A L LOCA TION (DETAIL MSD)Figure 11-2: Approach to the Internship Problem.
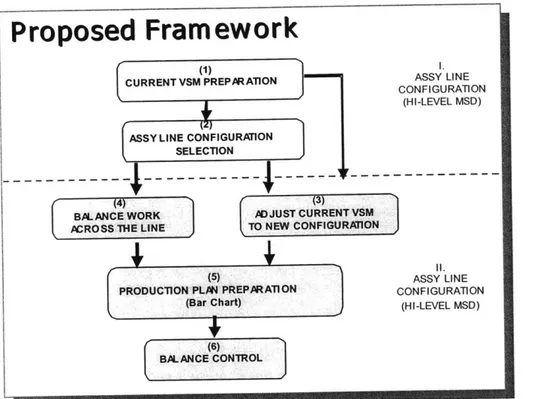
Figure 11-3 shows the proposed framework to solve the problem, which translates the two main components of the project to specific activities or subprojects.
This framework evolved through the internship to this final state. The next chapters will explain in detail the methodologies, techniques, and lean concepts applied to these specific activities, and how this application supports or refutes the hypothesis statement.
Parallel with the development of the framework, the lean techniques applied will be analyzed to understand their applicability in defining the 717 final assembly manufacturing system, and to assess the potential dangers to the interpretation of the techniques in an economic/financial context.
Proposed Framework
(1) 1.
CURRENT VSM PREPARATION ASSY LINE
CONFIGURATION (HI-LEVEL MSD)
4( 3
ASSY LINE CONFIGURATION SELECTION
(4) 1(3)
BAL ANCE WORK ADJUST CURRENT VSM
ACROSS ThE LINE TO NEW CONFIGURA'lON
(5)
PRODUCTION PLAN PREPARATION (Bar Chart) (6) BALANCE CONTROL 11. ASSY LINE CONFIGURATION (HI-LEVEL MSD)
Figure 11-3: Proposed Framework
Comparing Results and Benchmarking Exercise
During the internship the program experienced a production slowdown. The
optimal solution for this rate break generated by the framework proposed was tested against the actual decisions taken by the program. Also, the methodology proposed was benchmarked to other Boeing commercial airplane program to validate the application of the proposed framework in a different manufacturing location.
Next Chapters
The next six chapters (from III to VIII) are structured following the flow from the top to the bottom of the framework of Figure 11-3. Each chapter deals with one element of the framework: the current value stream map preparation part of the project ("1" in Figure 11-3), the assembly line configuration selection process (2), the adjustment of the current
value stream map to the new configuration (3), the process of balancing the resources across the assembly line (4), the production plan preparation activities (5) and finally the balance control part of the project (6).
Chapter IX describes a benchmark exercise performed on the 757 Program, and Chapters X and XI discuss the next steps and conclusions of the project respectively.
III. CURRENT VALUE STREAM MAP PREPARATION Value Stream Mapping
VSM Definition
The construction of a current Value Stream Map (VSM) is the first step in the definition of a Lean project. The current state VSM provides a graphic representation of the current state of the process to be analyzed, and the baseline to which the project improvements will be measured against (Reference 1).
Also the VSM methodology helps to identify:
" the opportunities for improvement, or the "waste" (complexity, labor, overproduction, space, energy, defects, idle materials, etc.) associated with the process,
" the major processes that determine flow time, and
" the major sequences of processes that affect flow time, and the main constraints on the process.
Depending on the project's objectives, different formats can be used to develop a current VSM with the same result: to provide a graphic representation of the current state of the process to be improved.
VSM Application to the Project
The first activity during the internship was to define a methodology to construct the current final assembly VSM utilizing a scarce resource for the 717 Program, Industrial Engineering labor time. The methodology proposed must be practical and flexible to support the frequent production rate fluctuations the Program has historically been experiencing.
At the beginning of the internship, the assembly line configuration for the next production slowdown to materialize four months later was already defined. This new configuration required the increase of the number of flow days of production, and the
reduction of the number of operating shifts to one. The new configuration required a 46% reduction of the minimum flow time in consecutive hours.
Nevertheless, the complete precedence network for all the jobs or tasks required for assembling the 717 airplane was unknown, and consequently the critical path (or minimum flow time in consecutive hours) was also unknown. Previous attempts to develop the complete precedence network (of more than 3,000 tasks) were unsuccessful. This critical path was suspected to be substantially smaller than the current scheduled hrs, as slack between tasks was built in the current schedule.
As it was uncertain if the current critical path (with an unknown number of flow days) would support the new assembly line configuration, one of the most important outcomes of the VSM construction was to determine that minimum flow time, necessary for Industrial Engineering department and the Operations Management to assess the feasibility of the one-shift configuration.
Current Value Stream Map Construction
CPM versus Heuristics
The minimum flow time required to assemble an aircraft can be found by applying the Critical Path Method (CPM, or critical path analysis, see Reference 9). CPM searches the shortest path of all the possible paths in the network of all the sequenced jobs. The CPM was also an infeasible approach for the internship because the resources required would extend beyond the 6 months of the internship. Therefore it was decided to take a heuristic approach to build the VSM.
Heuristic Approach
A heuristic approach is used when the problem cannot be solved optimally, because we do not have all the required resources to apply mathematical or other complex models (as CPM). A heuristic is an alternative method to find a good solution to a complex
problem. Heuristic methods are typically applied to solve complicated scheduling problems (Reference 10).
The different industrial engineering areas: Airframe, Systems, and Interiors had a good understanding of the critical sequences of jobs or "critical paths" under their responsibilities. But there was not an understanding of the sequence of all these critical jobs from the beginning to end of the final assembly process. The heuristic approach consisted of integrating the knowledge of the three IE areas in one single stream of critical jobs or "Critical Path". Figure III-1 represents the integration effort.
AIRFRAME AIRFRAME
INTERIORS SYSTEM
Figure III-1: Current Value Stream Map Integration
The flows of critical jobs for the different areas in the final assembly line were linked by working in teams with the Industrial Engineers to first, create and/or validate the individual Critical Path for their areas and second, to link the streams. This was a complex exercise as the sequencing nature of the jobs (or constraints) changes through the value stream map. For example, in some areas the systemic sequences (that are determined by the design of the aircraft) are critical, whereas in other areas the space constraints dominate.
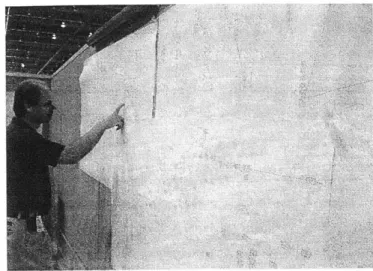
To visualize the interrelationships between areas, the Industrial Engineers and the intern reviewed the job sequences printed in large paper scrolls posted in the walls (see Figure 111-2).
All the critical job relationships collected in these meetings were fed into the
Microsoft ProjectTM software and printed
using a Pert Chart format. The
construction of the VSM for a total of 429 jobs took approximately one and a half
months. Finally, the software computed
the minimum manufacturing time (in
consecutive hours) required for the
sequences under the current schedule.
Figure I1I-2: Current VSM Construction and Analysis
VSM Groups
During the construction of the VSM the industrial engineers and the intern classified the jobs in 5 groups, based on the main constraint associated with each group. Figure 111-3 is the condensed version of the current VSM using the "Learning to See" format (Reference 5) and shows the defined groups with their associated flow times. In Figure 111-3, "C/T" means the cycle time (or contribution to the flow time, the actual values are no disclosed for proprietary reasons) and "DIB" means the days in building (or
day numbers in which the tasks were performed) for every group.
One constraint is the location of the jobs regarding the final assembly line. The Major Body Join jobs (that integrate the different structure subassemblies of the aircraft to one single structure, "JOIN" group in Figure 111-3), the Paint jobs (that paint the aircraft to the customer requirements, "PAINT" group in figure), and the Final Tests jobs (jobs performed after paint and before the plane is moved to the delivery center, "FINAL TEST AND MOVE" in figure) were grouped together as they are performed outside of the moving line and in different locations.
High-Level Value Stream Map Current State
717 Final Assembly Critical Path
EXTERNAL
SUPPLIERS PRODUCTION CONTROL
SUPPLIERSFIXED SCHEDULE (I SHIP/4 DAYS)CD
ADJUST IN RATE CHANGES
zi JOIN M HYD, RIG, COCKPIT A PAINT FI TS
ROLLOUT FUNTOS&MV
CIT vhrs Cirs hrs CiT xhrs CIT y hrs CIT z hrs
TOTAL SPAN TIME: vw+x+yz hrs
Figure 111-3: Condensed Version of the Current VSM
The System Installations (jobs that integrate the mechanic, hydraulic, electric, and electronic systems on the plane, "HYD, RIG, ROLLOUT" in Figure 111-3) are mainly constrained by the sequencing of the jobs, and for Cockpit Functions (system installations and interior installations performed in the airplane cockpit, "COCKPIT FUNCTIONS" in figure) the main constraint is the physical space inside the cockpit (also known in Boeing as flight deck).
This grouping gave the IE department a clearer understanding of the main drivers of the flow time. For example, they learned that the job sequence performed in the cockpit contributes the most to the total flow time. In Chapter V the cockpit job sequence will be analyzed thoroughly.
This classification was used as the base for planning the reduction of the current critical path to the new configuration requirements explained in Chapter V.
Results of the Current VSM Exercise
The use of heuristics to solve the problem proved to be successful: only one month and a half was required to construct the VSM. Even when the VSM exercise does not give one hundred percent accuracy on the flow time calculations, it provides a good estimate for management decision-making.
The VSM exercise also helped management have a better understanding of the main drivers of the flow time, and to apply this knowledge on the planning of the next rate break. It also guides the implementation of the subsequent 9 Tactics.
As will be explained in Chapter V, the current critical path's hours were not sufficient to support the new configuration. The same chapter explains the methodology followed to adjust the current VSM to the new requirements.
IV. ASSEMBLY LINE CONFIGURATION SELECTION Introduction
The commercial airplane industry is a mature industry characterized by low profit margins as a result of the competition between the two industry contenders, the Boeing Company and Airbus. Therefore, cost reduction is one of the main elements of the aircraft manufacturer's strategy.
Based on this pressure of cost control, and in the event of a considerable change in the customer requirements, an economic assessment must be made to understand what is the optimal configuration of the assembly line that delivers the best profitability and aligns with the strategy of the program.
By performing an economic analysis, the Operations Management area (more specifically the Industrial Engineering department) will understand the tradeoffs between the resources utilized by the assembly line and their leverage in the program's economics. This understanding will lead to the selection of the best assembly line configuration for the program.
As mentioned before, the 717 Program experienced a drastic production slowdown and by the time the internship was started, decisions were already made for the future configuration of the line. The task for the intern was to evaluate the decisions already made with an economic analysis. This economic analysis must use Boeing's Economic Profit and Managing for Value concepts, described in Chapter I.
The lean concepts are incorporated in the economic analysis. This chapter will explain the economic analysis performed for the 717 Program final assembly line and the lean concepts utilized.
Lean and Economics
The literature that relates cost analysis to lean manufacturing concepts is very limited. Nevertheless, at the beginning of almost every book explaining the Toyota
Production System, or Just in Time, or lean concepts, etc. (Reference 3) there is an explanation about the "minus-cost" principle. This minus-cost principle is represented by the equation "Profit = Price - Cost". The main assumption of the practical application of this principle is that the market determines the product price, and the enterprise cannot alter (at least in the short run) price to increase profits. In consequence, the only means in which an organization can increase its profits is by reducing costs in all business activities.
Costs are reduced by eliminating what is commonly called "waste" in the lean
literature. The four main forms of waste are: excessive production resources,
overproduction, excessive inventory, and unnecessary capital investment (Reference 11). The literature also warns the lean practitioner of the dangers of local optimizing costs, which could result in a sub-optimization of the total cost of the system as a whole. Therefore, the cost analysis must be focused on estimating the "total cost" of the system (an organization, program, or project), rather than on individual costs at stages or parts of that system.
Boeing, Lean and Economic Profit
As part of the strategy to reduce costs, the Boeing Company has adopted the financial measure called "Economic Profit", previously described in Chapter 1. This metric is equivalent to the Economic Value Added (EVATM) concept first introduced and highly publicized by Fortune Magazine in 1993 (Reference 12).
The EP concept states that a company or a business unit creates value for owners only when its operating income exceeds the cost of the capital employed. The EP concept is mathematically expressed as:
EP = Net Operating Profit After Taxes - Opportunity Costs of Assets Utilized or
EP = (Revenues - Operating Costs) x (1- tax rate) - (Assets Utilized x Weighted Average Cost of Capital
The lean "minus-cost" is implicitly applied when calculating the Economic Profit to evaluate projects or investment alternatives. The minus-cost is a high level concept, oriented to maximize the profits per product by decreasing the costs, whatever the source of the costs are. The economic profit concept focuses on profitability also by managing costs, but it goes a step beyond the lean concepts by analyzing the effect of the opportunity costs of the assets utilized to the bottom line. This is particularly important for Boeing given the capital-intensive nature of its business.
As explained in Chapter 1, Boeing's Managing for Value approach requires the projects to be analyzed in a determined time horizon (see Figure 1-5). Then the final value of the project is the net present value of the stream of economic profits discounted by Boeing's weighted average cost of capital (WACC, see Reference 13).
The use of EP is equivalent to evaluating the investment alternative (or project) comparing it to a project with the same discount rate, and with the same investment in assets. The net present value resulting from the comparison of those two projects must be positive to consider that the investment alternative is generating value. Otherwise, the investment alternative destroys value and must be rejected.
The EP metric also aligns to the "total cost" approach taught by the lean theory, as requires the calculation of the total costs using the information of the financial statements of the airplane program. One of the challenges of this metric is that it requires an "open-book management" approach, meaning that all financial information relevant to design, scheduling, and product tasks is shared by the employees of the firm, and even with the suppliers and distributors up and down the value stream.
Boeing's Economic Profit Calculator
The BCAG created an Excel tool to estimate value of a project using the Economic Profit calculations for five years. This tool is named "the EP calculator" (EPC).
EPC requires as input the information about the Income Statements and Balance Sheets and other financial and operations management parameters such as flow time, available manufacturing days, the weighted average corporate cost of capital, tax rates,
labor hours and burden rates, R&D costs, Process Improvement costs, and other costs, etc. to calculate the Economic profit of the project based on the formulas of Figure 1-3.
The EPC also allows performing what-if scenarios by changing the values of the different parameters (labor hours, R&D costs, work in process, etc., approximately 20 parameters in number) to understand their leverage in the economic profit calculation and
managing for value results.
Due to proprietary reasons this thesis does not disclose the interface of the EPC.
Selection of Economic Profit as Project Metric
The Economic Profit calculation and managing for value concepts were used during the internship project for the selection of the assembly line configuration for two main reasons:
First, given the magnitude of the costs associated with the final assembly line configuration selected (work in process loaded in the continuous moving line, inventory buffers, etc., mechanics labor) it was mandatory to evaluate the alternatives using an
economic analysis and in a long-term horizon, as managing for values suggests.
Second, EP was selected because it aligns with the estimating costs approach recommended by the lean literature. An EP analysis will define the assembly line
configuration that will deliver the highest profitability to the 717 Program, given the customer requirements.
Project's Economic Analysis: Expanding the Capabilities of Boeing's EPC Cost Analysis for Assembly Line Configuration Alternatives
As stated above, the objective of the economic analysis was to evaluate the different assembly line configuration alternatives, searching for the one that contributes the most to the economic profit of the program. The economic analysis was performed, expanding the capabilities of the existing EPC Excel tool by adding spreadsheets that
estimate the operating costs and define the line configuration parameters such as flow days, number of shifts, and headcount, for the assembly line configuration alternatives.
The first intent of the economic analysis was to develop a non-linear optimization program to obtain the optimal assembly line configuration parameters for each of the five
years, solving for the minimum cost. But given the small number of possible
configurations that the 717 line can have (thirty, which equals ten possible airplane load configurations, from one to ten airplanes loaded in the assembly line, times three possible shifts), we decided to simply estimate the costs of the thirty possible options. Next we would select for each year the configurations with the lowest cost and capable of supporting the tactical plans for the five-year horizon of planning.
The Tool
The expanded tool comprises 13 spreadsheets, the six original EPC spreadsheets (one for inputting the financial statement information and five screens that estimate the economic profits for each of the five years) and another seven spreadsheets designed by the intern to calculate the operating costs of the assembly line.
b)
Calculate
configurations
costs
Economic analysis process
for the
configuration selection
C) Select configurations and S analyze tradeoffs d) Input financial statements data e) Review EP and play what-ifscenarios
The following is a description of the tool's spreadsheets and the order in which the user interacts with them to complete an economic analysis (see Figure IV-1):
Input Assumptions/Data screen: assumptions and data specific to the 717 Program, as maximum and minimum number of positions allowed, percentage of support heads, critical path length, Paint and Delivery Center information, etc. are inputs. The user inputs in this screen the information necessary to perform the assembly line cost analysis that is not included in the original EP calculator input sheet. Appendix 2 shows the "Input Assumptions" screen and the other spreadsheets designed for the economic analysis.
Calculate configuration costs: 5 screens, one for each year of the planning horizon, calculate the operating costs of all possible layout configurations, and suggest as optimal the one with the lowest costs (see Appendix 2). Nevertheless, the user can override the proposed optimal solutions and pick any of the other possible configurations.
Select configurations and analyze tradeoffs: one screen summarizes the information of the selected configurations for the five years, and graphs (for each year) the incremental costs of the alternatives not selected, to help the user to understand the tradeoff magnitude between labor costs, the cost of capital charge, and other overhead costs (see Appendix 2).
Input financial statements data: the selected configurations of the line for the 5 years are automatically fed into the EPC Input sheet. Next the other financials such as the balance sheet and income statement figures, supplier costs changes, etc. must be input to the EPC Input sheet.
Review EP and play what-if scenarios: The tool calculates Economic Profit for the five years and computes their net present value. This is done in five identical spreadsheets, one for each year. These spreadsheets have the functionality to play what-if scenarios with the different parameters. The user can alter the final values of the parameters to understand how those changes impact the bottom line Economic Profit. Playing with the
parameters management will develop a better understanding of the main drivers in the economics of the configuration of the line.
The tool assists Operations Management, specifically the Industrial Engineering department, in understanding the tradeoffs in the distribution of the resources for the assembly line configuration alternatives. It applies the Economic Profit concept twice: first to select the assembly line configuration and second to analyze the other financial aspects of the 717 Program related to the configuration selected.
Moreover, the tool considers all the economic aspects of the program. It considers not only the operating costs of the best assembly line configuration, but also considers the rest of the working capital required to operate the program and therefore supports the Lean concept of "Total Cost".
Economic Analysis and Application of Tactics 1 and 2
The economic analysis performed by the tool involves the application of Tactics 1 and 2 concurrently. It relates to Tactic 1 as it defines the "backbones" for the future VSM: flow days, number of positions or planes loaded in the moving line, number of shifts, headcount for engineering, support and mechanic groups.
The economic analysis also involves Tactic 2 in a two-fold way: first, it defines the constraints to be considered in the distribution of the resources: optimal flow time, number of shifts, and the TAKT time, being those; second, it defines the rough cut in the distribution of the most valuable resource, the mechanic time, across the optimal flow time, number of shifts and TAKT time.
Understanding the Tradeoffs
The tool was constructed and applied to the 717 assembly line. The Industrial Engineering and Finance departments provided the data required to execute the analysis.
Figure IV-2 plots the optimal results (results for the configurations with the lowest
costs) from the tool's operating cost analysis for different production rates (in aircraft per year). The four graphs for the optimal number of shifts, flow days, number of positions,
and total costs against the production rates unveil interesting insights.
The top-right graph in Figure IV-2 shows that in the event of a drastic reduction of the production rates the 717 Program is better off increasing the flow time and reducing operations to one shift. For example, if the production rate falls from 35 aircraft per year to 10 (marked with an "x" in Figure IV-2) the optimal solution suggests increasing the number of flow days by 142%.. The optimal solution also suggests operating in a single
shift. Cum Cost 0 20 40 60 Rate (AC/yr) No. of Shifts 4 2 0 20 Rate (AClyr 0 60 Flow Days 0 0 20 40 60 Rate (AC/yr) No. of Positions 0 20 40 60 Rate (ACyr)
Figure IV-2: 717 Operating Costs Analysis Results
By analyzing the components of the cost equations in the tool, we understood the dynamics of the economics that drove the one shift and longer flow time selection. Figure IV-3 shows the different components in the calculation of the operating costs or "Total Cost", using a System Dynamics format. This format is very useful for understanding the interrelation of the variables in complex systems (Reference 14).
The main components of the Total Cost are represented as five "branches" of calculations. The elements of the diagram in italic font are inputs to the calculations and the rest are computed parameters. For proprietary reasons this thesis does not disclose the actual formulas applied. Nevertheless, this framework gives the reader an understanding of the logic followed in the cost analysis.
The tool proposes as the optimal solution the configuration of the final assembly line with the lowest operating costs, from all the possible alternatives. For low production
Max Crew Size per position %Distribution No Shif Positions Mfg Labor Rate
Labor Hours Reb
Mfg Days per per Plane %Dis ribution
Year Zh7f2Tax Rate
tanufa turing Ma+
Customer u -+Crew Siz Manu acturing MgHr MgLao
AK T -- lHacontg + CrS ze MH o Mfg Hsper I o
Demand K....headota T Shift 2 -10Headcount REAL-#" Year MM gLabo
%Distribution
t
+Shfi 3 Average hiI <Mfg Days
+ + Size per Year>
CrewSz
Final Assembly Shift 3
Critical Path
Critical Path F ow Days Days t(Span Days)
<Average Size> Shl <No. of
Positions>
Support Labor
+ Rate
No. o hi __ Headcount reduction Sup prtpport LaboS TH AL
BRANCH 2 per shift selection % Support"' wr Headcoun Year +- Cot CST
+
Heads
<Average S Size> ef <Mfg Days per <Tax ate>
Year> Baseline Cust
Demand Baseline Eng
Headceount+
Variable Eng ng rsuper Eng Lal
has Headcount Year b Cost
Fixed Heads Eng Labo
% <Customer Rate
Demand>
Incremental
Costs 2 Shifs 1p, Incremental
Overhead Costs
Incremental'sS Costs 3 Shifts
<No. of WIP Cost of Capi
Posti nsl> r Charge