HAL Id: hal-00274968
https://hal.archives-ouvertes.fr/hal-00274968
Submitted on 22 Apr 2008
HAL is a multi-disciplinary open access
archive for the deposit and dissemination of
sci-entific research documents, whether they are
pub-lished or not. The documents may come from
teaching and research institutions in France or
abroad, or from public or private research centers.
L’archive ouverte pluridisciplinaire HAL, est
destinée au dépôt et à la diffusion de documents
scientifiques de niveau recherche, publiés ou non,
émanant des établissements d’enseignement et de
recherche français ou étrangers, des laboratoires
publics ou privés.
The close-in companion of the fast rotating Be star
Achernar
Pierre Kervella, Armando Domiciano de Souza, Philippe Bendjoya
To cite this version:
Pierre Kervella, Armando Domiciano de Souza, Philippe Bendjoya. The close-in companion of the
fast rotating Be star Achernar. Astronomy and Astrophysics - A&A, EDP Sciences, 2008, In press.
�hal-00274968�
hal-00274968, version 1 - 22 Apr 2008
April 22, 2008
L E
The close-in companion of the fast rotating Be star Achernar
⋆
P. Kervella
1, A. Domiciano de Souza
2, and Ph. Bendjoya
21 LESIA, Observatoire de Paris, CNRS UMR 8109, UPMC, Universit´e Paris Diderot, 5 Place Jules Janssen, 92195 Meudon, France 2 Lab. H. Fizeau, CNRS UMR 6525, Univ. de Nice-Sophia Antipolis, Observatoire de la Cˆote dAzur, 06108 Nice Cedex 2, France
Received ; Accepted
ABSTRACT
Context.The Be stars are massive dwarf or subgiant stars that present temporary emission lines in their spectrum, and particularly in the Hα line. The mechanism triggering these Be episodes is currently unknown, but binarity could play an important role.
Aims.Previous observations with the VLT/VISIR instrument (Kervella & Domiciano de Souza 2007) revealed a faint companion to Achernar, the brightest Be star in the sky. The present observations are intended to characterize the physical nature of this object.
Methods.We obtained near-IR images and an H-band spectrum of Achernar B using the VLT/NACO adaptive optics systems.
Results.Our images clearly show the displacement of Achernar B over a portion of its orbit around Achernar A. Although there are not enough data to derive the orbital parameters, they indicate a period of about 15 yr. The projected angular separation of the two objects in December 2007 was less than 0.15′′, or 6.7 AU at the distance of Achernar.
Conclusions.From its flux distribution in the near- and thermal-infared, Achernar B is most likely an A1V-A3V star. Its orbital period appears similar to the observed pseudo-periodicity of the Be phenomenon of Achernar. This indicates that an interaction between A and B at periastron could be the trigger of the Be episodes.
Key words.Stars: individual: Achernar; Techniques: high angular resolution; Stars: emission-line, Be; Stars: binaries: close
1. Introduction
As the brightest (mV = 0.46) and nearest Be star in the sky, Achernar (α Eri, HD 10144) has been the focus of a lot of in-terest over the past decades. Its very fast rotation velocity v sin i is estimated between 220 to 270 km.s−1 and its effective
tem-perature between 15 000 to 20 000 K (Vinicius et al. 2006). Achernar was chosen as the subject of the first VLTI observa-tions, which revealed its extraordinarily distorted interferomet-ric profile (Domiciano de Souza et al. 2003). Different possi-bilities have been proposed recently to explain the exception-ally high flattening ratio of the photosphere of the star (Jackson et al. 2004; Carciofi et al. 2008). Further interferometric obser-vations have revealed the presence of the stellar wind emitted by the overheated poles of the star (Kervella & Domiciano de Souza 2006), resulting in a slight revision of its flattening ra-tio. A model of the envelope of Achernar has recently been pre-sented by Meilland (2007). Last year, we discovered a close-in faclose-int companion to Achernar, from diffraction-limited ther-mal IR imaging with VLT/VISIR (Kervella & Domiciano de Souza 2007). The present Letter reports the follow-up adaptive optics observations in the near-IR domain to characterize this companion, hereafter referred to as Achernar B.
Send offprint requests to: P. Kervella
⋆ Based on observations collected at the European Southern
Observatory, Chile under ESO Program 279.D-5064(A)
Correspondence to: [email protected]
2. Observations
2.1. Imaging
We observed Achernar at several epochs in the second half of 2007 using the Nasmyth Adaptive Optics System (NAOS, Rousset et al. 2003) of the Very Large Telescope (VLT), coupled to the CONICA infrared camera (Lenzen et al. 1998), abbre-viated as NACO. Table A.1 gives the list of the observations of Achernar and the standard star δ Phe (HD 9362). We selected the smallest available pixel scale of 13.26 ± 0.03 mas/pix (Masciadri et al. 2003), giving a field of view of 13.6′′×13.6′′. Due to
the brightness of Achernar, we employed narrow-band filters at wavelengths 1.094 ± 0.015, 1.644 ± 0.018, and 2.166 ± 0.023 µm (hereafter abbreviated as 1.09, 1.64, and 2.17) together with a neutral density filter (labeled “ND2 short”), with a transmission of about 1.5%. The raw images were processed using the Yorick1
and IRAF2software packages in a standard way, except that we did not subtract the negligible sky background. Examples of the images of Achernar A & B and δ Phe are presented in Fig. 1.
2.1.1. Astrometry
To obtain the position of B, we first prepared the images by sub-tracting a 180◦rotated version of each image to itself. This re-moves the contribution of Achernar A and mainly leaves a pair of positive and negative images of B, corrected from the PSF wing leaks from A (Fig. 2). We then directly measured the posi-tion of Achernar B relative to A using a Gaussian fit procedure
1 http://yorick.sourceforge.net/
2 IRAF is distributed by the NOAO, which are operated by the
Association of Universities for Research in Astronomy, Inc., under co-operative agreement with the National Science Foundation.
2 P. Kervella et al.: The close-in companion of the fast rotating star Achernar
Fig. 1. NACO images of Achernar A & B (left) and δ Phe (right)
in the 2.17 µm filter obtained on 22 December 2007. The arrows indicate the position of Achernar B. The field of view is 1′′, and
the grey scale is normalized for both images to the central part of the PSF.
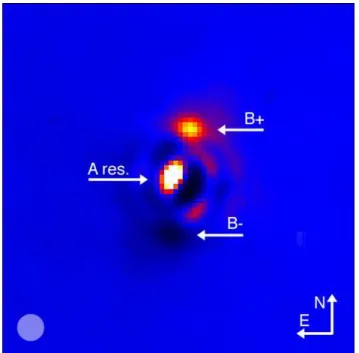
Fig. 2. Result of the subtraction of a 180◦rotated version of the
image of the Achernar system presented in Fig. 1 (left) from itself. The “B+” and “B-” arrows point at the positions of the positive and negative images of Achernar B, and the “A res.” arrow indicates the A subtraction residuals. The aperture used for photometry is shown in the lower left corner, and the field of view is 1′′on each side.
on these images. Although Achernar B is clearly visible at all three wavelengths, the Gaussian fit converged essentially in the
K band where the high Strehl ratio (compared to the 1.09 µm
im-ages in particular) results in a better separation of the two objets. The formal fitting error is below ±0.1 pixel, but we estimate the true uncertainty to ±0.5 pixel (0.066′′), due to the presence of residual speckles from Achernar A close to B. The pixel scale and detector orientation introduce negligible systematic uncer-tainties (Masciadri et al. 2003; Chauvin et al. 2005).
Between epochs 2006.760 (Kervella & Domiciano 2007) and 2007.975, we measured an apparent displacement of B rel-ative to A of ρB = 161 ± 10 mas along an azimuth of α = +113◦ (Fig. 3 and Table 1). According to the Hipparcos cata-log (ESA 1997), the amplitude of Achernar A’s proper motion on the sky over 1.2 yr is ρpm = 116 mas along an azimuth of
Table 1. Position of Achernar B relative to Achernar A.
Epoch λ(µm) ∆αa σ(α) ∆δa σ(δ) R pb 2006.760c 11.25 -184.0 7.5 211.0 7.5 12.3 2007.488 2.17 -95.9 6.6 178.6 6.6 8.9 2007.824 2.17 -46.9 6.6 165.8 6.6 7.6 2007.975 2.17 -35.3 6.6 148.2 6.6 6.7
a Differential coordinates and uncertainties in milliarcseconds (mas). b Projected A–B separation in AU.
c From Kervella & Domiciano de Souza (2007).
Fig. 3. Position of Achernar B relative to A for four epochs.
The open square indicates the VISIR observation (Kervella & Domiciano 2007), and the dots represent the new NACO epochs. The dashed curve is a simple quadratic fit through the data points intended to guide the eye. The segment over Achernar A in-dicates its projected rotation axis and polar wind as measured by Kervella & Domiciano (2006). The apparent angular sizes of Achernar A and its polar wind are approximately represented to scale.
αpm = +115◦. If B was a background source, we would
ex-pect an apparent displacement opposite in azimuth to A’s proper motion. As B is clearly comoving with A, we can rule out the possibility that it is a background source. As a remark, the parallactic oscillation of the position of Achernar A is small (π = 22.68 ± 0.57 mas) compared to the observed displacements, but the presence of B could have affected the Hipparcos proper motion and parallax measurement of Achernar. The other epochs listed in Table A.1 give astrometric positions compatible with the trajectory shown in Fig. 3, although with lower accuracy due to poor seeing conditions.
2.1.2. Photometry
For the photometric calibration of our images, we observed a standard star immediately before or after Achernar, δ Phe (HD 9362, G9III) in the same narrow-band filters. It was cho-sen in the Cohen et al. (1999) catalogue of spectrophotometric standards for infrared wavelengths. Due to the small separation
of the Achernar A-B pair, PSF fitting is not possible for measur-ing the photometry of B. We therefore proceeded in three steps: 1. We measured classical aperture photometry of Achernar
rel-ative to δ Phe, using a large aperture of 1.2′′in radius.
2. As for the astrometry measurement, we subtracted a 180◦ rotated version of each image to itself to remove the con-tribution of Achernar A and leave a positive and a negative image of B, along with limited residuals from A (Fig. 2). 3. We obtained aperture photometry of B from the subtracted
images using an aperture radius of 0.040′′(shown in Fig. 2).
This procedure has ensured that we obtain properly referenced photometry for Achernar A (the influence of B is negligible at step 1), that we can transfer to B at step 3. Step 2 is neces-sary because B is located inside the wings of the PSF of A. This subtraction is efficient thanks to the good circular symme-try of the PSF produced by NACO. At step 3, we measure the photometry of A and B over the same aperture and within the same images. This allows us to avoid the problem of the vari-able Strehl ratio of adaptive optics images. The conversion of the measured narrow-band magnitudes to standard JHK band mag-nitudes requires taking the position of the quasi-monochromatic wavelengths within the bands and the shape of the observed spectra into account. Starting from the narrow-band fluxes mea-sured on Achernar and δ Phe, we used the Pickles (1998)3 ref-erence spectra corresponding to their spectral types (B3V and G9III) to recover the corresponding broadband flux ratio. The filter profiles were taken from Bessell & Brett (1988). From the October-December 2007 observations, we derived magnitudes of: mJ(A) = 0.58±0.14, mH(A) = 0.80±0.11, mK(A) = 0.81±0.11.
These values generally agree with the JHK magnitudes of Achernar from the 2MASS (Skrutskie et al. 2006; 0.82±0.25,
0.87±0.32, 0.88±0.33) and Ducati (2002; 0.79, 0.86, 0.88) catalogs,
although systematically brighter by 0.1-0.2 mag, particularly in the J band. This may be due our narrow-band filters correspond-ing to the emission lines sometimes present in the spectrum of Achernar. As we may slightly overestimate the brightness of Achernar, we quadratically added an uncertainty of 0.1 mag.
From the magnitudes of Achernar A, the small-aperture pho-tometry obtained at step 3 gives the following broadband mag-nitudes for Achernar B: mJ(B) = 4.23±0.36, mH(B) = 4.29±0.22,
mK(B) = 4.61±0.27. The magnitude differences measured
be-tween A and B in the three narrow-band filters are: ∆m1.09 =
3.64±0.47, ∆m1.64 = 3.50±0.19, ∆m2.17 = 3.80±0.25, corresponding
to an average contrast of ≈ 30 between the two stars in the near-infrared. These magnitudes of B are averages over the October-December 2007 observations (epoch 2007.8) and the error bars contain the statistical uncertainty and the dispersion of all the measurements. The magnitudes at the other epochs (list of the observations in Table A.1) show a marginally significant bright-ening of B by −0.7±0.4mag in the K band between 2007.488 and
2007.975 as it approaches A.
2.2. Spectroscopy
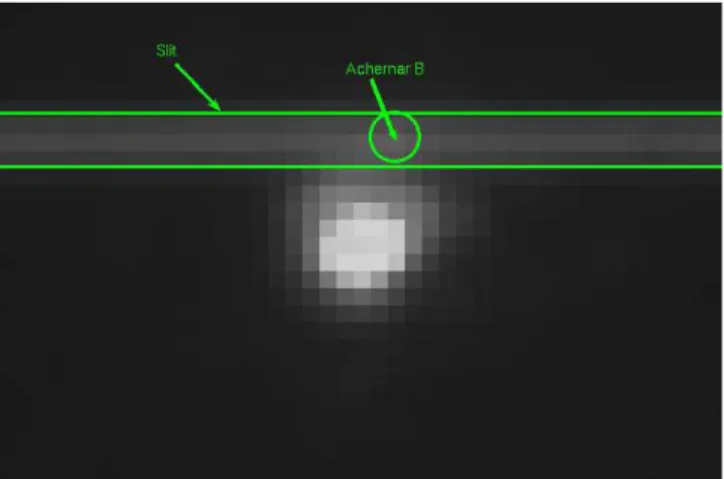
For the spectroscopic observations, we used the S27 3 SH mode of NACO, featuring a slit width of 86 mas on the sky, a spectral resolution of 1500 over the H band (dispersion of 0.34 nm/pixel), and an angular pixel scale of 27 mas/pixel. As shown in Fig. 4, the slit was centered on Achernar B. Although most of the light fed into the slit comes from the companion, it is not excluded
3 http://www.ifa.hawaii.edu/users/pickles/AJP/hilib.html
that Achernar A may contribute with part of the H band spec-trum. Details on the 3 recorded ABBA sequences are given in Table A.1. Observations were performed using the classical IR
Fig. 4. Position of the NACO slit relative to Achernar A and B.
NACO sequence where the spectrum is recorded with the target positioned at two different slit positions, i.e. the ABBA observ-ing sequence. For the data reduction we applied two different procedures: (1) the classical spectral reduction procedure using the IRAF packages for dark and flat field corrections, and (2) the A-B, B-A procedure. Because the sky background is negli-gible and the target is rather bright, both procedures give identi-cal results. In the last step, IRAF was used to obtain 1D spectra from weighted averages of 2D spectra and to perform the wave-length calibration. Figure 5 shows the continuum-normalized average spectrum derived from our 12 observations. The at-mospheric absorption lines were corrected using the transmis-sion by Lord (1992), but some residuals are visible in particular around λ = 1.66 µm (CH4 and water vapor lines). The
absorp-tion lines from the Brackett transiabsorp-tions 11 to 23 of hydrogen are clearly visible in the spectrum and marked by vertical lines.
3. Discussion
The Hipparcos parallax of Achernar (π = 22.68 ± 0.57 mas; ESA 1997) corresponds to a distance modulus of µ = 3.22 ± 0.06 mag. The absolute magnitudes of B in the JHK and thermal infrared N band (average of the PAH1 and PAH2 magnitudes, see Appendix A) are therefore: MJ= 1.00±0.37, MH= 1.07±0.22,
MK= 1.39±0.28, and MN = 1.88±0.12. The JHK absolute
magni-tudes suggest a spectral type around A1V, slightly fainter than Vega and slightly brighter than Sirius, which have respective magnitudes of MJHK ≈ 0.55 and 1.56. The N band absolute magnitude of Achernar B is also very similar to that of Sirius (MN = 1.62). It thus does not appear to present an infrared ex-cess that would betray a Vega-like dusty envelope. Because Vega itself presents a significant excess in this band (MN = 0.55) due to the presence of dust, it is not comparable.
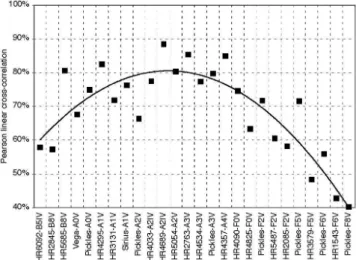
Our NACO H band spectrum of B presents a lot of similarity with early A-type star spectra, as shown in Fig. 5. This is con-firmed by the computation of linear Pearson cross-correlation coefficients between our normalized spectrum and the reference
H band spectra from Ranade et al. (2004)4and Pickles (1998)5.
As shown in Fig. 6, the spectral types A0V-A4V give the 4 http://vo.iucaa.ernet.in/∼voi/NIR Header.html
4 P. Kervella et al.: The close-in companion of the fast rotating star Achernar
Fig. 5. Average spectrum of Achernar B (solid curve) compared to the H band spectrum of HR 2763 (λ Gem, A3V, dashed curve)
from Ranade et al. (2004). The positions of the Brackett transitions 11-4 to 23-4 of hydrogen are marked with vertical lines.
Fig. 6. Cross-correlation between our spectrum of B and
refer-ence spectra from Ranade et al. (2004), Meyer et al. (1998), and Pickles (1998).
best correlation with our observation. As shown by Meyer et al. (1998)6, the equivalent width (EW) of the 11-4 Brackett line
at 1.681 µm offers a possibility to test the effective temperature, although it is not monotonic. An integration normalized to the pseudo-continuum between 1.670 and 1.690 µm gives an equiv-alent width of 0.675 nm (=2.4 cm−1). From Fig. 7 in Meyer et
al. (1998), this gives log Teff ≈3.9 − 4.1, also compatible with
an early A-type star. Such a star has an approximate mass of ≈2 M⊙(Kervella et al. 2003).
Although we cannot derive the full parameters of Achernar B’s orbit from our limited astrometry, the combina-tion of its estimated mass (≈ 2 M⊙), the mass of A (≈ 6.7 M⊙;
Vinicius et al. 2006, see also Harmanec 1988) and the maximum apparent A-B separation (rAB ≈ 12.3 AU) allow us to roughly estimate its period. From Kepler’s third law and by assuming an elliptic orbit, we have T2 = a3/M where a is the semi-major
axis in AU, T the period in years, and M the total mass in M⊙.
Assuming that a is equal to the observed maximum separation of 12.3 AU, we obtain a minimum period of T = 14 to 15 yr.
6 ftp://ftp.noao.edu/catalogs/medresIR/
4. Conclusion
From our photometry and spectroscopy, Achernar B is most probably an A1V-A3V star. Our data are currently insufficient for deriving its full orbit, but its minimum period is ≈ 15 yr. Its fast orbital motion should allow the derivation of reliable parameters within a few years. The periodic approach of the companion could be the cause of the observed ≈ 15 yr pseudo-periodicity of the Be episodes of Achernar (Vinicius et al. 2006). The passage of B at periastron within a few AUs of A could ex-tract material from the equator of A, where the effective gravity is very low. The next such passage should happen around 2010 (Meilland 2007). Achernar appears similar to the B0.2IVe star δSco, which has a 1.5 mag fainter companion on a highly excen-tric 10.6 yr orbit (Bedding 1993; Miroshnichenko et al. 2001). This suggests that the presence of companions around Be stars should be examined carefully, as it may play a key role in trig-gering the Be phenomenon.
Acknowledgements. This research made use of the SIMBAD and VIZIER
databases at the CDS, Strasbourg (France), and NASA’s Astrophysics Data System Bibliographic Services. We also received the support of PHASE, the high angular resolution partnership between ONERA, Observatoire de Paris, the CNRS, and University Denis Diderot Paris 7.
References
Bedding, T. R. 1993, AJ, 106, 1068
Bessell, M. S. & Brett, J. M. 1988, PASP, 100, 1134
Carciofi, A. C., Domiciano de Souza, A., Magalh˜aes, A. M., Bjorkman, J. E., & Vakili, F. 2008, ApJ, 676, L41
Chauvin, G., Lagrange, A.-M., Lacombe, F., et al. 2005, A&A, 430, 1027 Cohen, M., Walker, R. G., Carter, B., et al. 1999, AJ, 117, 1864
Domiciano de Souza, A., Kervella, P., Jankov, S., et al. 2003, A&A, 407, L47 Domiciano de Souza, A., Kervella, P., Bendjoya, Ph., & Niccolini, G. 2008,
A&A, 480, L29
Ducati, J. R. 2002, NASA Ref. Pub. 1294
The Hipparcos and Tycho Catalogues, 1997, ESA SP-1200
Jackson, S., MacGregor, K. B., & Skumanich, A. 2004, ApJ, 606, 1196 Harmanec, P. 1988, Bull. Astron. Inst. Czechoslovakia, 39, 329 Kervella, P., Th´evenin, F., Morel, P., et al. 2003, A&A, 408, 681 Kervella, P., & Domiciano de Souza, A. 2006, A&A, 453, 1059 Kervella, P., & Domiciano de Souza, A. 2007, A&A, 474, L49
Lenzen, R., Hofmann, R., Bizenberger, P., & Tusche, A. 1998, SPIE 3354, 606 Lord, S.D. 1992, NASA Technical Memor. 103957
Masciadri, E., Brandner, W., Bouy, H. et al. 2003, A&A, 411, 157 Meilland, A. 2007, Ph.D. Thesis, Universit´e de Nice-Sophia Antipolis
Meyer, M. R., Edwards, S., Hinkle, K. H., & Srom, S. E. 1998, ApJ, 508, 397 Miroshnichenko, A. S., Fabregat, J., Bjorkman, K. S et al. 2001, A&A, 377, 485 Pickles, A. J. 1998, PASP, 110, 863
Ranade, A., Gupta, R., Ashok, N. M., & Singh, H. P. 2004, BASI, 32, 311 Rousset, G., Lacombe, F., Puget, F., et al. 2003, Proc. SPIE 4839, 140 Skrutskie, R. M., Cutri, R., Stiening, M. D., et al. 2006, AJ, 131, 1163 Vinicius, M. M. F., Zorec, J., Leister, N. V., & Levenhagen, R. S. 2006, A&A,
P. Kervella et al.: The close-in companion of the fast rotating star Achernar, Online Material p 1
Fig. A.1. Residual of the subtraction of the VISIR PAH2 image
of η Ser from the image of Achernar in the same band. The con-tribution of Achernar B is clearly visible. The arrow indicates the rotation axis of Achernar A.
Appendix A: Thermal infrared imaging at 11.25
µ
m Kervella & Domiciano de Souza (2007) did not detect Achernar B in the 11.25 µm images (PAH2 band) of the sys-tem obtained with the VLT/VISIR instrument in BURST mode. A re-analysis of these observations has shown that the reason for this non-detection was the introduction of noise during the nor-malization and subtraction of the PSF reference star (δ Phe). For our VISIR program on the B[e] star MWC300 (Domiciano de Souza et al. 2008), we obtained BURST mode images of an-other PSF calibrator (η Ser) 3.4 hours before the observations of Achernar (under similar seeing conditions). Since η Ser is brighter than δ Phe, we could obtain a cleaner PSF-subtracted image of Achernar B, as presented in Fig. A.1. From this image, aperture photometry over a 0.22′′diameter gives a flux ratio of1.74% between Achernar B and A (the ratio of peak intensities is 2.14%). From the 16.8 Jy absolute flux derived by Kervella & Domiciano de Souza (2007) for A, the contribution from B is therefore 0.3 Jy at 11.25 µm. This value is comparable to the 0.4 Jy flux derived by Kervella & Domiciano de Souza (2007) at 8.59 µm.
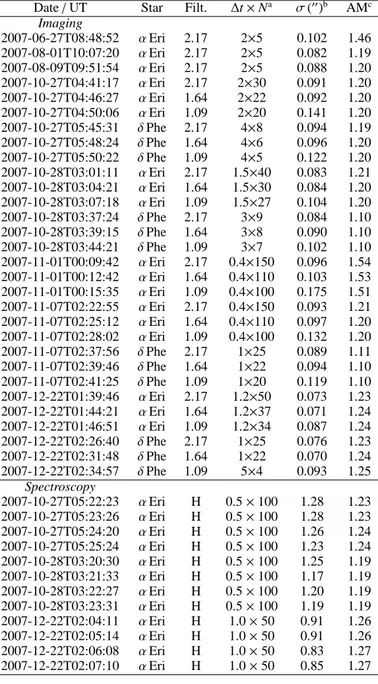
Table A.1. Log of the NACO observations of Achernar and
δPhe.
Date / UT Star Filt. ∆t × Na σ(′′
)b AMc Imaging 2007-06-27T08:48:52 αEri 2.17 2×5 0.102 1.46 2007-08-01T10:07:20 αEri 2.17 2×5 0.082 1.19 2007-08-09T09:51:54 αEri 2.17 2×5 0.088 1.20 2007-10-27T04:41:17 αEri 2.17 2×30 0.091 1.20 2007-10-27T04:46:27 αEri 1.64 2×22 0.092 1.20 2007-10-27T04:50:06 αEri 1.09 2×20 0.141 1.20 2007-10-27T05:45:31 δPhe 2.17 4×8 0.094 1.19 2007-10-27T05:48:24 δPhe 1.64 4×6 0.096 1.20 2007-10-27T05:50:22 δPhe 1.09 4×5 0.122 1.20 2007-10-28T03:01:11 αEri 2.17 1.5×40 0.083 1.21 2007-10-28T03:04:21 αEri 1.64 1.5×30 0.084 1.20 2007-10-28T03:07:18 αEri 1.09 1.5×27 0.104 1.20 2007-10-28T03:37:24 δPhe 2.17 3×9 0.084 1.10 2007-10-28T03:39:15 δPhe 1.64 3×8 0.090 1.10 2007-10-28T03:44:21 δPhe 1.09 3×7 0.102 1.10 2007-11-01T00:09:42 αEri 2.17 0.4×150 0.096 1.54 2007-11-01T00:12:42 αEri 1.64 0.4×110 0.103 1.53 2007-11-01T00:15:35 αEri 1.09 0.4×100 0.175 1.51 2007-11-07T02:22:55 αEri 2.17 0.4×150 0.093 1.21 2007-11-07T02:25:12 αEri 1.64 0.4×110 0.097 1.20 2007-11-07T02:28:02 αEri 1.09 0.4×100 0.132 1.20 2007-11-07T02:37:56 δPhe 2.17 1×25 0.089 1.11 2007-11-07T02:39:46 δPhe 1.64 1×22 0.094 1.10 2007-11-07T02:41:25 δPhe 1.09 1×20 0.119 1.10 2007-12-22T01:39:46 αEri 2.17 1.2×50 0.073 1.23 2007-12-22T01:44:21 αEri 1.64 1.2×37 0.071 1.24 2007-12-22T01:46:51 αEri 1.09 1.2×34 0.087 1.24 2007-12-22T02:26:40 δPhe 2.17 1×25 0.076 1.23 2007-12-22T02:31:48 δPhe 1.64 1×22 0.070 1.24 2007-12-22T02:34:57 δPhe 1.09 5×4 0.093 1.25 Spectroscopy 2007-10-27T05:22:23 αEri H 0.5 × 100 1.28 1.23 2007-10-27T05:23:26 αEri H 0.5 × 100 1.28 1.23 2007-10-27T05:24:20 αEri H 0.5 × 100 1.26 1.24 2007-10-27T05:25:24 αEri H 0.5 × 100 1.23 1.24 2007-10-28T03:20:30 αEri H 0.5 × 100 1.25 1.19 2007-10-28T03:21:33 αEri H 0.5 × 100 1.17 1.19 2007-10-28T03:22:27 αEri H 0.5 × 100 1.20 1.19 2007-10-28T03:23:31 αEri H 0.5 × 100 1.19 1.19 2007-12-22T02:04:11 αEri H 1.0 × 50 0.91 1.26 2007-12-22T02:05:14 αEri H 1.0 × 50 0.91 1.26 2007-12-22T02:06:08 αEri H 1.0 × 50 0.83 1.27 2007-12-22T02:07:10 αEri H 1.0 × 50 0.85 1.27
a The exposure times ∆t are given in seconds. N is the number of
individual exposures.
b For the imaging observations, σ (′′
) is the FWHM of the star image as measured on the images themselves, and for the spectroscopic observations, we list the observatory seeing in the visible.