HAL Id: halshs-02265415
https://halshs.archives-ouvertes.fr/halshs-02265415
Submitted on 9 Aug 2019
HAL is a multi-disciplinary open access
archive for the deposit and dissemination of
sci-entific research documents, whether they are
pub-lished or not. The documents may come from
teaching and research institutions in France or
abroad, or from public or private research centers.
L’archive ouverte pluridisciplinaire HAL, est
destinée au dépôt et à la diffusion de documents
scientifiques de niveau recherche, publiés ou non,
émanant des établissements d’enseignement et de
recherche français ou étrangers, des laboratoires
publics ou privés.
Generating urban morphologies at large scales
Juste Raimbault, Julien Perret
To cite this version:
Juste Raimbault, Julien Perret. Generating urban morphologies at large scales. The 2019 Conference
on Artificial Life, Jul 2019, Newcastle, United Kingdom. pp.179-186. �halshs-02265415�
Generating urban morphologies at large scales
Juste Raimbault
1,2,3,∗and Julien Perret
1,41UPS CNRS 3611 ISC-PIF 2CASA, UCL
3UMR CNRS 8504 G´eographie-cit´es 4Univ. Paris-Est, LaSTIG STRUDEL, IGN, ENSG
Abstract
At large scales, typologies of urban form and corresponding generating processes remain an open question with important implications regarding urban planning policies and sustain-ability. We propose in this paper to generate urban configura-tions at large scales, typically of districts, with morphogene-sis models, and compare these to real configurations accord-ing to morphological indicators. Real values are computed on a large sample of districts taken in European urban areas. We calibrate each model and show their complementarity to approach the variety of real urban configurations, paving the way to multi-model approaches of urban morphogenesis.
Introduction
The study of forms of the built environment, and more pre-cisely of the urban environment, has been the subject of different disciplines such as architecture, urban planning, or geography, with different approaches corresponding to various scales and processes (Moudon, 1997; Gauthier and Gilliland, 2006; Kropf, 2009). Artificial life approaches have in that context contributed to the study of generative ur-ban processes, within the broader theoretical framework of morphogenesis (Doursat et al., 2012). Establishing typolo-gies of urban morpholotypolo-gies, and understanding their link with underlying urban growth processes, is nowadays a cru-cial issue for sustainability as a large majority of the world population live in cities and energy consumption is closely related to urban form through e.g. mobility patterns and au-tomobile dependance (Newman and Kenworthy, 2000).
Although there is neither a unified definition of urban form, nor unified generative models and quantitative indica-tors to measure it, several approaches are close to the spirit of artificial life and generative social science (Bonabeau, 1997; Epstein, 1999). Procedural modeling (Watson et al., 2008) aims at generating realistic cities, but is mostly fo-cused on the visual impression given and does not consider realistic generative processes. It is furthermore developed largely at larger scales than the one of the district (Parish and M¨uller, 2001). Merrell et al. (2010) generate in that context plans for interior of buildings, whereas Cruz et al. (2017) use a cellular automaton model for building morphogenesis.
Approaches linked to urban planning have focused on the spatial distribution of land-use, at multiple resolutions (Liu et al., 2017), and proposed cellular automata models for ur-ban sprawl, generally at the scale of the metropolitan area (Herold et al., 2003). For example, Horner (2007) proposes a link between urban form based on land-use and commut-ing.
Urban form can furthermore be characterized considering different components of the urban system, such as building themselves as in several examples given before, but also for example transportation networks such as road networks (Ye and Van Nes, 2014). To what extent these layers are comple-mentary remains an open question, despite a few investiga-tions coupling the two such as Raimbault (2018c) suggesting indeed complementary dimensions. Regarding the geomet-rical properties of building layouts at the scale of a district, that we denote to simplify as urban form at a large scale, systematic characterizations and generative models remains rather rare. Achibet et al. (2014) for example describes a model of co-evolution of building layout and road network.
This paper proposes a first step towards a systematic un-derstanding of generative models of the urban form, at a large scale. The approach taken here is similar to the one taken by Raimbault (2018a), which computes urban form indicators at a mesoscopic scale (metropolitan area) and cal-ibrates a reaction-diffusion morphogenesis model. We con-sider real urban configurations at the scale of the district (fixed spatial window of 500m), compute their morpholog-ical characteristics, and use these measures to calibrate dif-ferent generative models of urban layouts at the same scale. Our contribution is twofold: (i) we synthesize a set of in-dicators relevant at this scale, and compute them on a large sample of real urban configurations in European urban ar-eas; (ii) we provide three different generative models com-plementary in the type of processes taken into account, and calibrate these models on the real morphological measures. We show therein the complementarity of the different pro-cesses to produce the variety of real urban forms considered. This is to the best of our knowledge the first time several generative models at this scale are systematically compared
on a large number of real configurations through quantitative measures.
The rest of this article is structured as follows. First, we present the methods used in our work, including the mea-sures allowing the comparison of urban forms, the proposed generative models and the method used to retrieve real ur-ban configurations. The results of the proposed approach are then explained together with the tools used in the calibration of the models. Finally, the results are discussed.
Methods
The approach taken requires both a robust way to quantify urban forms, through indicators that can be understood as features in the sense of machine learning, and generative models.
Quantifying urban forms
The quantification of urban form is in itself covered by a vast literature. Recent work have proposed to apply deep learning techniques directly on vector data, such as Moosavi (2017) does, for a worldwide classification of road net-works. Such an approach avoids the question of isolating relevant features. However, as we aim at calibrating gener-ative models, our quantification will make more sense with interpretable measures. Boeing (2018) proposes an exten-sive review of existing measures from a large extent of dis-ciplines, their implications for planning and design, and the relation with urban complexity. Webster (1995) uses image processing techniques such as contrast or Fourier analysis, to extract synthetic descriptions of urban areas from satel-lite imaging. Fumega et al. (2014) provide a typology of cities in relation with energy consumption in the perspec-tive of climate change. Rode et al. (2014) relate indicators of urban form with residential heat-energy demand. Other complexity-related approaches such as fractal dimensions have been introduced as for example by Batty and Longley (1987).
In practice, we use a variety of indicators capturing dif-ferent aspects, each being detailed below. We consider the local urban space as a square grid of width√N with cells 1 ≤ i ≤ N , and an urban configuration is a binary function si ∈ {0; 1} on these cells. For the computation of
indica-tors, we consider underlying complementary networks, the building network B defined as nodes in centroids of occu-pied cells and links between two occuoccu-pied direct neighbor cells (one cell unit of distance between centroids), and the free space network ¯B defined similarly on empty cells. This raster representation is convenient as compatible with the various types of indicators and generators as described be-low. We will consider√N = 50 in the following, and real windows of width 500m.
Basic indicators Simple descriptive indicators considered are (i) the total building density A = N1 ·P
isi; (ii) the
number of buildings given by the number of connected com-ponents of B; (iii) the average building area, i.e. the aver-age size of B connected components; (iv) Moran index cap-turing spatial autocorrelation (see Raimbault (2018a) for its definition in a similar setting), with a simple inverse distance weight function; (v) average distance between non-empty points (which also captures a level of concentration). Network indicators We also use indicators computed with the underlying networks: the average detour computed in the free space network ¯B, computed by randomly sam-pling 50 pairs of points in a connected component of ¯B and computing the ratio between the network distance and the euclidian distance dB¯/dE. This measures captures in a way
the sinuosity of streets from a mobility viewpoint. We also consider the average size of open connected areas as the av-erage size of the connected components of ¯B.
Mathematical morphology indicators Finally, indicators inspired from the field of mathematical morphology (Serra, 1983) have already been applied to the quantification of ur-ban form as for example by Pesaresi and Bianchin (2003). Mostly used in image processing, these techniques proceed to the convolution of the image with a filter for example to simplify some morphological detail, what can be interpreted as a kind of spatial smoothing. We use here an indicator based on erosion with a filter of smallest size, which here removes points which 4 closest neighbors are not also occu-pied. We consider the total number of steps to fully erode the image, which is linked to building size. Similarly, us-ing the operation of dilation, which in the contrary occupies points with at least one occupied neighbor, we consider the total number of dilation steps to fully fill the grid. This cap-tures the size of open spaces. We do not consider indicators linked to opening and closing operations, as these would re-quire more complex filters and for example their behavior as a function of kernel size.
Combining these morphological indicators, we have a to-tal number of 9 indicators that can be computed on any bi-nary grid, and that we will use in the following to compare real grids with generated grids of the same size.
Generative models
We detail now the generative models introduced. The mod-els developed below capture both bottom-up self-organizing processes and top-down planning processes. They also in-clude different urban aspects, either filling the space with built artefacts or focusing on linking empty spaces. A null model is also considered, to ensure the relevance of the mor-phological measures and the adjustments on these. It con-sists in a random grid generator, where each cell is occupied if a random uniform number between 0 and 1 is below a density parameter dR.
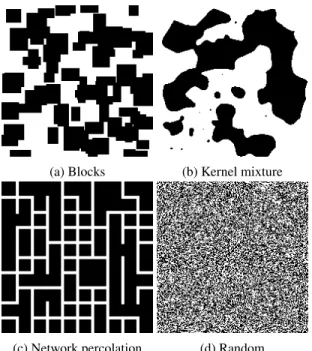
(a) Blocks (b) Kernel mixture
(c) Network percolation (d) Random
Figure 1: Examples of patterns produced by the synthetic generators.
Blocks generator The most simple “realistic” generator is similar to procedural modeling or marked point processes and distributes building blocks into the space (see Fig. 1a). Given a number NBof blocks, random positions are drawn
and block of a random height and width (with minimal value mB and maximal value MB as parameters) are placed at
these.
Kernel mixture generator Kernel mixture are a classical way to represent the spatial distribution of population den-sity in an urban area (Anas et al., 1998) (see Fig. 1b). They remain relevant at our scale, as they can be interpreted as a superposition of “density hotspots”, as can the planning or the self-organization of a district can be. Given a number of centers NK, ~x1≤j≤NK random position are drawn in the
grid, at which kernels are applied, such that si = 1di≥θK
where the density difor the point at position ~yiis given by
di= 1 NK ·X j exp (− k~xj− ~yik /dK) (1)
where dKis a range parameter giving the extent of kernels.
Network percolation model The last generator we used is based on network percolation, in the spirit of capturing the constraints imposed by flows traversing a given urban area (see Fig. 1c). While the two previous generator were based on building processes, this one relies on streets, and thus on processes linked to transportation. The idea is to link a fixed number NP of border points, which can be understood
as entrances/exits of the area. Starting with a grid network
Figure 2: Samples extracted from OpenStreetMap.
without links and nodes at a regular spatial sampling (fixed with a step of 5 units in our case), an iterative procedure (i) draws a random number and adds a random link at an empty potential link if it is smaller than a parameter called the per-colation probability pP; (ii) computes the largest connected
component of the network and the number of nodes of this component on the boundary of the world; (iii) stops if this number is equal to the parameter NP. Cells not covered by
the resulting giant component are then occupied, at the ex-ception of cells within a neighborhood LP of a link of the
giant component. This way, this component can be under-stood as a circulating area linking NP entrances and exits,
with a constraint on width through LP.
Note that our generators will be “fairly compared” in terms of calibration, as they have the same number of pa-rameters (although we do not introduce any information cri-teria that would yield the same penalization for overfitting). We show in Fig. 1 visual representations of some outputs of each generator, including a random generator (see Fig. 1d).
Results
Simulation results and real measures are available on the dataverse repository at https://doi.org/10.7910/ DVN/LGK0US. Source code is available on the git repository of the project at https://github.com/ openmole/spatialdata. The model and indicators were coded in scala langage for performance purposes. This furthermore allows a seamless integration into the Open-MOLE workflow engine for model exploration (Reuillon et al., 2013), which provides methods for numerical experi-ments (in our case sampling methods) and transparent access to high performance computation environments (model sim-ulation were run on the European Grid Infrastructure for an equivalent of one year and one month CPU time).
Real measures
We compute the morphological indicators given above on a large sample on real urban areas. For practical
compu-Class 1 Class 2 Class 3 Class 4
Figure 3: Typology applied to OpenStreetMap samples. The first class correspond mostly to a high density of linear buildings, recalling modern urbanism projects; the second disparate large buildings that can corresponds to industrials buildings in the outskirt of cities; the third disparate small buildings closer to periurban settlements; the fourth are denser and more complicated patterns evoking historical urban centers.
tational reasons, we restrain our geographical area of study to European functional urban areas as provided by Bretag-nolle et al. (2019). We expect to already have a good repre-sentativity, although not universal, of existing urban forms with this sample, as it is known that European cities al-ready have a significant morphological diversity (Le N´echet, 2015). We collect building layouts from OpenStreetMap (illustrated in Figure 2), as this source has been shown to have a good quality especially in Europe (Mooney et al., 2010). Using the osmosis tool, buildings are filtered from the openstreetmap raw dump for Europe (downloaded from http://download.geofabrik.de/in March 2019) and inserted into a Postgis database, which can then be ef-ficiently queried for a specific bounding box. Indeed, al-though the library developed provides a direct access to the OpenStreetMap API, query limitations do not allow such a systematic sampling. We sample N = 72, 000 points into polygons corresponding to urban areas, first by selecting the area with a uniform selection weighted by population of ar-eas, then by drawing uniform spatial coordinates within the polygon with a polygon sampling heuristic.
After removing the empty areas and areas with a too low (lower than 0.05) or a too high (higher than 0.8) density, we end with 17, 612 real points on which the morphological measures are computed. The effective dimension is
rela-tively low, echoing literature on urban form at other scales, as the first principal component on normalized indicators captures 70.3% of variance, the second a cumulated propor-tion of 85.9% and the third 92.8%. The order of magnitude are similar to the ones found by Schwarz (2010) for exam-ple. The first component captures low density (coefficient -0.43 for density) but clustered configurations (-0.35 for av-erage distance), confirmed by the positive influence of di-lation steps (0.44). On the contrary, the second component captures dispersed configurations (negative Moran and pos-itive average distance) with large blocks (negative dilation steps).
We obtain a broad variety of forms, measures such as the Moran index varying between 0.02 (small disparate settle-ments) to 0.93 (one huge block), with a median at 0.10 (sev-eral medium size buildings). Similarly, the number of dila-tion steps varies from 3 (narrow streets only) to 80 (mostly open spaces) with a median at 26. The mean density is 0.21, what means that around 21% of the soil is covered with building in average in the space we sampled, confirming that the most of urban areas are not dense contrary to the highly dense centers which are a minority.
To obtain typical representative points, we proceed to an unsupervised clustering on the two first principal compo-nents of these points. Using a k-means algorithm (5000
stochastic repetitions), varying the number of clusters shows an endogenous transition in the within-cluster variance pro-portion, suggesting to take k = 4. Examples within the classes are shown and commented in Fig. 3. The centroids will be used as typical objectives for model calibration.
We can also consider the distribution of these measures within sampled urban areas. Keeping the areas with more than 10 sample points, we obtain 219 areas, for which we can compute the proportion of points within each morpho-logical cluster. An Herfindhal diversity index on these pro-portions pk ∈ [0, 1] computed as h = 1 −Pkp
2 k ranges
between 0.31 and 0.75 with an average of 0.63, suggesting very different profiles of urban areas. A chi-squared test be-tween the country and a discretization with 10 levels of this diversity is not significant (p=0.7), but the diversity index negatively correlates (ρ = −0.11, Fisher 95% confidence interval [−0.24, 0.02]) with longitude, meaning that Western cities are more diverse than Eastern cities, and more slightly with latitude (ρ = 0.08 [−0.04, 0.21]).
Model simulation and calibration
A simulation experiment provides an insight into the pat-terns produced by the different generators in the morpho-logical space. We sample the parameter space using a Latin Hypercube Sampling, with 10000 points for each generator respectively, and with 100 stochastic repetitions for each pa-rameter point. This sampling is achieved with scripting the models into the OpenMOLE platform (Reuillon et al., 2013). Regarding the stochastic variability of generators, we compute for each indicator and each parameter point the sharpe ratios on repetitions, defined as the ratio between the estimated average and the estimated standard deviation. The indicators with the lowest values (high values indicate a low influence of stochastic fluctuations in comparison to varia-tions due to parameters) are Moran index with a minimum of 0.22 and a median of 4.8, and the average detour with a minimum of 0.7 and a median of 5.2 (what could have been expected for this one as it is stochastically estimated). All other indicators have minimal sharpe ratios above 1.5 and medians above 5.4, meaning that models are overall not much sensitive to stochastic fluctuations. This confirms that considering single realisations as representing one parame-ter set remains reasonable.
We turn now to the comparison of generated configura-tions with real configuraconfigura-tions. We work in the projected two dimensional space of the two first principal components of real points described above, in order to capture the maxi-mum of variability in the real point cloud rather than in the simulated one. Note that working in the full indicator space makes no sense given the effective dimensions obtained (the simulated point cloud captures 93% of variance at its third principal component, which is just a bit more than the real point cloud).
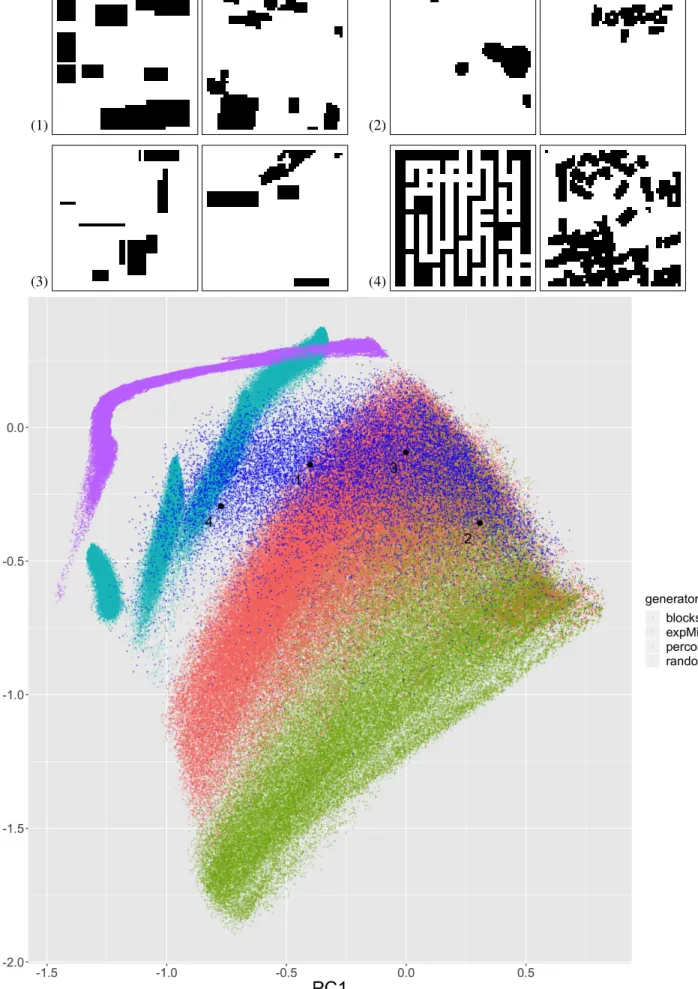
The point cloud of simulated and real points is shown in
Fig. 4. We do not plot ensemble averages but all simulated points, as discussed above regarding the low influence of stochasticity. First of all, we observe that the null model consisting in random grids is far from all other points (ex-cept a tiny fraction of the percolation generator in turquoise) and in a way describes a boundary in the projected indicator space. This control confirms the relevance of projected indi-cators and of their comparison. Then, as expected since gen-erators were conceived to capture different generative pro-cesses of the urban form, the point clouds of each generator are rather disjoint in the morphological space. The perco-lation generator produces separate clouds which correspond to different value of the link width LP parameter, and these
are disjoint from the two other generators. The exponential mixture (green) and block (red) generators do overlap in a central area, but also have their own morphological “exclu-sion zone”, where the forms can not be generated by other generators considered here.
When looking at the real point cloud, we see that most of it is covered by some generated points, and that generators are complementary to approach all covered points. This is an important result in line with the targeted complementarity of generative processes, and advocates for multi-modeling in urban morphogenesis. Interestingly, there is an area not cov-ered, corresponding to the transition between the percolation generator (narrow streets) and the block generator.
For each centroid of the clusters in the real point cloud described above, that can be considered as a typical calibra-tion objective, we provide example of the closest real con-figuration and the closest simulated one. Visually, forms are rather satisfying, at the exception of the percolation genera-tor fitting a complicated urban center. Indeed, this centroid (number 4) is at the boundary of the percolation point cloud, and the real point cloud is more difficultly captured in this area compared to the block and mixture generators.
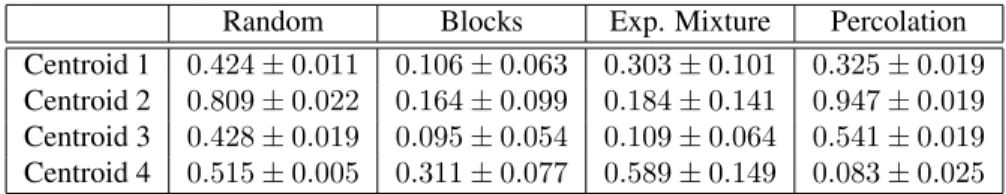
To quantify the level of calibration of each generator re-garding each centroid, and in average rere-garding stochastic repetitions, we provide in Table 1 the aggregated minimal values of distances, for each generator and each calibration objective, with their standard deviations. This mainly con-firms the previous results, with however interesting varia-tions: (i) for the second centroid, the exponential mixture is in average no longer the best, and furthermore has a higher variability; (ii) centroid three and four are the easiest to reach, despite the latest being in the boundary; (iii) the per-colation generator performs well on this point and has a very low variability.
This experiment has therefore shown the possibility to calibrate the generative models on morphological measures against real configurations, and furthermore unveils their complementarity to approach the diverse existing forms.
(1) (2)
(3) (4)
Figure 4: Comparison of real morphologies with patterns produced by the synthetic generators. All points are projected into the first two components computed on the real measures only. Points in dark blue correspond to real configurations. The type of generator is given by the color in legend. Dark circle correspond to the centroids of clusters on which the calibration is done, their number giving the corresponding configurations shown above. For each, we successively show the best synthetic configuration ((1) block generator with NB= 12, mB= 5, MB = 12, (2) exponential mixture generator with NK = 6, dK=
3.8, θK = 0.42, (3) block generator with NB = 11, mB = 1, MB = 14, (4) percolation generator with pP = 0.35, NP =
Random Blocks Exp. Mixture Percolation Centroid 1 0.424 ± 0.011 0.106 ± 0.063 0.303 ± 0.101 0.325 ± 0.019 Centroid 2 0.809 ± 0.022 0.164 ± 0.099 0.184 ± 0.141 0.947 ± 0.019 Centroid 3 0.428 ± 0.019 0.095 ± 0.054 0.109 ± 0.064 0.541 ± 0.019 Centroid 4 0.515 ± 0.005 0.311 ± 0.077 0.589 ± 0.149 0.083 ± 0.025
Table 1: Aggregated distance in the morphological space, for each generator and each calibration objective (real clusters centroids). Euclidian distance in the projected space are aggregated in average on stochastic repetitions, and the minimal average value is reported with its standard deviation.
Discussion
Our approach provides a first step towards systematic mod-eling of generative processes of urban form at large scales. Some direct limitations could be tackled in a short term. Testing slightly different processes and heuristics in gener-ator may be a way to cover the part of the real point cloud which is missed by our generators. As it seems correspond to complicated urban centers, it may be however compli-cated without more elaborated models. Also, we did not use minimization algorithms to calibrate the generators, and the and a further step would consist in checking the robustness of our result using such optimization heuristics (genetic al-gorithms for example), but also diversity alal-gorithms such as pattern space exploration proposed by Ch´erel et al. (2015), to ensure the effective feasible space of each generator.
This work can also be extended in several ways. First of all, we focused on the built environment but neglected trans-portation infrastructures, whereas spatial network morpho-genesis models have been proposed for example by Cour-tat et al. (2011) or Raimbault (2018b) in a multi-modeling approach. Taking into account multiple dimensions of the urban system is an important extension and hybrid models such as co-evolution models (Raimbault et al., 2014) should be investigated. Our approach can also be a preliminary step towards the study of urban sustainability issues, for example the relations between urban form and energy consumption (Le N´echet, 2015). Extending the generators with the third dimension, i.e. taking into account building heights as done by Brasebin et al. (2017), could also be an important com-ponent for the study of local energy efficiency.
Furthermore, we tested the complementarity of generators only in a static way. Adaptive and dynamic generators, com-bining processes of different nature within the same model with an endogenous switching or combination, would be an important direction to better understand urban morphogen-esis. In the same context, the generators compared here had all the same number of parameters, but richer gener-ators implying different numbers would require the use of information criterions to avoid overfitting, which, however, remains an unsolved issue for such generative simulation models (Piou et al., 2009).
Finally, as extensively reviewed above, the way to
quan-tify urban form strongly depends on the scale considered. A more integrative understanding of it would require multi-scale approaches able to relate these different definition and measures within a single multi-scalar framework.
Conclusion
We have proposed here a new insight into the generative sim-ulation of urban morphologies at large scales, namely the scale of the district considering the layout of buildings. Af-ter computing morphological measures on a large sample of real urban areas, we showed the complementarity of differ-ent generators capturing various aspects of urban morpho-genesis processes. Despite not implying generative agents (developers, inhabitants, companies) and thus staying close to procedural modeling, this work however paves the way towards a more systematic understanding of generative pro-cesses of urban form at this scale.
Acknowledgements
Results obtained in this paper were computed on the vo.complex-system.eu virtual organization of the European Grid Infrastructure ( http://www.egi.eu ). We thank the European Grid Infrastructure and its supporting National Grid Initiatives (France-Grilles in particular) for provid-ing the technical support and infrastructure. This work is part of DynamiCity, a FUI project funded by BPI France, Auvergne-Rhˆone-Alpes region, Ile-de-France region and Lyon metropolis.
References
Achibet, M., Balev, S., Dutot, A., and Olivier, D. (2014). A model of road network and buildings extension co-evolution. Pro-cedia Computer Science, 32:828–833.
Anas, A., Arnott, R., and Small, K. A. (1998). Urban spatial struc-ture. Journal of economic literature, 36(3):1426–1464. Batty, M. and Longley, P. A. (1987). Fractal-based description of
urban form. Environment and planning B: Planning and De-sign, 14(2):123–134.
Boeing, G. (2018). Measuring the complexity of urban form and design. URBAN DESIGN International, 23(4):281–292. Bonabeau, E. (1997). From classical models of morphogenesis
to agent-based models of pattern formation. Artificial life, 3(3):191–211.
Brasebin, M., Chapron, P., Ch´erel, G., Leclaire, M., Lokhat, I., Perret, J., and Reuillon, R. (2017). Apports des m´ethodes d’exploration et de distribution appliqu´ees `a la simulation des droits `a bˆatir. In Spatial Analysis and GEOmatics 2017. Bretagnolle, A., Guerois, M., and Pavard, A. (2019). Following
the population of european urban areas in the last half century (1961-2011): the tradeve database. Forthcoming in Cybergeo, European Journal of Geography.
Ch´erel, G., Cottineau, C., and Reuillon, R. (2015). Beyond corrob-oration: Strengthening model validation by looking for unex-pected patterns. PLoS ONE, 10(9):e0138212.
Courtat, T., Gloaguen, C., and Douady, S. (2011). Mathematics and morphogenesis of cities: A geometrical approach. Physical Review E, 83(3):036106.
Cruz, C., Kirley, M., and Karakiewicz, J. (2017). Generation and exploration of architectural form using a composite cellular automata. In Australasian Conference on Artificial Life and Computational Intelligence, pages 99–110. Springer. Doursat, R., Sayama, H., and Michel, O. (2012).
Morpho-genetic engineering: toward programmable complex systems. Springer.
Epstein, J. M. (1999). Agent-based computational models and gen-erative social science. Complexity, 4(5):41–60.
Fumega, J., Niza, S., and Ferr˜ao, P. (2014). Identification of urban typologies through the use of urban form metrics for urban energy and climate change analysis.
Gauthier, P. and Gilliland, J. (2006). Mapping urban morphology: a classification scheme for interpreting contributions to the study of urban form. Urban Morphology, 10(1):41.
Herold, M., Goldstein, N. C., and Clarke, K. C. (2003). The spa-tiotemporal form of urban growth: measurement, analysis and modeling. Remote sensing of Environment, 86(3):286– 302.
Horner, M. W. (2007). A multi-scale analysis of urban form and commuting change in a small metropolitan area (1990–2000). The Annals of Regional Science, 41(2):315–332.
Kropf, K. (2009). Aspects of urban form. Urban Morphology, 13(2):105.
Le N´echet, F. (2015). De la forme urbaine `a la structure m´etropolitaine: une typologie de la configuration interne des densit´es pour les principales m´etropoles europ´eennes de lau-dit urbain. Cybergeo: European Journal of Geography. Liu, X., Liang, X., Li, X., Xu, X., Ou, J., Chen, Y., Li, S., Wang,
S., and Pei, F. (2017). A future land use simulation model (flus) for simulating multiple land use scenarios by coupling human and natural effects. Landscape and Urban Planning, 168:94–116.
Merrell, P., Schkufza, E., and Koltun, V. (2010). Computer-generated residential building layouts. In ACM Transactions on Graphics (TOG), volume 29, page 181. ACM.
Mooney, P., Corcoran, P., and Winstanley, A. C. (2010). Towards quality metrics for openstreetmap. In Proceedings of the 18th SIGSPATIAL international conference on advances in geo-graphic information systems, pages 514–517. ACM.
Moosavi, V. (2017). Urban morphology meets deep learning: Ex-ploring urban forms in one million cities, town and villages across the planet. arXiv e-prints, page arXiv:1709.02939. Moudon, A. V. (1997). Urban morphology as an emerging
inter-disciplinary field. Urban morphology, 1(1):3–10.
Newman, P. and Kenworthy, J. (2000). Sustainable urban form: the big picture. Achieving sustainable urban form, pages 109– 120.
Parish, Y. I. H. and M¨uller, P. (2001). Procedural modeling of cities. In Proceedings of the 28th Annual Conference on Computer Graphics and Interactive Techniques, SIGGRAPH ’01, pages 301–308, New York, NY, USA. ACM.
Pesaresi, M. and Bianchin, A. (2003). Recognizing settlement structure using mathematical morphology and image texture. Remote sensing and urban analysis: GISDATA, 9:46–60. Piou, C., Berger, U., and Grimm, V. (2009). Proposing an
in-formation criterion for individual-based models developed in a pattern-oriented modelling framework. Ecological Mod-elling, 220(17):1957–1967.
Raimbault, J. (2018a). Calibration of a density-based model of urban morphogenesis. PloS one, 13(9):e0203516.
Raimbault, J. (2018b). Multi-modeling the morphogenesis of trans-portation networks. In Artificial Life Conference Proceed-ings, pages 382–383. MIT Press.
Raimbault, J. (2018c). An urban morphogenesis model captur-ing interactions between networks and territories. In Math-ematics of Urban Morphogenesis, D’Acci L., ed. Springer Birkhauser Mathematics.
Raimbault, J., Banos, A., and Doursat, R. (2014). A hybrid net-work/grid model of urban morphogenesis and optimization. In 4th International Conference on Complex Systems and Ap-plications, pages 51–60.
Reuillon, R., Leclaire, M., and Rey-Coyrehourcq, S. (2013). Open-mole, a workflow engine specifically tailored for the dis-tributed exploration of simulation models. Future Generation Computer Systems, 29(8):1981–1990.
Rode, P., Keim, C., Robazza, G., Viejo, P., and Schofield, J. (2014). Cities and energy: urban morphology and residential heat-energy demand. Environment and Planning B: Planning and Design, 41(1):138–162.
Schwarz, N. (2010). Urban form revisited—selecting indicators for characterising european cities. Landscape and Urban Plan-ning, 96(1):29 – 47.
Serra, J. (1983). Image analysis and mathematical morphology. Academic Press, Inc.
Watson, B., M¨uller, P., Veryovka, O., Fuller, A., Wonka, P., and Sexton, C. (2008). Procedural urban modeling in practice. IEEE Computer Graphics and Applications, 28(3):18–26. Webster, C. (1995). Urban morphological fingerprints.
Environ-ment and Planning B: Planning and design, 22(3):279–297. Ye, Y. and Van Nes, A. (2014). Quantitative tools in urban
mor-phology: Combining space syntax, spacematrix and mixed-use index in a gis framework. Urban morphology, 18(2):97– 118.