13
Analyzing of goals scoring pattern in the 21th world cup soccer tournament
held in Russia.
Bouchehida kheireddine1;Tafiroult billel2; Ould hammou mustapha3
1 doctoral student, M'hamed Bougara university; Boumerdes, Algeria, k.bouchhida@univ-boumerdes.dz.
2 senior lecturer A,M'hamed Bougara university; Boumerdes, Algeria, billalfoot@yahoo.com.
3 senior lecturer A,M'hamed Bougara university;
BoumerdesAlgeria,ouldhammou@gmail.com
Laboratory of science and techniques of physical activities and sports, university of Algeria
ARTICLE INFORMATION Original Research Paper Received :11/09/2019 Accepted :15/10/2019 Published :01/12/2019 Keywords : Football. Match analysis. FIFA world cup. Goals scoring pattern.
Abstract
The aim of this study was to record and evaluate the characteristics of successful pattern of goals scored during the 2018 soccer world cup tournament held in Russia compared the 2014 world cup held in brazil. The examination of 169 goals scored in 64 games was conducted with the aid of video-analysis’ software Nacsport scout plus. The statistical analysis was conducted with the non-parametric chi-square test. Results showed that there are no statically significant differences between goals scoring frequency per 45 minutes (X2= 0.316 p<0.05) and per 15 minutes periods (X2= 0.237 p<0.05) between the world cup 2014 and the world cup 2018.There is no statically significant difference between the first goal impact in the match on the match outcome (X2= 0.930 p<0.05) and between the area from the goals were scored (x2=0.159, p>0.05).There is a statistically significant difference in scoring from open play (X2=0.03, p>0.05).there is a statically significant difference in scoring after an exceptional effort (X2=0.00, p>0.05), and after a direct free kick (X2=0.04, p>0.05).The present results allow coach to know the latest strategies in soccer and goals scoring pattern in the international tournaments and gain valuable information that help him to improve their team offence performance and also defense performance. Corresponding author:
Bouchehida kheireddine e-mail: k.bouchhida@univ-boumerdes.dz.
Bouchehida kheireddine; Tafiroult billel; Ould hammou mustapha
1. Introduction
FIFA soccer world cup it is likely the most popular sporting event in the world, drawing billions of television viewers every tournament (The Editors of Encyclopaedia Britannica, 2018). sixty-four nation compete for the title every four years, in the recent years teams has been a remarkable development in physical, technical, tactical and psychological aspects as a result of conducting various researches and studies and building training operations on the basis of science and the use of proper planning in the preparation of teams, and this is demonstrated by the teams participating in the World Cup by a huge volume of motor activity and speed in performance and high accuracy in the implementation of offensive strategies. In soccer the main goal of each team participating in the championship is only to win, and that can only be achieved by the attack and Soccer match analysis is one of the most important means that drive tactic training process forward and develop it, because it is an effective means to increase the level of performance by identifying the negatives and positive aspects of the team's performance through insightful vision. As coaches are prone to making subjective judgments and may be unable to recall events reliably, they are increasingly turning to match analysis as a way of optimizing the training process of their players and teams (Hughes, 2004)
Informed study and conscious observation of all the secrets of different individual and collective activities to identify weaknesses and strengths. In this way, it creates a perception of the nature of the performance of the team and the ability to compare the level between the teams, or team comparison to itself, or compare several teams with other teams participating in different tournaments.
Soccer match analysis is vital in soccer if the individual/team is to be successful. For many soccer coaches the information gained from performances will not only form the basis of weekly training schedules, but also may act as the primary source for the scheduling of seasonal plans (Carling et al., 2005). given the importance of analysis in football and its role in determining the effort and weakness of team’s performance, offensive performance were analyzed in many previous studies (Thomas et al., 2017; Lago-Peñaset al., 2010; Ruscello, 2009; Sie, 2015), as well soccer world cup was a rich topic that studied in many previous time.
Analysis of the match in football fills the gap between theory and training. It can be used by coaches, sports researchers and fitness trainers, as well as
15
can be used such as a feed back to the players to improve the playing strategies and athletic ability.
Given the importance of goals to determine the winner, this study therefore aimed at quantify and analyzing the scoring goals pattern in the
21th soccer world cup and deriving some updates that coaches need to focus
in training and games. 1. Method and Materials 2.1. Sample:
Sixty-four (64) soccer games from the 21th FIFA World Cup held in Russia were studied. In which a total of 169 goals has been scored, without including the goals achieved during the penalty process.
2.2. Materials
The examination of the 64 games from the 21th World Cup in Russia was conducted with the aid of video-analysis’ software Nacsport scout plus. 2.3. Design and Procedure:
Every goal has been analyzed by two experienced observers who were specially trained for the accurate and reliable data recording
The analysis variables were:
№ Variables Description Reference
01 Goals time
A-number of goals achieved in
each half including the extra time:
1. First half. 2. Second half. 3. Extra time.
(Sponsor, 2007)
B-number of goals achieved
per periods of 15 minutes: 1. 0-15. 2. 16-30. 3. 31-45. 4. 1st extra time. 5. 45-60. 6. 61-75. 7. 76-90. 8. 2nd extra time.
(Werlayne Stuart Soares, 2013)
Bouchehida kheireddine; Tafiroult billel; Ould hammou mustapha
02
First goal impact on the game outcome for the
scoring team
A- Impact of the first goal on
the match outcome. • Win. Draw. Defeat
(Yiannis, 2014a), (Y. Michailidis et al., 2013)
03 Area from which the goal was scored
1. Goal area. 2. Penalty area.
3. Outside the penalty area.
(Njororai, 2013) (Vasilis Armataset al., 2007a)
04
Type of the offense that ended with a goal
scoring
1. Set play.
2. Organize offense. 3. Counter attack.
(Yiannakos and Armatas 2006)
(Charalampos, et al., 2013)
05
Action before the goals were scored. 1. Pass ≤10 m. 2. Pass ≥10 m. 3. Goalkeeper mistake. 4. Goalkeeper rebound. 5. Defender mistake. 6. Defender rebound. 7. Left corner. 8. Right corner. 9. Left cross. 10. Right cross. 11. Header. 12. Exceptional effort. 13. Direct free kick. 14. Indirect free kick. 15. Throw in.
(Yiannakos and Armatas, 2006a)
(Charalampos et al., 2013)
2.4. Statistical Analysis
All data were analyzed using the statistical package for PC SPSS 25.0 (Lead Technologies Inc, USA). Non-parametric chi-square (X2) analysis was used to determine the statistically significant differences and the level of significance was set at (p<0.05).
2. Results
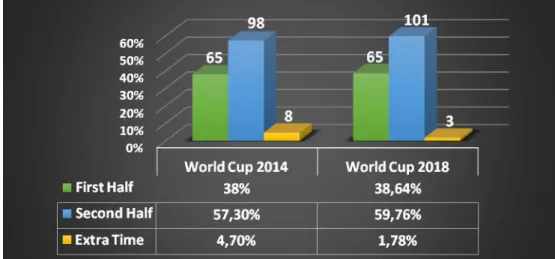
From the figure (1a) datashowed that themajority of goals were scored in the second half (98 goals) with a rate of 57.30% in world cup 2014 and (101) goals with a rate of 59.76% in the 2018 world cup.As for the number of goals scored in the first half, the results showed that there are an equal number of goals 65 goals in each tournament with a slight difference in the scoring rate 57.30% In the 2014 championship and 59.76% in the 2018 championship, while the lowest scoring rate was in the extra time half’s
17
with (8) goals with a rate of 4.70% and (3) goals with a rate of 1.78%respectively.there is no statically significant difference between goals scoringfrequency per 45 minutes between the world cup 2014 and the world cup 2018(X2= 0.316 p<0.05).
Figure (01a): scoring frequency per 45 minutes.
Source: all 2014 world cup data was obtained and modified from Michailidis Yiannis (2014).
Figure )01b) presents the frequency of goals divided per periods of 15 minutes, the results showed that the highest rate of goals were scored between the 76th to 90th period in each tournament (41) goals with a rate of 23.97% in world cup 2014 and (37) goals with a rate of 21.90%in world cup 2018, there is no statically significant difference between goals scoringfrequency per 15 minutes between the world cup 2014 and the world cup 2018 (X2= 0.237 p<0.05).
Bouchehida kheireddine; Tafiroult billel; Ould hammou mustapha
Figure (01b): scoring frequency per periods of 15 minutes.
Source: all 2014 world cup data was obtained and modified from Michailidis Yiannis (2014).
Figure (02) shows the impact of the first goal on the match statue. From the total of 57 games that scored goals in world cup 2014 and from the total of 63 games that scored goals in world cup 2018 the team who scored first win in (43) games with a rate of 75.44% and in (46) games with a rate of (73.01%) respectively, draw in (6) games with a rate of (10.53%) and in (8) games with a rate of (12.70%) respectively . and defeat in 8 games with a rate of (14.04%) and in (9) games with a rate of (14.29%) respectively.The data show that there is no statically significant difference between the first goal impact in the match on the match outcome (X2= 0.930 p<0.05).
19
Figure 02: first goal impact on match outcome.
Source: all 2014 world cup data was obtained and modified from Michailidis Yiannis (2014).
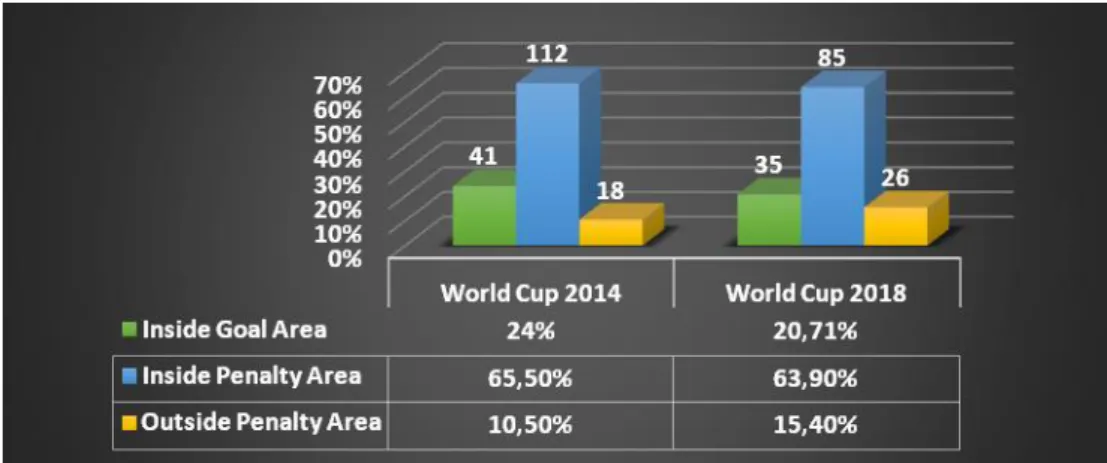
The data in figure (03)showed that the majority of goals were scored from the inside the penalty area (112) with a rate of65.50% in world cup 2014 compared tothe (85) goals with a rate 63.90% in the world cup 2018,(41) goals with a rate of 24% and (35) goals with a rate of 20.71% from the inside of penalty area respectively, and (18) goals with a rate of 10.50% and (26) goals with a rate of 15.40% from outside the penalty area, data analysis showed that there is no statically significant difference between goal scoring area (x2=0.159, p>0.05).
Bouchehida kheireddine; Tafiroult billel; Ould hammou mustapha
Figure 03: goals scoring area.
Source: all 2014 world cup data was obtained and modified from Michailidis Yiannis (2014).
Figure 04 exhibit the type of offense ended with goals, results show that the majority of goals scored in the world cup 2014 were from an open play (108) goals with a rate of 63.16%, followed by scoring after a set play (47) goals with a rate of 27.48%, and (11) goals from counter attack with a rate of 6.43%, and 5 own goals with a rate of 2.91%,as for the 2018 world cup the data show that majority of goals were scored after an open play (79) goals with a rate of 47.74%, followed by scoring after a set play (65) goals with a rate of 38.50%, (13) goals from counter attack with a rate of 7.69% and 12 own goals with a rate of 7.10%,there is a statistical significant difference in scoring from open play between the world cup 2014 and the world cup 2018 (X2=0.03, p>0.05).
21
Figure 04: type of offense ended with goals scoring.
*denotes significant difference with the world cup 2014(p<0.05).
Source: all 2014 world cup data was obtained and modified from Michailidis Yiannis (2014).
Figure (05) exhibit the frequency of action before goals were scored, data analysis showed thatthere is a statically significant difference in scoring after goal keeper ball rebound between the 2014 world cup and 2018 world cup (X2=0.03, p>0.05), after deffence ball rebound (X2=0.01, p>0.05), after an exceptional effort (X2=0.00, p>0.05), and after a direct free kick (X2=0.04, p>0.05).All other actions had no statically significant difference.
Bouchehida kheireddine; Tafiroult billel; Ould hammou mustapha
Figure 05: Action before goal scoring. Tournament
ACTION
World Cup 2014 World Cup 2018
N FR N FR Pass ≤ 10m 32 18.70% 25 17.12% pass ≥ 10m 38 22.22% 31 21.23% GK mistake 1 0.60% 4 2.73% GK rebound 11* 6.40% 3 2.05% Defence Rebond 3 1.80% 13* 8.90% Defence mistake 4 2.30% 3 2.05% Left corner 7 4.10% 11 7.53% Right corner 5 2.90% 5 3.42% Left cross 12 7% 10 6.85% Right cross 10 5.80% 8 5.45% Header 9 5.30% 8 5.48% Exceptional effort 18* 10.50% 1 0.68%
Direct free kick 15 8.80% 28* 4.10%
indirect free kick 5 2.90% 12 8.21%
Throw In 1 0.60% 6 4.10%
Source: all 2014 world cup data was obtained and modified from Michailidis Yiannis (2014).
N: Number of goals. FR: frequsency.
Figure 05: Action before goal scoring.
0,00% 10,00% 20,00% 30,00%
World Cup 2014 World Cup 2018
32 25 38 31 1 4 + 11 3 3 * 13 47512109 31151088 + 18 1 15 6 5 * 12 1 6
pass ≤ 10m pass ≥ 10m GK mistake GK rebound
Defence Rebond Defence mistake Left corner Right corner
Left cross Right cross Header Exeptional effort
Direct free kick indirect free kick Throw In
*denotes significant difference with the world cup 2014(p<0.05). +denotes significant difference with the world cup 2018(p<0.05).
23 Discussion
From 169 goals scored in the 21th soccer world cup held in Russia with an average of 2.64 goal per game and 171 goals scored in 20thsoccer world cup held in brazil with an average of 2.67 goal per game, The results showed that the majority of goals were scored in the second half(98)goalswith a rate of 57.30% and (101)goals with a rate of 59.76% respectively.the result alsoshowed that the most goals were scored in the last quarter of the games from 76thminutesto the 90thminutes in both tournaments (41) goals with a rate of 23.97% in 2014 world cup and (37) goals with a rate of 21.9% in 2018 world cup. These results are in agreement with those of other researchers collected from international soccer tournaments (Yiannakos and Armatas, 2006;Armataset al., 2007;Mingotti, 2014). In the 2010 world cup soccer tournament held in South Africa (Njororai, 2013) found that the highest frequency of the goals was scored in the second half of the match specially at the end of the second half of the games, According to the author, the increased scoring towards the end of the second half of matches is attributed to good or poor physical condition, lack of concentration in defense due to mental and physical fatigue and all or nothing efforts to decisively influence match outcome.In 2016 European Football Championship the rate of goals scored in the first half was 35,2% and the rate of goals scored in the second half was 64,8%, the reasons for this may be the fact that players are more concentrated in the 61-75th minutes of the game, substitute players getting into the game show a good performance and the tactical mentality of the team (Cebi, et al., 2016).Another study by Werlayne Stuart Soares Leite found through studying 2208 goals scoring in all world cup championships from 1930 to 2010 that the highest incidence of the goals was found during the final 15 minutes, between the 76th and 90th minute (433) goals With a rate of 19.61%, Given these results, the author confirmed that physical performance should directly interfere in the technical, tactical and psychological performance of a team, with the highest incidence of goals in the final 15 minutes of the game associated mainly to the drop in physical performance. This clearly shows the importance of physical fitness for good performance of a soccer player during the game, so that he can quickly achieve technical and tactical actions, performing well throughout the game without a performance drop (Werlayne Stuart Soares, 2013).
The second variable was the impact of the first-goal for the team that scores it on the match outcome,the result show that there are no statically
Bouchehida kheireddine; Tafiroult billel; Ould hammou mustapha
significant differences between the two championships, the team who scored first win in the games with a high proportion ,similar results founded from studying the European Championship 2012 by (Y. Michailidis et al., 2013), the reason for this is the team who conceded the first goal become less concentrated and psychologically affected whereas the scored team become more confidence and maintain the advantage for the latest minutes, and whenever the first goal is late the winning percentage was high. because after achieving a goal the coaches change their tactics and give more defensive orientation in their team (Y. Michailidis et al., 2013).
As for the area of goals were scored, we found that the lowest rate of goals scored were from outside of the penalty area (18 goals) with a rate of 10.50%in 2014 world cup and also in the 2018 world cup (26) goals with a rate of 15.40%. The reason for the weakness of scoring rate from outside the penalty area is the low frequency of shooting from this area because of the defense zone strategy that close the space in front the strikers. As well the rate of scoring from the goal area, these findingsare because this area is closed to goalkeeper and also it has a numerical density of defenders. regarding the increasing of goal scoring rate from the penalty area many studies found the same results (Njororai, 2013;Yiannis,2014a; Armatas et al., 2007;Y. Michailidis et al., 2013;Yiannakos and Armatas, 2006;Charalampos
et al., 2013), This finding was expected because the penalty area is close to
goalpost and enough far away from the goalkeepers scope (C. Michailidiset al.,2004).
In this study results showed a decrease in scoring rate from open play (79) goals with a rate of 46.74% in 2018 world cup compared to (108) goals with a rate of 63.16% scored in 2014 world cup, while the results showed an increase in scoring rate from set play in the 2018 world cup compared the 2014 world cup, a study that examined the patterns of goals scored in Euro 2012, (Leite, 2013) found the a similar result, 53.95% of goals were scored from organize offense, 17.10% from counter attack, and 28.95 % from set play, this result show the efficiency of scoring from set play Infootball offence, and confirmed the participation of set-plays in winning in modern soccer. The above lead us to the conclusion that coaches should focus on set-plays both on offensive and defensive aspect of them so as utilize the advantages that seem to appear (V. Armataset al.,2007). and what is noticeable in this tournament is the high proportion of own goals 12 goals
with a rate of 7.10%compared to the 2.92% in the 2014 world cup, and the
25
2013), The reason for this is the bad placement of defendersin front of the goalkeeper and their poor handling of shots on target, corner kicks and indirect free kick because of lack focus and physiology demand in the end of the games.
From analyzing the action before the goals were scored, the result show that the majority of goals was scored after a long pass (38) goals with a rate of 22.22% in 2014 world cup and (31) goals with a rate of 21.23% in 2018 world cup. according to (Yiannis, 2014) the reason of that is defenders make more mistakes because they observed the player with the ball and not the players that moving inside penalty box.
through our study the results showed an increase in the percentage of scoring after deffence ball rebound (13) goals with a rate of 8.9 compared to the 2014world cup (3) goals with a rate of1.80%. The reason for this is the placement of the defenders inside the penalty area and front the goalkeeper, after a shot or header the ball collide the defenses player and change their direction to other point of goal and from away the goalkeeper.
as for the scoring after Exceptional effort the result show a low frequency in the 2018 world cup held in Russia (1) goal with a rate of 0.68% while reaching (18) goals with a rate of 10.50% in 2014 soccer world cup in brazil (Yiannis, 2014), 14.5% in 2012 European championship (Y. Michailidis et al., 2013), 17.1% in 2004 European championship (Yiannakos and Armatas, 2006) and also in 2009/2010 UEFA champions league season with a rate of 9.38% (Charalampos et al., 2013). The reason for this is in the modern football coach prefer passes and combination play over an individual attack in the offensive third of the pitch.
3. Conclusion
The present results allow coach to know the latest strategies in soccer and goals scoring pattern in the international tournaments and gain valuable information that help him to improve their team offence performance and also defense performance, through this results coaches should pay more attention to the physical aspect and develop appropriate strategies can help players to gain more physiological demand and less time to recovery, and use the substitute players to the fullest way.
Regarding the importance of shooting to the psychological aspect and goals scoring, coaches must work on shooting from outside the penalty area, exercises should perform from different distance and different situation including the defenders and minefields players.
Bouchehida kheireddine; Tafiroult billel; Ould hammou mustapha
In modern football the individual effort is one of the important skills to scoring goals particularly against the zone defense strategies, coaches must develop different exercise and encouraging the players to dribbling and shooting under pressure with the two feet and follow the balls rebound from goal keeper.
References :
Armatas, V., Yiannakos, A., Papadopoulou, S., & Galazoulas, C. (2007). Analysis of the set-plays in the 18th football World Cup in Germany.
Physical Training, 1-7.
Carling, C., Education, P., Behaviour, M., Federations, N., Sciences, E., & Commission, W. (2005). Handbook of Soccer Match Analysis.
https://doi.org/10.4324/9780203448625
Cebi, M., Elioz, M., Islamoglu, I., & Yamak, B. (2016). 2016 EUROPEAN FOOTBALL CHAMPIONSHIP GOAL ANALYSIS Mehmet Cebi, Murat Elioz, Izzet Islamoglu, Bade Yamak, 10(31), 1–13.
Charalampos, M., Yiannis, M., & Michalis, M. (2013). Analysis of Goals Scored Sc Ored in the Uefa Champions Cha Mpions League in the Period. Serbian Journal of Sports Sciences, 7(2), 51–55.
Hughes, M. (2004). Notational analysis – a mathematical perspective.
International Journal of Performance Analysis in Sport, 4(2), 97–139.
https://doi.org/10.1080/24748668.2004.11868308
Lago-Peñas, C., Lago-Ballesteros, J., Dellal, A., & Gómez, M. (2010). Game-related statistics that discriminated winning, drawing and losing teams from the Spanish soccer league. Journal of Sports Science and
Medicine, 9(2), 288–293.
Leite, W. S. S. (2013). Euro 2012: Analysis and Evaluation of Goals Scored.
International Journal of Sports Science, 3(4), 102–106.
https://doi.org/10.5923/j.sports.20130304.02
Michailidis, C., Michailidis, I., Papaiakovou, G., & Papaiakovou, I. (2004). Analysis and evaluation of way and place that goals were achieved during the European Champions League of Football 2002-2003. Sports
Organization, 2(1), 48–54.
Michailidis, Y., Michailidis, C., & Primpa, E. (2013). Analysis of goals scored in European championship 2012. Journal of Human Sport and
Exercise, 8(2 SUPPL), 367–375.
https://doi.org/10.4100/jhse.2012.82.05
27
World Cup. arXiv preprint arXiv:1408.5442.
Njororai, W. W. S. (2013). Analysis of goals scored in the 2010 world cup soccer tournament held in South Africa. Journal of Physical Education
and Sport, 13(1), 6–13. https://doi.org/10.7752/jpes.2013.01002
Ruscello, B. M. (2009). Match analysis in team sports. Faculty of Medicine
and Surgery, Doctoral d, 543.
Sie, N. (2015). Fakultät für Humanwissenschaften Performance Analysis of Sport ( IMPAS ), (April), 1–32.
Sponsor, O. (2007). P hysical T raining Jan 2007 Goal scoring patterns over the course of a match : Analysis of Women ’ s high standard soccer, 1– 9.
The Editors of Encyclopaedia Britannica. (2018). world cup. In
Encyclopædia Britannica. Encyclopædia Britannica, inc. Retrieved
from https://www.britannica.com/sports/World-Cup-football Thomas, C., Fellingham, G., & Vehrs, P. (2017). Development of a
Notational Analysis System for Selected Soccer Skills of a Women College Team Development of a Notational Analysis System for
Selected Soccer Skills of a Women ’ s College Team, 7841(November). https://doi.org/10.1080/10913670902812770
Werlayne Stuart Soares. (2013). Analysis of Goals in Soccer World Cups and the Determination of the Critical Phase of the Game. Physical
Education and Sport, 11(3), 247–253.
Yiannakos, A., & Armatas, V. (2006). Evaluation of the goal scoring patterns in European Championship in Portugal 2004. International
Journal of Performance Analysis in Sport, 6(1), 178–188.