HAL Id: hal-00873282
https://hal.inria.fr/hal-00873282
Submitted on 15 Oct 2013HAL is a multi-disciplinary open access archive for the deposit and dissemination of sci-entific research documents, whether they are pub-lished or not. The documents may come from teaching and research institutions in France or abroad, or from public or private research centers.
L’archive ouverte pluridisciplinaire HAL, est destinée au dépôt et à la diffusion de documents scientifiques de niveau recherche, publiés ou non, émanant des établissements d’enseignement et de recherche français ou étrangers, des laboratoires publics ou privés.
Ship-Hull Design Based on a BEM-Isogeometric Solver
Alexandros Ginnis, Régis Duvigneau, Constantinos Politis, Konstantoulakis
Kostas, Kostas Bellibassakis, Theodoros Gerostathis, Panagiotis Kaklis
To cite this version:
Alexandros Ginnis, Régis Duvigneau, Constantinos Politis, Konstantoulakis Kostas, Kostas Bellibas-sakis, et al.. A Multi-Objective Optimization Environment for Ship-Hull Design Based on a BEM-Isogeometric Solver. 5th International Conference on Computational Methods in Marine Engineering, May 2013, Hamburg, Germany. �hal-00873282�
A MULTI-OBJECTIVE OPTIMIZATION ENVIRONMENT
FOR SHIP-HULL DESIGN BASED ON A
BEM-ISOGEOMETRIC SOLVER
A.-A.I GINNIS∗, R. DUVIGNEAU†, C. POLITIS‡, K. KOSTAS‡,
K. BELIBASSAKIS∗, T. GEROSTATHIS‡ AND P.D. KAKLIS∗
∗School of Naval Architecture & Marine Engineering
National Technical University of Athens (NTUA) 9 Heroon Polytechneiou, Zografou 15773, Athens, GREECE e-mail: [email protected], web page: http://www.naval.ntua.gr/
†INRIA Sophia-Antipolis M´editerran´ee
Projet team OPALE
2004 route des Lucioles, 06902 Sophia-Antipolis, FRANCE e-mail: [email protected] web-page: http://team.inria.fr/opale/ ‡Department of Naval Architecture Faculty of Technological Applications
Technological Educational Institute of Athens (TEI-Athens) Agiou Spyridonos, 12210 Aigaleo, Athens, GREECE e-mail: [email protected] web-page: http://www.na.teiath.gr/
Key words: Computer Aided Ship Design, Ship Parametric Model, Isogeometric Anal-ysis (IGA), Optimization, Wave Resistance
Abstract. We present a ship-hull optimization environment integrating modern opti-mization techniques, a parametric ship-hull model and a novel BEM solver for the cal-culation of ship wave resistance. The environment is tested for a pair of optimization scenarios (local/global) for a container ship.
1 INTRODUCTION
Due to an increasing demand for efficiency and robustness in Computer Aided Ship Design (CASD), the available modelling, analysis and evaluation techniques are being continu-ously pushed forward so that they can provide measurable improvements for both the design process and the resulting product. Fortunately, the current availability of com-puting power has allowed the employment of sophisticated Computation Fluid Dynamic (CFD) solvers and their coupling with advanced Geometric Modeling techniques and Op-timization strategies, a combination that offers significant aid to meet the demanding requirements of contemporary CASD.
The optimization of a hull-form with respect to its resistance and resulting fuel con-sumption has been always posed as a major task in ship design. This work is focused on integrating three in-house developed components for ship-hull optimization. These components comprise a parametric CATIAr-based ship-hull design process, a Boundary
Element Method (BEM) hydrodynamic solver and an optimization environment based on modern optimization techniques. Note that the hydrodynamic solver adopts the concept of Isogeometric Analysis (IGA), which aims to intrinsically integrate CAD with Analysis by communicating the CAD model of the computation field to the solver without any approximation, e.g., panelization.
The rest of the paper is structured in four sections. In §2 we outline the construction, given a set of typical parent ship hulls, of the parametric ship model. Section 3 is devoted to present the basic features of the CFD solver for wave resistance, developed by combining the Neumann-Kelvin formulation with an IGA-based BEM approach. The optimization algorithms and the architecture of the associated software environment is described in § 4. Finally, we present two (local/global) optimization tests for a container ship. The first test deals with bow optimization against the criterion of minimum wave resistance under given displacement, while the second test involves ship-hull optimization against minimum resistance and minimum deviation from a reference deadweight.
2 The SHIP Parametric Model (SPM)
In this section we describe a methodology for constructing a parametric model for typical ship forms with the aid of CATIA [1], which is a featured parametric hybrid modeler, i.e., surface and solid modeler, providing a wide range of workbenches and multidisciplinary functionalities. The parametric capabilities in CATIA fully cover the requirements posed for generating the ship-hull parametric model (SPM). Finally, the automation offered in CATIA through various scripting languages can easily constitute the developing frame-work for the creation of the wrapper required in the optimization process; see §4,5. To start with, the basic shape characteristics of a typical ship-hull comprise:
• a partition of the ship-hull into three main parts, namely the bow, the midsection and the stern,
• global dimensions (e.g., length between perpendiculars, beam, depth, draft) as well as dimensions characterizing each one of the aforementioned ship parts (e.g., extent of parallel deck and middle body),
• a set of control curves that are of boundary (e.g., stern profile, bow profile) or shape-transition character (e.g., FoS (flat-of-side) and FoB (flat-of-bottom) curves) and, finally,
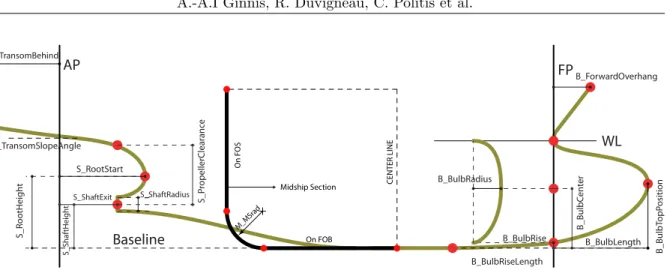
• local geometrical characteristics (e.g., locations, angles, radii) that serve functional, structural and/or hydrodynamic purposes, e.g., bow-angle of entrance at waterline, bulb-top position, bilge radius, shaft height, etc.
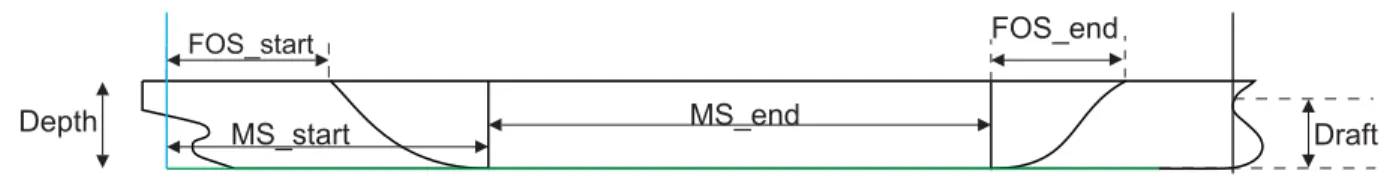
MS_start MS_end
FOS_end
FOS_start
Depth Draft
Figure 1: Lengths for defining mid-ship exposed parameters.
On the basis of the above coarse shape description and a set of parent ship-hulls, a list of exposed and internal parameters is devised. Exposed parameters will be accessible from the outside of the parametric modeling tool and initiate the modeling process, leading eventually to the production of a corresponding hull instance. On the contrary, internal parameters are not visible from the outside of the parametric tool and are used to control the surface construction process and eventually retain the basic shape characteristics of the parent hulls. Default values for both exposed and internal parameters are extracted from the parent ships. Furthermore, a domain of variation is assigned to each parameter assuring the modeling robustness while at the same time avoiding invalid geometrical models (e.g., self-intersections). These ranges can be thought as confidence intervals and have to be defined through extensive experimentation with the parametric model. Finally, SPM favors the use of non-dimensional parameters where possible, in order to avoid the interdependency between them.
Exposed parameters are categorized in four groups, according to whether they are global or associated to the midship, bow or stern areas of the ship. Parameters belonging to the global group correspond to ship’s principal dimensions and their effect is of global nature, e.g., G Lpp, G Beam, G RiseOfFloor. The second category includes parameters that are involved in the generation of the mid-ship part of the ship, e.g., M MS start, M FOS end; see Fig. 1) and, although not being global in nature, they also have a global effect as the mid-ship part is both the initial and supporting entity in the construction of the hull parametric model. The remaining two categories correspond to the bow and stern parts of the ship and are of more local character as they define shape forms in the areas of the bow and stern, respectively, see Fig. 2. The total number of exposed parameters is 30 and are split as follows: 5 global, 7 for the midship and 8,10 for the bow and stern parts respectively.
2.1 SPM construction process
We are targeting for a G1-continuous hull, which will be based on a curve network and associated cross-tangent ribbons. Both exposed and internal parameters are used to parametrically describe the initial Control Curve Network (CCN0), which serves as the
base for the ship-hull definition. CCN0 comprises ship profile, FoS & FoB boundary
curves, midship section and sections capturing shape transition in the bow and stern areas; see Fig. 3.
FP AP Baseline WL S_TransomSlopeAngle S_TransomBehind S_ Pr opellerClea ran ce S_RootHeight S_Sha ftHeight S_ShaftExit S_RootStart S_ShaftRadius B_BulbRiseLength B_BulbRise B_BulbLength B_Bulb Top Position B_Bulb C en ter B_ForwardOverhang B_BulbRadius M_MS rad CENTER LINE On FOB On FOS Midship Section
Figure 2: Exposed parameters for aft and bow parts of the ship and midship section
Figure 3: Initial Control Curve Network: CCN0
modeling process. These entities include, among others, the fore- and aft-perpendicular, baseline and FoB & FoS planes. CCN0 is used in conjunction with constraints apparently
induced from ship’s geometry, as e.g., symmetry with respect to the center plane, planarity of FoB/FoS areas, for producing cross-tangent ribbons over its elements. Attaching these ribbons to CCN0 we get the so-called augmented CCN0 (aCCN0).
c_BOWSEP c_S1 c_S2 c_W c_W1 c_W3c_W2 c_BowProfile c_BowG1 c_Deck c_FOB_bow c_FOS_bo w
Figure 4: Bow part of aCCN1
Using aCCN0 various 3D control curves, capturing shape transitions in difficult areas
Figure 5: The G1-continuous composite surface interpolating aCCN 1
referred to as CCN1; see blue curves in Fig. 4 for the bow part. Then, in analogy with the
step: CCN0 → aCCN0, additional cross-tangent ribbon information is added to CCN1,
leading to the final augmented Control Curve Network (aCCN1; see Fig. 4. Based on
aCCN1 and using the appropriate CATIA functionalities, we employ a local construction
scheme, that utilizes Hermite-type quadrilateral surface patch generation, thus ensuring tangent plane geometric continuity (G1) for all surface patches constituting the ship-hull
model; see Fig. 5.
3 The IGA-BEM wave resistance solver
The CFD solver adopted in the optimization process for calculating the wave resistance is based on the so-called Neumann-Kelvin wave source distribution over the wetted part of the hull. Following the formulation in Baar & Price [2], the wave-resistance problem is equivalently formulated as a Boundary Integral Equation (BIE) defined on the wetted surface S and the corresponding waterline `,
µ (P) 2 − Z S µ (Q) ∂G (P, Q) ∂n (P) dS (Q) − 1 k Z ` µ (Q) ∂G (P, Q) ∂n (P) nx(Q) τy(Q) dl (Q) = g (P) , (1) where µ is the density of the Neumann-Kelvin Green function G (P, Q) , g (P) = −U·n (P) with U denoting the steady forward speed of the ship and k = g/kUk2 being the charac-teristic wave number.From the solution of the above integral equation, various quantities, such as velocity, pressure distribution, ship wave pattern and ship wave resistance can be obtained.
In the present work, a high-order Boundary Element Method (BEM) based on IsoGeo-metric Analysis (IGA) is applied for the numerical solution of the BIE (1), as described in detail in [3]. The IGA approach has been initially proposed by Hughes et al [4], in the context of Finite Element Method; see also [5] and [6]. In the context of IGA, field quantities are represented by the very same basis that is being used for representing the geometry of the body-boundary. For the latter, we shall presume that it can be accurately represented as a regular parametric NURBS surface as below:
x (t1, t2) = np1 X i1=0 np2 X i2=0 dpi1i2Rpi 1i2,k1pk p 2(t1, t2):= np X i=0 dpiRpi,kp(t1, t2), (2)
and Rpi,kp(t1, t2) := R p i1i2,kp1k p 2 (t1, t2) = wpi1i2Nip 1,kp1(t1) N p i2,kp2(t2) Pnp1 l1=0 Pnp2 l2=0w p l1l2N p l1,kp1(t1) N p l2,kp2(t2) , p = 1, . . . , N, (3) where i = (i1, i2) and kp = (k1p, k p
2) are multiple indices, p is the patch identifier, d p i := d
p i1i2
denote the control points of patch p and Nip1(t1) := Nip1,kp
1(t1), N
p
i2(t2) := N
p
i2,k2p(t2) are the
B-spline functions of degree kp1 and k2p, respectively, which, in conjunction with the weights wpi1i2 are used in (3) for building up the rational B-spline functions Rpi,kp(t1, t2) for patch
p. Furthermore, (tk ∈ I p
k, k = 1, 2, which are partitioned appropriately by knot vectors
Jkp. As already mentioned above, in IGA context we employ the same representation for the unknown source-sink surface distribution
µ (t1, t2) = np+lp X i=0 µpiRpi,lp(t1, t2) , (t1, t2) ∈ Ωp, Ωp = I1p× I p 2, p = 1, 2, . . . , N, (4)
where, for the above representation, sequences of nested finite-dimensional spaces Sk(lp) = Skpp(J
p 1,lp1, J
p
2,lp2) are introduced on which the BIE (1) will be projected, with l
p := (lp 1, l
p 2)
denoting the additional knots inserted into I1p and I2p respectively. Substituting (4) into (1) and satisfying this equation over a set of collocation points, which are chosen to be the Greville abscissae of the associated knot vectors , we arrive at a discrete form of the BIE (1) which constitutes the linear system to be solved for the calculation of the unknown coefficients µpi.
4 The multi-objective optimization environment
Simulation-based optimization is of growing importance in naval engineering, since it allows to improve ship performance for a moderate cost, in comparison with towing tank experiments. Moreover, the optimization is conducted in a rigorous algorithmic framework that can outclass the experience and intuitions of naval architects.
A major difficulty to apply an automated shape optimization procedure, in naval engi-neering as well as in other disciplines, is the development of a fully automated design loop. Indeed, for each set of parameters, a geometric hull model has to be constructed, allowing the generation of the computational domain used by the solver to provide the physical re-sponse and the performance analysis. All these steps should be fully automated, without hand-made repairing nor arranging process, in order to feed the optimization algorithm and finalize the design loop. In this context, the IGA paradigm offers a significant improve-ment over the classical grid-based methods, since it relies on a direct relationship between the design parameters and the solver, without any geometrical intermediate structures. A second obstacle arises from the simulation process: for complex test-cases, CFD simu-lations are expensive, in terms of computational time. Moreover, the numerical solutions obtained can be polluted by errors arising from the discretization and iterative methods,
yielding noisy performance evaluations. Sometimes, this may lead the optimizer to spuri-ous local optima or even yield the failure of the optimization procedure. Here again, the isogeometric context may be helpful because it allows to avoid geometrical approxima-tions, which reduces the error level, and permits to construct high-order solutions yielding a better computational efficiency.
In summary, isogeometric analysis methods facilitate the development of a design opti-mization loop for practical engineering problems and make the resulting tool more efficient. The next sections present briefly the optimization algorithms considered in the present study and the software environment that gathers the geometric modeler, the solver and the optimizer.
4.1 Algorithms
Two single-objective and one multi-objective optimization algorithms have been included in the design optimization environment. As explained above, the robustness of the algo-rithms is critical to solve realistic problems. Therefore, derivative-free methods have been preferred to more efficient but fragile gradient-based approaches.
The numerical experiments carried out in the present study are based on the following algorithms:
• The multi-direction search algorithm from Dennis & Torczon [7].
This is a deterministic direct-search algorithm, which leads to an optimum point by exploring iteratively a set of linearly independent directions from a starting point. It can be considered as an improvement of the well-known Nelder-Mead pattern-search method [8], since it relies on a strong convergence proof. This algorithm is well adapted to simulation-based optimization because it exhibits a low dependency on noisy performance evaluations.
• The standard (µ, λ) evolution strategy [9].
Evolution strategies mimic the natural evolution laws to simulate a population of individuals that progressively converges to the optimum. In this paradigm, each individual is characterized by a set of parameters and its ability to survive is pro-portional to its performance. These methods, although far more expensive, are noticeable since they are able to avoid local minima thanks to random operators. The (µ, λ) evolution strategy is based on the evolution of a population of λ individ-uals, whose µ best individuals are used to generate the next generation.
• The Pareto archived evolution strategy from Knowles & Corne [10]
This algorithm is a particular evolution strategy, which has been adapted to the context of multi-criterion optimization. In that case, the ability of an individual to survive is not related directly to the criteria values, but to the concept of dominance, introduced by the economist Pareto. In short, an individual is dominating an other
one if it has a better performance according to all criteria. This algorithm generates an archive of non-dominated individuals, which is used to determine the ability of a new individual to survive and have offsprings.
These three algorithms allow to solve a range of problems that are often encountered in naval engineering, by performing respectively a robust local search, an exploratory global search and a multi-objective Pareto front capturing.
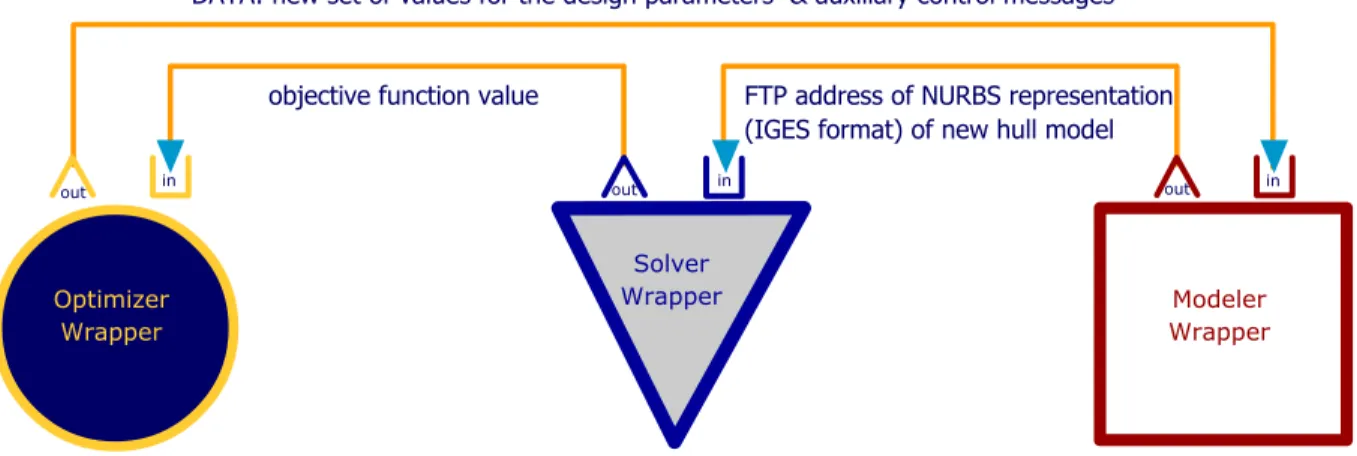
4.2 Software environment
A design optimization software environment, depicted schematically in Figure 6, has been set up including the three main components: the optimizer, the solver and the modeler. Each of these components is wrapped in a corresponding wrapper, that manages the com-munication and data exchange among the components of the optimization environment. The wrappers are implemented using the python programming language and utilize the TCP/IP network protocol for the required communications. More Specifically:
1. Optimizer wrapper (Ow) communicates with the optimizer and broadcasts the gen-erated parameter values to the parametric modeler wrapper (Mw).
2. Mw listens for data connections from Ow. When data, i.e., parameter values, are received, it triggers a CATIA construction script that produces the corresponding instance of the SPM and ultimately stores it as an IGES file at a specified ftp site. If the creation of this IGES file is successful, Ow establishes a connection with the Solver wrapper (Sw) and reports the IGES file creation. If the construction script fails a message is returned to Ow reporting the failure and requesting a new parameter set.
3. When a new IGES file is received, Sw initiates a connection to the site where the IGES file has been saved and retrieves it. IGA BEM solver is then started and performs the resistance calculations resulting, if successful, in the broadcasting of the objective function value to Ow. If computation fails, a network message is returned to Ow reporting the failure and requesting a new parameter set.
As it is obvious from the above discussion Ow, Mw and Sw work at the same time as client and server applications. This constitutes a flexible and efficient software environment for practical tests, presented in the next section.
5 Container-ship Optimization
5.1 Bow-optimization for minimizing wave resistance
The optimization environment has been firstly tested for optimizing the bow area of a container ship against the criterion of minimum wave resistance, under the constraint of
A.-A.I Ginnis, R. Duvigneau, C. Politis et al.
objective function value FTP address of NURBS representation (IGES format) of new hull model DATA: new set of values for the design parameters & auxiliary control messages
Optimizer Wrapper
out in out in out in
Solver
Wrapper Modeler
Wrapper
Figure 6: Schematic diagram of the optimization environment
Table 1: 1st test of the optimization environment: range of variation of design parameters
B BulbLength∈[6,11](m) B BulbTopPosition∈[4,10.5] (m)
B BulbRadius∈[1.5,4.5] (m) B BulbRise∈[0,2] (m)
given displacement V = 80440 m3. The main particulars of the ship have as follows: L pp
= 277 m, B = 32.2 m T = 13.0 m, Cb = 0.6938 and Vs=26 knots. Since we are interested
in optimizing the bow ship area, the design parameters are chosen to be: B BulbLength, B BulbTopPosition, B BulbRadius and B BulbRise; see Fig. 2. The range of variation of these parameters is given in Table 1. The direct-search optimization strategy described in § 4.1 is carried out to find optimal values for the design parameters of the bow. The bound constraints of Table 1 are implemented using a penalization approach while the displacement constraint is fulfilled within the SPM construction process.
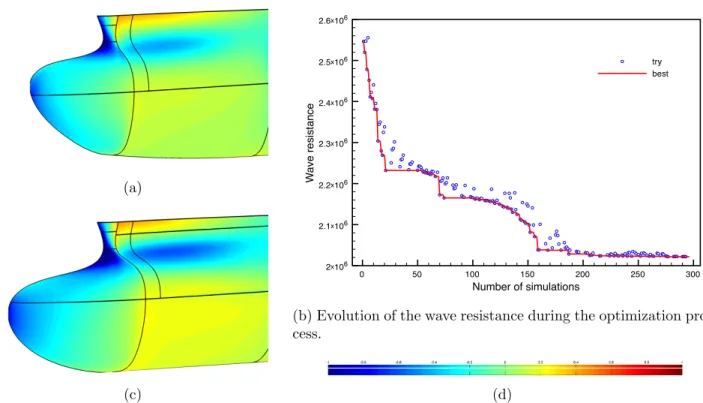
Figure 7(b) illustrates the evolution of the wave resistance during the optimization proce-dure. More than half of the reduction is obtained during the first 15 simulations, whereas the convergence is then slower. This is due to the fact that the constraints become active after a first phase of straight descent. Especially, the displacement constraint is highly non-linear and is the cause of the observed irregular function decrease. Moreover, Figures 7(a) and (c) depict the bow-area shape along with the corresponding distribution of µ for two representative instances of the parametric model.
5.2 Shape optimization for minimizing resistance and deviation from a target
deadweight
As a second test of the optimization environment we optimize a ship hull with respect to the following two criteria: a) minimum total resistance RTand b) minimum deviation from
a reference deadweight of DWT=47000tons. Total resistance is evaluated using the solver described in §3 as regards its wave component and the standard ITTC relation for the
(a) 0 50 100 150 200 250 300 Number of simulations 2x10⁶ 2.1x10⁶ 2.2x10⁶ 2.3x10⁶ 2.4x10⁶ 2.5x10⁶ 2.6x10⁶ W ave resistance try best
(b) Evolution of the wave resistance during the optimization pro-cess.
(c) (d)
Figure 7: Evolution of wave-resistance & bow-area shape along with source distribution frictional component. The deadweight of the ship is calculated as the difference between its displacement and its lightship, the latter being estimated via empirical formulae for containerships; see, e.g., [11].
Seven design parameters are chosen for the optimization process, namely, the length between perpendiculars, Lpp, the breadth, B, the bilge radius, M MSrad, the bulb length,
B BulbLength, the bulb radius, B BulbRadius and the ratios MS startR and MS endR, defined as: MS startR = MS start Lpp , MS endR = MS end Lpp− MS start ,
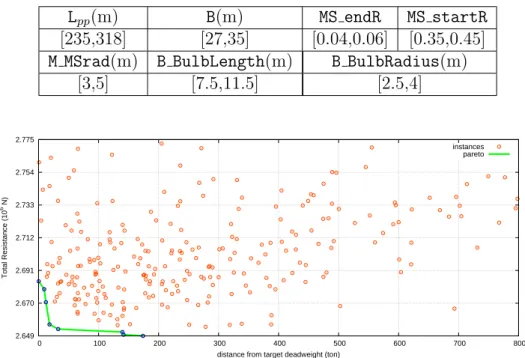
where MS end is the length of the parallel midbody of the ship while MS start denotes the distance of its starting section from the after perpendicular; see Fig. 2. The above parameters range as in Table 2. The Pareto archived evolution strategy, presented in §4.1, is employed to calculate the Pareto front of the above optimization problem, which is depicted in Fig. 8. Figure 9 provides the optimization history of four of the design parameters along with their values on the Pareto front (green skeletal lines). Both figure correspond to a second stage of the optimization process. In the initial stage, the algorithm explores the feasible space with a large step length in order to catch a coarse approximation of the Pareto front, while the second stage refines the step length starting from a point near the Pareto front.
Table 2: 2nd test of the optimization environment: range of variation of design parameters
Lpp(m) B(m) MS endR MS startR
[235,318] [27,35] [0.04,0.06] [0.35,0.45]
M MSrad(m) B BulbLength(m) B BulbRadius(m)
[3,5] [7.5,11.5] [2.5,4] 2.649 2.670 2.691 2.712 2.733 2.754 2.775 0 100 200 300 400 500 600 700 800 Total Resistance (10 6 N)
distance from target deadweight (ton)
instances pareto
Figure 8: Pareto front for the resistance and the deadweight-deviation criteria Acknowledgments
This research has been co-financed by the European Union (European Social Fund - ESF) and Greek national funds through the Operational Program “Education and Lifelong Learning” of the National Strategic Reference Framework (NSRF) - Research Funding Program: THALIS-UOA (MIS 375891).
REFERENCES
[1] CATIA V5 web site url: www.3ds.com/products/catia/welcome.
[2] Baar J.J.M. and Price W.G. Developments in the Calculation of the Wavemaking Resistance of Ships, Proc. Royal Society of London. Series A, Mathematical and Physical Sciences (1988) 416, 1850:115-147.
[3] Belibassakis K.A., Gerostathis Th.P., Kostas K.V., Politis C.G., Kaklis P.D., Ginnis A.I. and Feurer C. A BEM-isogeometric method for the ship wave-resistance problem, Ocean Engineering 60:5367 (2013).
[4] Hughes T.J.R., Cottrell J.A. and Bazilevs Y. Isogeometric analysis: CAD, finite ele-ments, NURBS, exact geometry and mesh refinement, Computer Methods in Applied Mechanics and Engineering (2005) 194:4135-4195.
285 290 295 300 305 310 315 0 200 400 600 800 1000 Lbp (m) id pareto 28.2 28.4 28.6 28.8 29 29.2 29.4 29.6 29.8 30 0 200 400 600 800 1000 B (m) id pareto 3.9 4 4.1 4.2 4.3 4.4 4.5 4.6 4.7 0 200 400 600 800 1000 bildge radius(m) id pareto 9.4 9.6 9.8 10 10.2 10.4 10.6 10.8 11 11.2 11.4 0 200 400 600 800 1000 bulb length(m) id pareto
Figure 9: Variation of parameter values in the course of the optimization process [5] Cottrell J.A., Hughes T.J.R. and Reali A.Studies of refinement and continuity in
isogeometric structural analysis, Computer Methods in Applied Mechanics and Engi-neering (2007) 196, 41-44:4160-4183.
[6] Cottrell J.A., Hughes T.J.R. and Bazilevs Y. Isogeometric Analysis: Toward Inte-gration of CAD and FEA J. Wiley & Sons, New Jersey (2009).
[7] Dennis J.B. and Torczon V.B. Direct search methods on parallel machines. SIAM Journal of Optimization, 1, 4:448-474 (1991).
[8] Nelder J. A. and Mead R. A simplex method for function minimization. Computer Journal, 7:308-313 (1965).
[9] Michalewics Z.. Genetic algorithms + data structures = evolutionary programs. AI series. Springer-Verlag, New York (1992).
[10] Knowles J.D. and Corne D.W. Approximating the nondominated front using the pareto archived evolution strategy, Evolutionary Computation, 8, 2:149-172 (2000). [11] Chen Y. Formulation of a Multi-Disciplinary Design Optimization of Containerships,
![Figure 9: Variation of parameter values in the course of the optimization process [5] Cottrell J.A., Hughes T.J.R](https://thumb-eu.123doks.com/thumbv2/123doknet/13041598.382459/13.918.172.709.189.473/figure-variation-parameter-values-optimization-process-cottrell-hughes.webp)
