HAL Id: hal-01302843
https://hal-pjse.archives-ouvertes.fr/hal-01302843
Preprint submitted on 15 Apr 2016
HAL is a multi-disciplinary open access archive for the deposit and dissemination of sci-entific research documents, whether they are pub-lished or not. The documents may come from teaching and research institutions in France or abroad, or from public or private research centers.
L’archive ouverte pluridisciplinaire HAL, est destinée au dépôt et à la diffusion de documents scientifiques de niveau recherche, publiés ou non, émanant des établissements d’enseignement et de recherche français ou étrangers, des laboratoires publics ou privés.
Individual Well-Being and the Allocation of Time Before
and After the Boston Marathon Terrorist Bombing
Andrew E. Clark, Elena Stancanelli
To cite this version:
Andrew E. Clark, Elena Stancanelli. Individual Well-Being and the Allocation of Time Before and After the Boston Marathon Terrorist Bombing. 2016. �hal-01302843�
WORKING PAPER N° 2016 – 07
Individual Well-Being and the Allocation of Time
Before and After the Boston Marathon Terrorist Bombing
Andrew Clark Elena Stancanelli
JEL Codes: I31, J21, J22, F52
Keywords: Well-being, Time Use, Terrorism
PARIS
-
JOURDAN SCIENCES ECONOMIQUES48, BD JOURDAN – E.N.S. – 75014 PARIS
TÉL. : 33(0) 1 43 13 63 00 – FAX : 33 (0) 1 43 13 63 10
Individual Well-Being and the Allocation of Time
Before and After the Boston Marathon Terrorist Bombing
1Andrew Clark2 and Elena Stancanelli3
April 2016
Abstract
There is a small literature on the economic costs of terrorism. We consider the effects of the Boston marathon bombing on Americans’ well-being and time allocation. We exploit data from the American Time Use Survey and Well-Being Module in the days around the terrorist attack to implement a regression-discontinuity design. The bombing led to a significant and large drop of about 1.5 points in well-being, on a scale of one to six, for residents of the States close to Boston. The happiness of American women also dropped significantly, by almost a point, regardless of the State of residence. Labor supply and other time use were not significantly affected. We find no well-being effect of the Sandy Hook shootings, suggesting that terrorism is different in nature from other violent deaths.
Keywords: Well-being, Time Use, Terrorism. JEL classification: I31, J21, J22, F52.
1 We are grateful to Hippolyte D’Albis, Dan Hamermesh, Bo Honoré, Rafael Lalive, David Neumark, and Sangeeta Pratap for helpful discussions.We also thank Alan Krueger for providing us with helpful advice on the Well-Being module during Elena’s visit to Princeton in May 2015. All errors are ours.
2 Paris School of Economics-CNRS and IZA
1. Introduction
A small literature in economics has attempted to quantify the economic costs of terrorism. Most existing work has related to countries that have been, continuously and over a long period, exposed to terrorist attacks, such as Israel, Ireland, or the Basque country (Alberto Abadie and Xavier Gardeazabal, 2003 and 2008; Bruno Frey, Simon Luechinger and Alois Stutzer, 2007; and Eli Berman and David Laitin, 2008). This has led researchers to design sophisticated counterfactuals to evaluate the economic impact of terrorism, as control groups are not readily available, as in Alberto Abadie and Xavier Gardeazabal (2003), who construct a synthetic control cohort using data from other Spanish regions. More recently, Robert Metcalfe, Nattavudh Powdthavee and Paul Dolan (2011) applied a differences-in-differences method to estimate the effect of the 11th September 2001 (9/11) attacks in New York on the
subjective well-being of the British, using an index of psychological well-being (the twelve-item General Health Questionnaire) in British Household Panel Survey data. Work on the psychological and economic responses of Americans to the 9/11 terrorist attacks has often used previous periods or individuals in other States as the control group (Edward Glaeser and Jesse Shapiro, 2002). In particular, Alan Krueger (2007), using data from Wisconsin, found that 9/11 temporarily increased sadness while reducing enthusiasm. Abel Brodeur (2016) considers all terrorist events in the US, comparing counties with successful and failed attacks in BRFSS data. He finds both better self-reported health (amongst men), and increased seat-belt use.
We here present the first evaluation of the effects of the 2013 Boston marathon bombing on Americans’ subjective well-being and time allocation, using a regression-discontinuity design applied to continuous daily information on individual emotional feelings and time allocation from the American Time Use Survey (ATUS) Well-Being module.0 This provides a unique
quasi-natural experimental set up to evaluate the impact of isolated terrorist acts on subjective well-being and economic behavior in the general population.
There were two explosions at the 2013 Boston marathon, which caused the death of three spectators and a policeman, while 264 other spectators were injured. The city of Boston was paralyzed until the terrorists were captured by the police. The bombing received wide coverage in the news in the United States and globally. While we therefore expect any effect to be stronger in the geographical area around Boston, individuals in other parts of the United 0 This survey data was not available at the time of the 9/11 terrorist attacks.
States are also likely to have been affected. The bombing represented an exogenous terrorist shock that did not have a direct income effect on respondents (except for those few who were directly hit). A major empirical challenge in the analysis of subjective well-being is the possible co-determination of well-being and income, which has been widely debated in the economic literature (Andrew Clark and Andrew Oswald, 1996; Andrew Clark, Nicolai Kristensen and Niels Westergaard-Nielsen, 2009; Andrew Clark, 2011; Rafael Di Tella and Robert MacCulloch, 2006).
Terrorist acts likely have negative effects on the economy, although these are usually hard to quantify (Gary Becker and Yona Rubinstein, 2011). Alberto Abadie and Xavier Gardeazabal (2003) show that terrorism had a large and negative effect on local entrepreneurship and GDP in the Basque region of Spain. Adriana Camacho (2008) finds a negative effect of terrorism on birth weight in Columbia. On the other hand, Gary Becker and Yona Rubinstein (2011)0
conclude that only occasional users reduced their consumption of goods and services (such as bar consumption and bus rides) that were potentially targeted by terrorists during the ‘Al-Aqsa’ Intifada, while the consumption of frequent users was not significantly affected. Here we study the effect of an isolated terrorist act, whose immediate impact on Americans’ well-being and time allocation is likely to resemble the effect for occasional users in Gary Becker and Yona Rubinstein (2011) for Israel.
We rely on a direct daily measure of subjective well-being collected in association with carrying out daily activities. ATUS respondents fill in an activity diary covering a 24-hour period, and report their experienced emotional feelings with respect to three randomly-drawn activities (out of all of the activities reported over the 24 hours). This measure of subjective well-being is more focused than broader recall questions regarding life satisfaction that likely correspond to much longer time periods (Daniel Kahneman et al. 2004; Daniel Kahneman and Alan Krueger, 2006; Alan Krueger and Andreas Mueller, 2012).
The ATUS survey and the Well-Being Module were in the field continuously both before and after the Boston marathon attack, so that we can evaluate the immediate impact of the bombing. While we do not observe the same individual before and after the attack, the activity diaries collected on the days just before and just after the bombing are likely to be very similar in every respect, except for the occurrence of the terrorist attack. The average subjective well-being effect is large, with a drop of about half a point (on a six-point scale), 0 See also Dov Waxman, 2011.
representing an 11 per cent drop in well-being. This effect is driven by the responses of residents of Massachusetts and neighboring States, for whom happiness drops by 1.5, which is a very large effect. American women’s happiness also drops by almost a point. The negative effect of the bombing on happiness appears to be larger than the estimated effect of a percentage point drop in GDP, although such comparisons are hard to make (Andrew Clark, 2011; Betsey Stevenson and Justin Wolfers, 2008).0 It is also larger than the drop in individual
well-being caused by unemployment (Alan Krueger and Andreas Mueller, 2012). However, we find no significant effect on hours worked, suggesting that economic activity was not affected by the bombing.
The Boston marathon is run every year on Patriot’s day, a holiday that falls on the third Monday of April to commemorate the anniversary of the first battles of the American Revolutionary war (the Battles of Lexington and Concord). The 2013 Boston marathon took place on Monday 15th April, which was also the 2013 national ‘tax’ day, the day by which
income-tax returns are due to the Federal government. As such, we can test for placebos using counterfactual information from the 2012 ATUS: we find no significant drop in happiness in 2012 either on Monday April 16th (the day of the 2012 Boston marathon day) or on Tuesday
April 17th (the national tax day that year). Neither do we find a specific day of the week effect,
as there is no significant drop in happiness on the Monday one week earlier in 2013.
We also consider another tragic event: the fatal shooting of 20 children and 6 staff members at Sandy Hook elementary school on December 14th 2012. This event also received a great deal
of media coverage in the United States and abroad. Using a similar regression-discontinuity approach as for the Boston bombing, and comparable data drawn from the 2012 ATUS, we find no impact of the Sandy Hook shooting on individual well-being or time allocation. This finding is in line with Kip Viscusi (2009), who points to much stronger population reactions to deaths from terrorism than from other causes. Terrorist attacks that can potentially hit anyone may affect societal well-being via increased feelings of fear (Gary Becker and Yona Rubinstein, 2011). The Boston bombing is also more likely to have reminded Americans of the dramatic events of 11th September 2001, when almost 3000 people died in an
unprecedented Al-Qaeda terrorist attack, than did Sandy Hook.
0 Betsey Stevenson and Justin Wolfers (2008) estimate a gradient of about 0.40 between subjective well-being and GDP growth (specified as the logarithm of GDP per capita), using either World Values Survey or Gallup World Poll data and a variety of empirical approaches, as well as in 1972-2006 data from the US General Social Survey.
The remainder of the paper is structured as follows. Section 2 presents the empirical approach, and the data are described in Section 3. The descriptive statistics and graphical analysis appear in Section 4, and the estimation results in Section 5. Last, Section 6 concludes.
2. The Empirical Method
Economic agents are assumed to maximize the expected utility from leisure and consumption (where the latter also includes home-produced goods, such as meals or a clean home), subject to a time constraint (there are only 24 hours a day) and a budget constraint, in a given (public) environment. Terrorist acts increase uncertainty and make the threat of terrorism more tangible, and may thus affect individual decision-making by increasing fear (Gary Becker and Yona Rubinstein, 2011). Direct or indirect exposure to terrorism may affect the utility individuals derive from leisure and consumption, independently of whether it changes the demand for leisure and consumption.
The direct and immediate impact of terrorism on individual utility is picked up using subjective well-being indices, such as the ATUS emotional feelings questions that were collected close to the time of the terrorist act. There is a vast literature in economics that uses subjective well-being questions in this way (Andrew Clark, 2011), and the ATUS well-being module captures the emotional feelings experienced by the respondents on the same day that they carry out their activities (Bureau of Labor Statistics, 2014).
Exposure to terrorism can also directly affect the individual demand for leisure and other uses of time. Gary Becker and Yona Rubinstein (2011) argue that terrorism may be especially salient for services and goods that are potentially exposed. Leisure activities such as playing sports and exercising, which are typically performed outside the home, may be particularly affected. It is however difficult to predict a priori the sign and magnitude of any effect on individual time allocation, which may also depend on individual risk attitudes, the government’s response to the attack, and the reaction of the police (Mirko Draca, Stephen Machin, and Robert Witt, 2011), which we cannot measure here. There is some evidence though in the empirical literature that women are more risk averse than men (Rachel Croson and Uri Gneezy, 2009; Azmat Ghazala and Barbara Petrongolo, 2014) and we shall test for any differential effects of the bombing by gender.
Our approach here is empirical. We exploit the ATUS Well-Being module to implement a Regression Discontinuity (RD) design, and so do not need to worry about other variables that affect our outcome variables (Joshua Angrist and Jorn-Steffen Pischke, 2009; Jinyong Hahn, Petra Todd and Wilbert Van der Klaauw, 2001; Guido Imbens and Thomas Lemieux, 2007; Wilbert van der Klaauw, 2002 and 2008; and David S. Lee and Thomas Lemieux, 2010) as long as these are not discontinuous on the day of the terrorist attack.
One of the conditions for RD validity is that individuals should not be able to manipulate the running variable (here the days elapsed before and after the Boston marathon bombing), which hinges in our context on seeing whether the ATUS Well-Being survey was run continuously in the period of the terrorist attack. It is possible to check for this by running a McCrary test (Justin McCrary, 2008), which indeed indicates that the survey was run continuously before and after the attack (Figure 1). For the RD approach to be meaningful we also require that no other major change happened on April 15th 2013 that may have affected
the outcome variables (individual well-being and time use), which we also test for via various robustness checks.
We can then write out the basic regression discontinuity set-up, with W denoting our measure of emotional well-being, L individual labor supply, and A the other activities we shall consider, such as doing housework, playing sports, or watching the news. The running variable is D, which is defined as the number of days before and after the terrorist attack, which occurs at day zero. The treatment T refers to the terrorist attack having happened, and is a dummy variable for the date being April 15th 2013 or later. We observe the outcome variable
W (or L or A) both before the attack W(0) and after the attack W(1). We wish to estimate the
average impact (γ) of the terrorist attack on individual outcomes: 1) γ = E[W(1) - W(0)]
As it is often the case in the RD literature, we only observe W, L or A for the same individual on one given day, which is either before (0) or after (1) the attack. We thus assume that any difference in outcomes between diaries recorded before or after that attack is due to the attack. For each individual i, exposure to the treatment T is thus a deterministic function of the calendar day J for which the ATUS activity diary was recorded, as follows:
2)
{
TTi=1{
Ji≥ 15 April 2013}
∨Ti=1 {Di≥0 } i=0 {Ji<15 April 2013 }∨Ti=0 {Di<0 }where the day of the terrorist attack, day zero, is the ‘cut-off’ for the treatment. The RD estimate of the average treatment effect, γ, is given as follows:
3) γRD = E[ Wi(1) – Wi(0) | Di=0]
Assuming the continuity of E[W] on either side of the cut-off, this estimator can be rewritten as:
4) γRD = lim-D→0 E[ Wi(1) | Di=0] – lim+D→0 E[Wi(0) | Di=0]
which can be approximated as usual under RD (Jinyong Hahn, Petra Todd and Wilbert Van der Klaauw, 2001; and Guido Imbens and Thomas Lemieux, 2007) by the difference in the mean outcomes of the respondents who filled out the ATUS diary in a small window of days before and after the day of the attack (the cutoff point). Assuming a linear model for the outcome, we can also write:
5) Wi = γRD Ti + β f(Di) + λ f(Di) Ti + ui
Where f(D) is a polynomial function of the distance in days from the terrorist attack interacted with the treatment dummy T, to allow for different effects on either side of the cutoff. We estimate γRD non-parametrically (a local polynomial with a triangular kernel, as in Austin
Nichols, 2014), as well as via parametric linear regression. We apply the procedure in Sebastian Calonico, Matias Cattaneo and Rocio Titiunik (2014) or Austin Nichols (2014) to determine the optimal bandwidth, and use the same bandwidth for the parametric and non-parametric models. We also check other bandwidths such as one, two or three weeks. We use robust standard errors in all model specifications and the standard errors of the well-being outcomes models are also clustered at the individual level to reflect that emotional feelings were collected for the same individual for three randomly-selected activities.
Last, to pin down the longer run impact of the bombing, we also estimate a differences-in-differences model on pooled data for 2012 and 2013, using the 2012 Boston marathon day (Monday April 17th 2012) as a counterfactual as follows.
6) Wi = ζ Bi *y2013i + τ Bi + φ y2013i + π Zi +ν i
where B is a dummy that takes value one for the Boston marathon day (which was Monday April 16th in 2012 and Monday April 15th in 2013), y2013 is a dummy for 2013, and Z is a
status, demographic characteristics, race, day-of-the-week (Monday to Sunday), month, year and State fixed effects. The standard errors are robust and clustered at the individual level.
3. The data, sample selection and outcome variables
The data for the main analysis are drawn from 2013 American Time Use Survey (ATUS) and Well-Being module (WB). We also use data from the 2012 ATUS for various robustness checks. We exploit information on the exact day on which the activity diary was collected to construct a continuous measure of the time distance from the day of the terrorist attack. The ATUS Well-Being module collects information on six emotional feelings regarding three randomly-selected activities from all of those reported by the respondent in the daily diary (BLS, 2015). These emotional feelings were asked by means of Computer Assisted Interview (CAT): Happiness. Sadness. Tiredness. Painfulness. Stress. Meaningfulness.
Each feeling was measured on a scale from zero (not having experienced any happiness, for example, at all) to six (having experienced the greatest happiness possible).The order of the six emotional feelings varied randomly every time the questions were asked. We set non-responses and refusals to reply to the emotional well-being question equal to missing (there are very few of these, under ten out of many thousands with a valid response). We also construct a measure of affect balance, given by the difference between the average of positive (happiness, meaningfulness) and negative (sadness, stress, tiredness, painfulness) feelings. The ATUS sample in 2013 provides us with the following estimation samples:
531 individuals who answered diaries collected within one week of the Boston marathon terrorist attack;
1048 individuals who answered diaries collected within two weeks of the attack; 1749 individuals who answered diaries collected within 26 days of the attack; and 2428 individuals who answered diaries collected within 38 days of the attack;
The ATUS activity diary collects information on the activities respondents carried out over a 24-hour period, a full-day starting in the middle of the night. We focus on the following outcomes:
Hours worked in the main job.
Hours worked in any jobs, set equal to the sum of hours worked in the main and in other jobs.
Core household work hours defined as to include any “interior” household work (done inside the respondent’s home), such as cleaning, tidying up the home, shopping for food, cooking, doing the dishes, doing the laundry.
All household work, defined to include core household work and any other interior or exterior household work, such as administrative paper work, repairs, and gardening.
Active leisure, defined as playing sports and exercising.
Passive leisure defined as watching television (not for religious purposes)0 and
movies.
Listening to the news, including passive leisure above and listening to the radio (not to music). This is an imperfect measure of exposure to news, as it also includes watching movies, due to the design of the underlying questions.
Each individual thus provides one time-use measure for these outcomes in their diary day, and three well-being measures associated with three of their activities in their diary. As such, our well-being regressions have roughly three times as many observations as the time-use regressions.
The 2012 sample is similar, and we use diaries collected in 2012 as a counterfactual. However, the 2012 ATUS Well-Being data are not entirely comparable to those collected in 2013, as the way in which activities were randomly-drawn changed in March 2013 (BLS, 2015). Due to a programming error in the data-collection software, certain activities were less likely than others to be selected for follow-up questions in the WB Module. Most diary activities were eligible for the WB module questions, but sleeping, grooming, and a few other activities were not (BLS, 2015). This error in the activity-selection process was corrected on March 25, 2013, and our conclusions are robust to restricting the analysis to data collected after this date. The data from the 2012 and 2013 ATUS surveys look very similar (Tables 1 and 2), possibly because the weights were adjusted to mitigate this error, and we use weights 0 We exclude time spent watching television for religious purposes, as this is coded separately and we aim to capture time spent watching the news.
in all of our analysis. We do not observe respondents after 2013, as the Well-Being Survey is not available for 2014 or later.
Finally, we also match 2013 ATUS to the 2013 Current Population Survey (CPS) to obtain information on gender, age, State of residence, and total household income: ATUS respondents are a random sample of American CPS survey respondents. Total household income is measured in sixteen brackets or intervals (see Table C in the Appendix). Setting the respondent’s household income equal to the lowest bound of the household income interval to which the respondent’s household income is assigned (out of the 16 intervals available), produces a distribution of income with a median of 50 000 US dollars, which is an underestimate of the 2013 median household income of 52 250 US dollars (according to Amanda Noss, 2014, for the U.S. Census Bureau). Alternatively, using the mid-point of each income bracket as in the case of a uniform income distribution produces an overestimated median household income figure of 54 999 US dollars. We use the logarithm of household income, which is less sensitive to measurement error. The estimated log-income coefficients in our subjective well-being equations are very similar for the mid-point and lower-bound techniques (the results in Table 10 use the mid-point, but the estimates from the lower bound are almost identical).
4. Descriptive and graphical analysis
Table 1 presents the sample descriptive statistics for interviews within one month of the bombing, distinguishing between the pre- and post-bombing observations. Happiness falls, while sadness, tiredness and stress all rise, and affect balance becomes less positive. Household work and paid work also rose in the aftermath of the attack. Table 2 shows the analogous figures for 2012, which are very similar to the 2013 pre-bombing figures.
We can test the validity of the empirical design by simply plotting the data (Guido Imbens and Thomas Lemieux, 2007; Wilbert Van der Klaauw, 2008; and David Lee and Thomas Lemieux, 2010). First, as is customary, we provide graphical evidence that the running variable (distance in days from the day of the Boston marathon bombing) is continuous at the cut-off. Standard McCrary analysis shows that there is no manipulation of the running variable (Figure 1): survey participants and interviewers kept running the ATUS Well-Being survey normally before and after the Boston Marathon attack.
Next, we plot the raw means of the outcome variable against the running variable (grouped by bins of two days; these are the dots in the graphs) together with the triangular kernel estimates (the solid line in the graphs)0 and the 5% confidence intervals around these estimates (the two
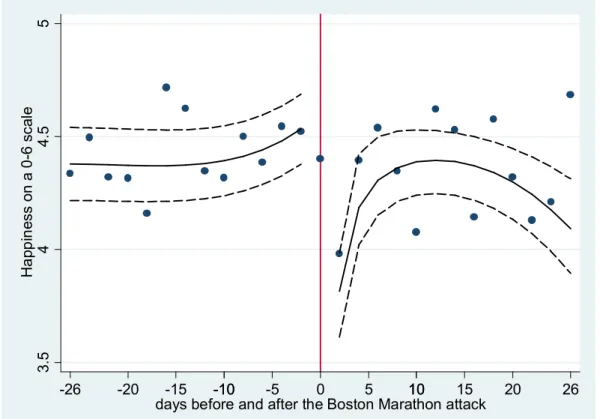
dashed lines). Figure 2 shows the evolution in happiness before and after the Boston marathon bombing, indicating a large drop in happiness after the bombing. Feelings of meaningfulness also fell after April 15th (see Figure A in the Appendix). Although feelings of painfulness rose
after to the attack (Figure B), the effect is not statistically significant. Feelings of tiredness and sadness (Figures C and D) rose after the bombing, while feelings of stress were not affected (Figure E).
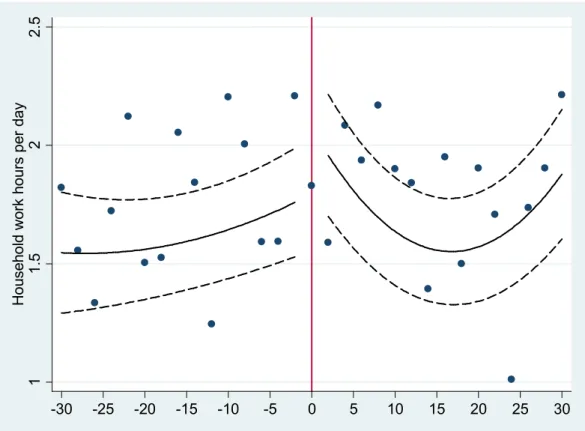
The next figures show the change in individual time allocation to the Boston bombing, Hours worked rose in Figure 3 (considering hours worked in both the main and the secondary job, if any), though this is simply due to the fact that hours worked increase on a Monday (see Table A in the Appendix). As anticipated, the time devoted to playing sports and exercising (typically outdoor activities) fell significantly after the bombing (Figure 4). Household work did not increase significantly (Figure 5), nor did Americans appear to have spent significantly more time watching television or listening to the news after the bombing (Figure F), at least not within the time lapse of one month.
5. Model estimation results
Table 3 shows the estimation results for the effect of the Boston marathon bombing on individual happiness, with both non-parametric (local polynomials) and parametric (linear regressions) models with different bandwidths (one week, 10 days, 2 or 3 weeks, 26 days or 38 days).0 All of the estimates indicate a large and significant drop in happiness after the
bombing, varying in size from -0.80 (one week after the event) to -0.36 (further away in time). The effect is largest in the days closer to the bombing, as expected, but remains sizable over a month later. The average person in the sample reported an average happiness score of 4.40 in their three randomly-drawn activities in the ten days preceding the bombing. The bombing therefore reduced Americans’ feelings of happiness by about 9 to 20 per cent. 0 These estimates were obtained without clustering the standard errors at the respondent level.
0 RD Bandwidths of 26 and 38 days are optimal for our data, according to, respectively, Sebastian Cattaneo, Mathias Calonico and Rocho Titiunik (2014) and Austin Nichols (2014). The difference between the two methods is likely due to the fact that the latter allows for clustered standard errors while the first does not.
However, this effect appears to be largely driven by the responses of those living in Massachusetts and other States that are geographically close to Boston (column 4 of Table 3), for whom happiness fell by about 1.5 points, which is a very sizable drop on a scale of 1 to 6. By way of contrast, residents living in other States were not affected (column 5 of Table 3), except for women (columns 6 and 7 of Table 3).
The impact of the bombing on other emotional feelings is summarized in Table 4. This reveals a significant rise of about half a point (on a scale of one to six) in feelings of tiredness during the three randomly-drawn daily activities. This effect is however not robust to changing the bandwidth and is not significant in Massachusetts and other States close to Boston. We also find that the bombing significantly increased stress by over a point (on a scale of one to six), which effect was larger in Massachusetts and for women. This effect is very large, representing an increase of over 100 percent in stress in Massachusetts. Feelings of pain drop significantly in the immediate aftermath of the bombing, though this may be due to the ending of the Marathon, as we also find a similar drop after the 2012 Boston marathon (see later). In contrast, there are no significant changes in feelings of sadness or meaningfulness.
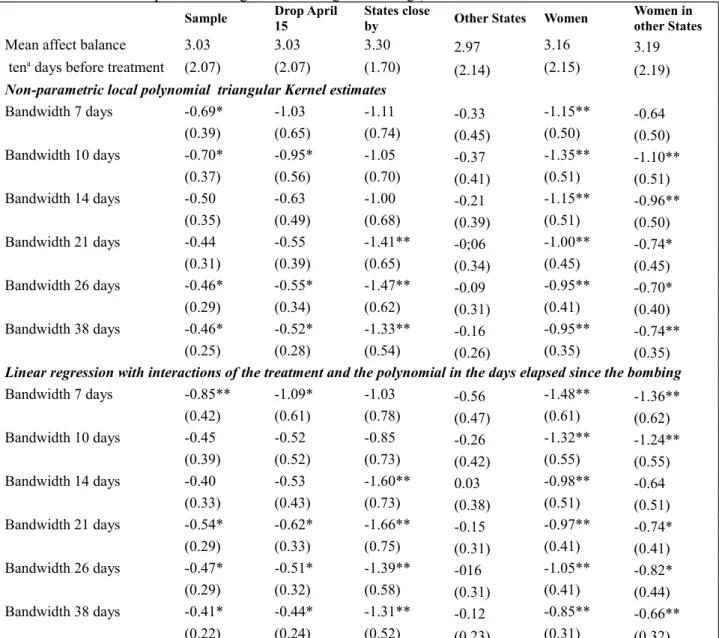
The impact of the bombing on emotional feelings is summarized in Table 5, which shows the results regarding affect balance, the difference between the average positive-emotion score (happiness, meaningfulness) and negative-emotion score (sadness, tiredness, stress, painfulness) as the dependent variable. The bombing reduced affect balance, with an effect size that is similar to that for happiness. Affect balance fell significantly for women and those living in States close to Boston, but not for other respondents.
The impact of the bombing on Americans’ allocation of time appears in Table 6: we consider hours worked, household work, active leisure (such as playing sports, cycling and walking), and time spent watching television or listening to the radio. We find a significant rise in hours worked, which actually reflects the weekly allocation of working time, as hours worked increased also on the Monday a week earlier (see Table A in the Appendix) and a year earlier, on Monday 16th April, the day of the 2012 Boston marathon (Table 8). Moreover, this positive
effect of the day of the bombing on hours worked is not statistically significant for States close to Massachusetts (column 4 of Table 6), as the marathon Monday is a holiday in most of those States. There is some limited evidence that active leisure hours dropped everywhere by about 20 minutes (panel 3 in Table 6) and by an hour in Massachusetts and other States close to Boston (column 3 in this panel). This is in line with the prediction that outdoor activities
would be reduced after terrorist attacks (Gary Becker and Yona Rubinstein, 2011). Neither household work nor the time spent watching television and listening to the radio was affected. We can obtain additional insights on the response of Americans to violent attacks by applying a similar regression-discontinuity approach to the mass shooting at the Sandy Hook elementary school on Friday December 14th 2012. We find no significant effect of this
shooting on Americans’ happiness (the first panel in Table 7) or affect balance (the second panel). In particular, we considered the effect in States close by (column 3 of Table 7), on respondents with children aged eighteen or less (column 4 of Table 7), women of child-bearing age (column 5 of Table 7), and respondents aged 15 or 16 (the last column of Table 7): these did not produce any significant estimates on happiness or affect balance. Americans’ subjective well-being then seems to fall following terrorism but not after school shootings. This is somewhat in line with the conclusions of Kip Viscusi (2009) that individuals are more sensitive to deaths due to terrorism than from other causes.
Next, we checked whether individual emotional feeling and use of time were impacted by the Boston marathon day in 2012, Monday April 16th (first block of Table 8).0 Hours of market
work increase significantly, corroborating similar findings also for Monday 8th April 2013
(Table A in the Appendix). We also find an increase in stress on Monday April 16th 2012,
although this is only significant with a two-week bandwidth and only at the ten per cent significance level. All the estimated coefficients on happiness are negative but not statistically significant. The 2013 Boston marathon, which took place on Monday April 15th 2013, also
coincided with the 2013 national tax day (which is normally April 15th of every year, except
when April 15th is a weekend day; while the Boston marathon is always the third Monday of
April). The results of estimation of local polynomial models of the effect of the 2012 national tax day on Americans’ feelings and uses of time (last block of Table 8) indicate no significant effects on either outcome, with the exception of happiness that weakly increases, suggesting that Americans probably felt relieved after having filed their income tax forms (this estimate is only significant at the ten per cent significance level and for a two-week bandwidth) and market hours that increase significantly, as for the Mondays. We also show similar estimates for Sunday April 15th 2012, exactly a year before the Boston marathon bombing (second block
of Table A). Almost nothing is significant here, with the exception of feelings of pain that drop significantly, suggesting that American are probably relieved on Sundays (this estimate 0 The Boston marathon falls on the third Monday of April, which is also a vacation day in Massachusetts.
is only significant at the ten per cent significance level and varies between 0.45 and 0.73 in absolute size, depending on the bandwidth).
Table 9 presents results of estimation of the effect of the bombing on happiness and affect balance, using a differences-in-differences approach for three different specifications. In the first, the treatment is the day of the 2013 Boston marathon (denoted as T in the table) and the control group is the day of the 2012 Boston marathon. In the second, we take triple differences and interact the day of the 2013 Boston bombing with a dummy for whether respondents lived in States close by. The gender of the respondent is interacted with the day of the bombing in the last specification. Each of the three specifications is estimated both including and excluding other explanatory variables (the “Z”s) and for different time horizons, considering all diaries or only diaries filled in March or April. In line with the regression-discontinuity results in Tables 3 and 5 we find a significant and negative short-run impact of the bombing for residents of Massachusetts and other States close to Boston. This negative impact on happiness remains significant over the next six months for this group (although the estimate is only significant at the ten per cent significance level). Affect balance does not change in the long-run, while it does in the shorter run, and especially so for women. A tentative idea of the size of the subjective well-being drop after the bombing can be obtained from a happiness regression on total household income and other individual demographic and socio-economic characteristics, including day of the week, month of the year and State dummies (Table 10). We estimated this regression both for the full sample and for the sub-samples of respondents interviewed shortly before or after the bombing. An additional unit of log income increases happiness by 0.04 to 0.07. These figures are much smaller than those in Betsey Stevenson and Justin Wolfers (2008), who provide a range of estimates for the relation between income and happiness in the United States, which may reflect that household income is measured quite imprecisely in our data (Table B in the Appendix and the discussion at the end of Section 3). With affect balance as the dependent variable, the coefficient on log household income is larger at about 0.10 to 0.13 (the final columns of Table 10), which is still smaller though than the estimate in Betsey Stevenson and Justin Wolfers (2008). It should however be underlined that while we can pin down the effect of the bombing from the regression discontinuity, we do not have exogenous variation in income here. The effect of the bombing on happiness and affect balance is -0.25 and -0.33 respectively, and so much larger than the estimated coefficient on household income. This happiness coefficient is comparable to the drop in happiness on a week day versus a weekend
(Table A). As is commonly found, women report higher happier scores than do men, by about 0.14 (at least before the bombing: this estimate becomes statistically insignificant in the days after the bombing), happiness drops with age (though at a decreasing rate), and the less-educated are happier than college-less-educated (the reference group for the education dummies). There is some indication that these standard subjective well-being relationships were shaken by the bombing, as many of the coefficients in Table 10 are different before or after the attack.
6. Conclusions
We believe that this is one of the first pieces to evaluate the effect of terrorism on well-being and time allocation in a country where such attacks are rare. We use daily time allocation and emotional feelings information on a random sample of Americans interviewed in the days close to the 2013 Boston marathon bombing, drawn from the American Time Use Survey and Well-Being Module. Our dataset includes several thousand respondents, enabling us to take a Regression Discontinuity approach whereby we compare the responses of the individuals who were interviewed just before the bombing to those who were interviewed just after.
We find a significant drop in individual happiness due to the Boston terrorist attack, driven by the responses of women, and of residents of Massachusetts and surrounding States. Happiness in the latter drops by 1.5 points after the bombing, which is a very sizable effect. This holds in both fully non-parametric (local polynomials) and parametric (linear regressions) regression-discontinuity models, and with a variety of bandwidths. Similar conclusions are reached for affect balance, which also drops after the bombing by about 1.5 points for respondents living in Massachusetts and other States close to Boston, and by about one point for women, regardless of where they live.
In contrast, the 2012 mass shooting at Sandy Hook elementary school did not significantly affect happiness or affect balance. Terrorism that can hit anyone at any time then seems to have greater a well-being impact than other acts of mass violence, possibly due to its impact on individual fear, which has been well-documented in the literature. This is also consistent with the picture in earlier literature that individuals are more responsive to deaths from terrorism than to those from other causes.
We also find that outdoor activities such as active leisure activities fell after the bombing, as expected, while hours worked (and hence economic activity) were not affected by the
bombing. Happiness and affect balance fell in the immediate aftermath, but in the longer run these impacts become smaller and insignificant in differences-in-differences estimates using the 2012 Boston marathon as a counterfactual. Terrorism in countries where such attacks are rare therefore has a sharp, but not permanent, impact on well-being.
Bibliography
Abadie, Alberto and Javier Gardeazabal (2008), “Terrorism and the world economy”,
European Economic Review, 52(1), 1-27.
Abadie, Alberto and Javier Gardeazabal (2003), “The Economic Costs of Conflict: A Case Study of the Basque Country”, American Economic Review, 93(1), 113-132.
Angrist, Joshua D. and Jorn-Steffen Pischke (2009) Mostly Harmless Econometrics: An
Empiricist’s Companion, Princeton University Press.
AzmatGhazala and Barbara Petrongolo (2014) “Gender and the labour market: What have we learned from field and lab experiments?”, Labour Economics, 30, 32–40.
Becker, Gary S. and Yona Rubinstein (2011), “Fear and the Response to Terrorism: an Economic Analysis”, CEP Discussion Paper No 1079.
Berman, Eli and David D. Laitin (2008), “Religion , terrorism and public goods: testing the club model”, Journal of Public Economics, 92(10-11), 1942-1967.
Biddle, Jeff E. and Daniel S. Hamermesh (1990), “Sleep and the Allocation of Time”, Journal
of Political Economy, 98(5), 922-943.
Brodeur, A. (2016). “Terrorism, General Health and Posttraumatic Growth”. University of Ottawa, mimeo.
Bureau of Labor Statistics (2014), “American Time Use Survey (ATUS) Data Dictionary: 2010, 2012, and 2013 Well-Being Module Data Variables collected in ATUS Module” July 2014, US Bureau of Labor Statistics.
Bureau of Labor Statistics (2015), “American Time Use Survey User Guide: Understanding ATUS 2003 to 2014”, June 2015, US Bureau of Labor Statistics.
Calonico, Sebastian, Matias D. Cattaneo and Rocio Titiunik (2014), “Robust Non-Parametric Confidence Intervals for Regression Discontinuity Designs”, Econometrica, 82(6), 2295-2326.
Camacho, Adriana (2008), “Stress and Birth Weight: Evidence from Terrorist Attacks”,
Clark, Andrew E. and Oswald, Andrew J. (1996), “Satisfaction and comparison income”.
Journal of Public Economics, 61(3), 359-381.
Clark, Andrew, Nicolai Kristensen and Niels Westergaard-Nielsen (2009), “Economic Satisfaction and Income Rank in Small Neighbourhoods”, Journal of the European Economic
Association, 7(2-3), 519-527.
Clark, Andrew, (2011), “Income and Happiness: Getting the Debate Straight”, Applied
Research in Quality of Life, 6(3), 253-263.
Croson Rachel and Uri Gneezy (2009), “Gender differences in preferences”, Journal of
Economic Literature, 47 (2), 1–27.
Di Tella, Rafael and Robert MacCulloch (2006), “Some Uses of Happiness Data in Economics”, Journal of Economic Perspectives, 20(1), 25-46.
Draca, Mirko, Stephen Machin, and Robert Witt (2011), “Panic on the Streets of London: Police, Crime and the July 2005 Terror Attacks”, American Economic Review, 101(5), 2157-2181.
Frey, Bruno, Simon Luechinger and Alois Stutzer, (2007), “Calculating Tragedy: Assessing the Costs Of Terrorism,” Journal of Economic Surveys, 21(1), 1-24.
Gibson, Matthew and Jeffrey Shrader (2015), “Time Use and Productivity: The Wage Returns to Sleep”, UC San Diego mimeo.
Glaeser, Edward L. and Jesse M. Shapiro (2002), “Cities and Warfare: The Impact of Terrorism on Urban Form”, Journal of Urban Economics, 51(2), 205-224.
Hahn, Jinyong, Petra Todd and Wilbert Van der Klaauw (2001), “Regression-Discontinuity Design”, Econometrica, 69(1), 201-209.
Hamermesh, Daniel and Elena Stancanelli (2015), “Long Workweeks and Strange Hours”, Industrial and Labor Relations Review, 68(5), 1007-1018.
Imbens, Guido and Thomas Lemieux (2007), “Regression Discontinuity Design: a Guide to Practice”, Journal of Econometrics, 142(2), 615-635.
Kahneman, Daniel, Alan B. Krueger, David A. Schkade, Norbert Schwarz and Arthur Stone (2004), “A Survey Method for Characterizing Daily Life Experience: The Day Reconstruction Method”, Science, 3 December 2004, 1776- 1780.
Kahneman, Daniel and Alan B. Krueger (2006), “Developments in the Measurement of Subjective Well-Being”, Journal of Economic Perspectives, 20(1), 3-24.
Krueger, Alan B. (2007), What Makes a Terrorist, Princeton University Press.
Krueger, Alan B. (2009), “Attitudes and Action: Public Opinion and the Occurrence of International Terrorism”. Science, 325(5947), 1534-36.
Krueger, Alan B. and Jitka Maleckova (2003), “Education, Poverty, and Terrorism: Is There A Causal Connection?”, Journal of Economic Perspectives, 17(4), 199-144.
Krueger, Alan B. and Andreas Mueller (2012), “Time Use, Emotional Well-Being and Unemployment: Evidence from Longitudinal Data”, American Economic Review, Papers and Proceedings, 102(3), 594-599.
van der Klaauw, Wilbert (2002), “Estimating the Effect of Financial Aid Offers on College Enrollment: A Regression-Discontinuity Approach”, International Economic Review, 43(4), 1249-1287.
Van der Klaauw, Wilbert (2008), “Regression-Discontinuity Analysis: A Survey of Recent Developments in Economics”,Labour, 22(2), 219-245.
Lee, David S. and Thomas Lemieux (2010), “Regression Discontinuity Designs in Economics”, Journal of Economic Literature, 48(2), 281-355.
Metcalfe, Robert, Nattavudh Powdthavee and Paul Dolan (2011), “Destruction and Distress: using a quasi-experiment to show the effects of the September 11 attacks on mental well-being in the United Kingdom”, Economic Journal, 121(550), 81-103.
McCrary, Justin (2008), “Manipulation of the Running Variable in the Regression Discontinuity Design:A Density Test,” Journal of Econometrics, 142(2), 698-714.
Nichols, Austin (2014), “Stata Module for Regression Discontinuity Estimation”, Stata
Journal, Boston College.
Noss, Amanda (2014), “Household Income: 2013”, United States Census Bureau, September. Stancanelli, Elena and Arthur Van Soest (2012), “Retirement and Home Production: A Regression Discontinuity approach”, American Economic Review, Papers and Proceedings, 102(3), 600-605.
Stevenson, Betsey and Justin Wolfers (2008), “Economic Growth and Subjective Well-Being: Reassessing the Easterlin Paradox”, Brookings Papers on Economic Activity, 1-87.
Viscusi, W. Kip (2009), “Valuing Risks of Death from Terrorism and Natural Disasters”,
Journal of Risk and Uncertainty, 38(3), 191-213.
Waxman, Dov (2011), “Living with terror, not living in Terror: The Impact of Chronic Terrorism on Israeli Society”, Perspectives on Terrorism, 5(5-6), 1-13.
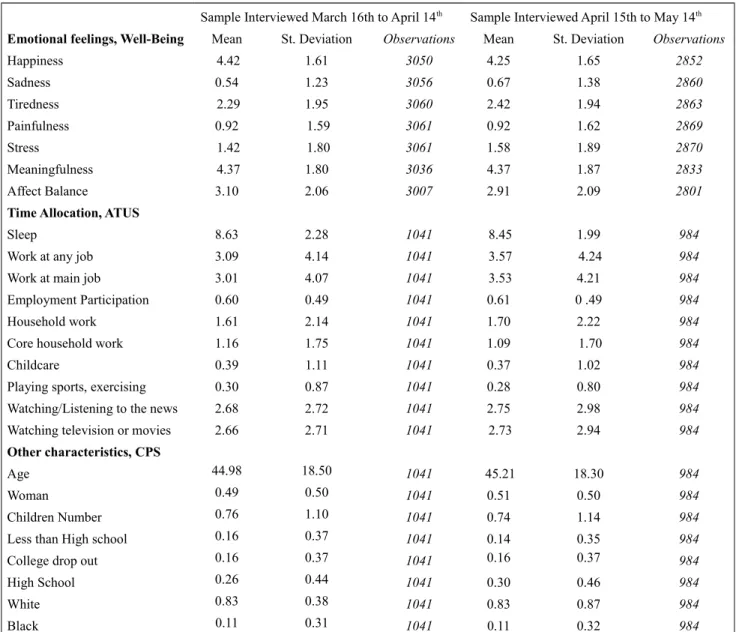
Table 1. Descriptive statistics, 2013 sample interviewed within one month before or after the Boston bombing.
Sample Interviewed March 16th to April 14th Sample Interviewed April 15th to May 14th
Emotional feelings, Well-Being Mean St. Deviation Observations Mean St. Deviation Observations
Happiness 4.42 1.61 3050 4.25 1.65 2852 Sadness 0.54 1.23 3056 0.67 1.38 2860 Tiredness 2.29 1.95 3060 2.42 1.94 2863 Painfulness 0.92 1.59 3061 0.92 1.62 2869 Stress 1.42 1.80 3061 1.58 1.89 2870 Meaningfulness 4.37 1.80 3036 4.37 1.87 2833 Affect Balance 3.10 2.06 3007 2.91 2.09 2801
Time Allocation, ATUS
Sleep 8.63 2.28 1041 8.45 1.99 984
Work at any job 3.09 4.14 1041 3.57 4.24 984
Work at main job 3.01 4.07 1041 3.53 4.21 984
Employment Participation 0.60 0.49 1041 0.61 0 .49 984
Household work 1.61 2.14 1041 1.70 2.22 984
Core household work 1.16 1.75 1041 1.09 1.70 984
Childcare 0.39 1.11 1041 0.37 1.02 984
Playing sports, exercising 0.30 0.87 1041 0.28 0.80 984
Watching/Listening to the news 2.68 2.72 1041 2.75 2.98 984
Watching television or movies 2.66 2.71 1041 2.73 2.94 984
Other characteristics, CPS
Age 44.98 18.50 1041 45.21 18.30 984
Woman 0.49 0.50 1041 0.51 0.50 984
Children Number 0.76 1.10 1041 0.74 1.14 984
Less than High school 0.16 0.37 1041 0.14 0.35 984
College drop out 0.16 0.37 1041 0.16 0.37 984
High School 0.26 0.44 1041 0.30 0.46 984
White 0.83 0.38 1041 0.83 0.87 984
Black 0.11 0.31 1041 0.11 0.32 984
The data are drawn from the 2013 Current Population Survey (CPS), linked to the American Time Survey (ATUS) and the ATUS Well-Being module. The observations are weighted using the ATUS weights (for ATUS and CPS linked data) and the specific ATUS-W weights for the ATUS-Well-Being data. Emotional feelings are measured on a scale from zero (not experiencing the feeling) to six (experiencing the highest level of the feeling). Balance feelings are equal to the difference between the average of positive feelings (happiness and meaningfulness) and negative feelings (sadness, stress, tiredness, painfulness) and only include observations with non-missing values for all these feelings. Time allocation activities are measured in hours per day. Employment participation is a dichotomous variable, taking value one if the respondent is employed. Emotional feelings were collected for three randomly-selected activities (Section 2). The ATUS and Well-Being module interviewed a random sample of the American population on each calendar day. Here we select the samples interviewed, respectively, in the month before and the month after the Boston marathon bombing.
The difference in size between the two samples is due to the fact that for unknown reasons no ATUS interviews took place on March 30th 2013. Our results are robust to considering only a 14 day bandwidth (see below).
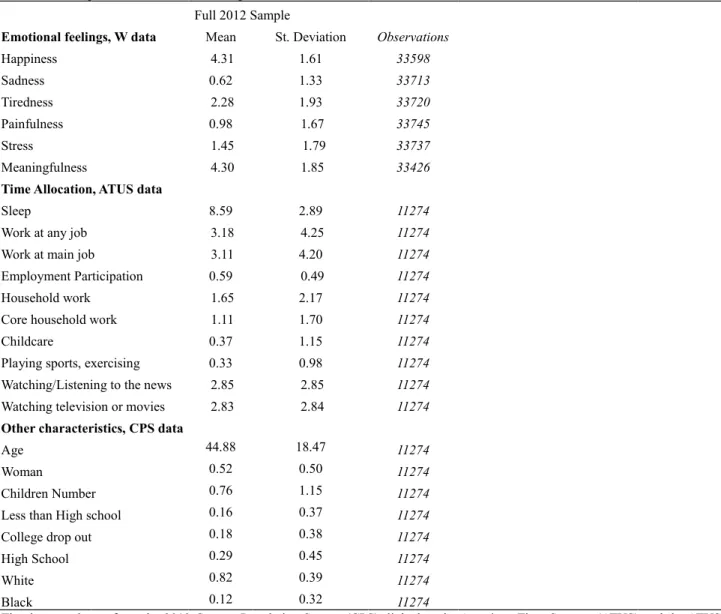
Table 2. Descriptive statistics, 2012 sample
Full 2012 Sample
Emotional feelings, W data Mean St. Deviation Observations
Happiness 4.31 1.61 33598 Sadness 0.62 1.33 33713 Tiredness 2.28 1.93 33720 Painfulness 0.98 1.67 33745 Stress 1.45 1.79 33737 Meaningfulness 4.30 1.85 33426
Time Allocation, ATUS data
Sleep 8.59 2.89 11274
Work at any job 3.18 4.25 11274
Work at main job 3.11 4.20 11274
Employment Participation 0.59 0.49 11274
Household work 1.65 2.17 11274
Core household work 1.11 1.70 11274
Childcare 0.37 1.15 11274
Playing sports, exercising 0.33 0.98 11274
Watching/Listening to the news 2.85 2.85 11274
Watching television or movies 2.83 2.84 11274
Other characteristics, CPS data
Age 44.88 18.47 11274
Woman 0.52 0.50 11274
Children Number 0.76 1.15 11274
Less than High school 0.16 0.37 11274
College drop out 0.18 0.38 11274
High School 0.29 0.45 11274
White 0.82 0.39 11274
Black 0.12 0.32 11274
The data are drawn from the 2012 Current Population Survey (CPS), linked to the American Time Survey (ATUS) and the ATUS Well-Being module (W) The observations are weighted using the ATUS weights (for ATUS and CPS linked data) and the specific ATUS-W weights for the W data. Emotional feelings are measured on a scale from zero (not experiencing the feeling) to six (experiencing the highest level of the feeling). Time-allocation activities are measured in hours per day. Employment participation is a dichotomous variable, taking the value of one if the respondent is employed.
Figure 1. McCrary Density function of the running variable, days elapsed before and after the Boston Marathon
terrorist attack of April 15th 2013.
0 .0 05 .0 1 .0 15 .0 2 .0 25 M c C ra ry d e ns ity 0 10 -10 -132-120 -90 -60 -30 30 60 90 120132
Days before and after the Boston marathon terrorist attack
The graph shows no breaks in diary participation on the day of the Boston Marathon terrorist attack (day zero in the graph). Therefore, it is appropriate to use a regression discontinuity approach, at least regarding the continuity of the running variable. The McCrary test statistic is -0.014 with a standard error of 0.044, rejecting the null hypothesis of manipulation of the running variable (days elapsed). See Justin McCrary (2008) for the calculation.
Figure 2. Happiness outcomes before and after the Boston marathon terrorist attack: 30 days bandwidth. 3. 5 4 4. 5 5 H a pp in es s on a 0 -6 s ca le -26 -20 -15 -10-10 -5 0 5 1010 15 20 26
days before and after the Boston Marathon attack
The graph shows mean individual happiness before and after the Boston Marathon terrorist attack, with day zero
corresponding to April 15th 2013. The dots correspond to the raw happiness means by bins of two days. The solid
line is non-parametrically fitted using triangle kernel with a bandwidth of 26 days. The dashed lines are the five percent confidence intervals around the triangular kernel estimates. The happiness data are drawn from the American Time Use Survey Well-Being module, which collects data on the emotional feelings associated with three randomly-drawn activities reported by the respondent in their daily activity diary. The happiness measure is weighted using the ATUS Well-Being Module weights. Missing values and non-responses are set to missing.
Figure 3. Market hours outcomes before and after the Boston marathon terrorist attack: hours worked in the main job and in other jobs.
1 2 3 4 5 6 M ea n of w or ki ng h ou rs -30 -25 -20 -15 -10 -5 0 5 10 15 20 25 30
days before and after the Boston marathon bombing
The graph shows mean individual working hours per day in the main job and also in other jobs (i.e. the sum of the hours worked in any jobs), before and after the Boston Marathon terrorist attack, with day zero
corresponding to Monday April 15th 2013. The dots correspond to the raw means of working hours by bins of
two days. The solid line is non-parametrically fitted using triangle kernel with a bandwidth of 30 days. The dashed lines are the five percent confidence intervals around the triangular kernel estimates. The hours data are drawn from the American Time Use Surveys, which collects activity diaries for the respondents on a given day of the week. The hours measure is weighted using the ATUS weights.
Figure 4. Playing sports and exercising before and after the Boston marathon terrorist attack. 0 10 20 30 40 M ea n of p la yi n g sp o rt s -30 -25 -20 -15 -10 -5 0 5 10 15 20 25 30
days before and after the Boston marathon bombing
The graph shows the mean individual minutes per day in sport and exercising before and after the Boston
Marathon terrorist attack, with day zero corresponding to April 15th 2013. The dots correspond to the raw means
of the time devoted to sport by bins of two days. The solid line is non-parametrically fitted using triangle kernel with a bandwidth of 30 days. The dashed lines are the five percent confidence intervals around the triangular kernel estimates. The hours data are drawn from the American Time Use Surveys which collects activity diaries for the respondents a given day of the week. The activity measure is weighted using the ATUS activity weights.
Figure 5. Household work hours per day in the days before and after the Boston marathon terrorist attack. 1 1. 5 2 2. 5 H ou se ho ld w or k ho ur s pe r da y -30 -25 -20 -15 -10 -5 0 5 10 15 20 25 30
The graph shows mean hours of individual household work per day before and after the Boston Marathon
terrorist attack, with day zero corresponding to April 15th 2013. The dots correspond to the raw means of the time
devoted to doing household work by bins of two days. The solid line is non-parametrically fitted using triangle kernel with a bandwidth of 30 days. The dashed lines are the five percent confidence intervals around the triangular kernel estimates. The hours data are drawn from the American Time Use Surveys which collects activity diaries for the respondents a given day of the week. The activity measure is weighted using the ATUS activity weights.
Table 3. Regression-discontinuity estimates of the effect of the Boston marathon attack on individual happiness.
Sample April 15 dropped States close by Other States All women Women in other States
Mean happiness 4.43 4.43 4.58 4.40 4.51 4.57
tena days before T (1.60) (1.60)
(1.43) (1.67) (1.52) (1.52)
Non-parametric local polynomial triangular Kernel estimates
Bandwidth 7 days -0.79** -1.18* -1.69** -0.36 -0.81** -0.55 (0.33) (0.65) (0.55) (0.37) (0.29) (0.38) Bandwidth 10 days -0.86** -1.14** -1.57** -0.49 -0.97** -0.89** (0.29) (0.45) (0.60) (0.34) (0.30) (0.37) Bandwidth 14 days -0.75** -0.91** -1.40** -0.44 -0.85** -0.81** (0.30) (0.43) (0.59) (0.31) (0.30) (0.35) Bandwidth 21 days -0.62** -0.70** -1.50** -0.26 -0.77** -0.66** (0.26) (0.34) (0.56) (0.28) (0.28) (0.32) Bandwidth 26 days -0.55** -0.60** -1.47** -0.21 -0.68** -0.56** (0.21) (0.26) (0.52) (0.25) (0.26) (0.29) Bandwidth 38 days -0.45** -0.47** -1.23** -0.19 -0.58** -0.51** (0.18) (0.21) (0.45) (0.21) (0.21) (0.26)
Linear regression model including the treatment dummy and interactions with the running variable
Bandwidth 7 days -0.91** -1.17** -1.59** -0.53 -1.07** -1.05** (0.36) (0.55) (0.67) (0.39) (0.40) (0.47) Bandwidth 10 days -0.71** -0.82* -1.30** -0.47 -0.98** -1.00** (0.32) (0.45) (0.62) (0.34) (0.33) (0.38) Bandwidth 14 days -0.63** -0.75** -1.60** -0.26 -0.73** -0.58* (0.28) (0.37) (0.59) (0.30) (0.31) (0.36) Bandwidth 21 days -0.54** -0.58** -1.57** -0.20 -0.61** -0.46 (0.24) (0.28) (0.53) (0.25) (0.27) (0.30) Bandwidth 26 days -0.43* -0.44* -1.27** -0.15 -0.65** -0.57* (0.23) (0.26) (0.48) (0.24) (0.27) (0.31) Bandwidth 38 days -0.36** -0.37* -0.41** -0.15 -0.41** -0.40* (0.18) (0.20) (0.19) (0.19) (0.21) (0.24)
All the models are estimated using the ATUS Well-Being module weights. The sub-sample labelled “States close by” includes the geographically-close States of Connecticut, Massachusetts, Maine, New Hampshire, New Jersey, New York, Pennsylvania, Rhode Island and Vermont, with the sample going from 275 (bandwidth 7 days) to 1135 (bandwidth 38 days). The subsample labelled “other States" includes the remaining States, with the sample size
Table 4. Regression-discontinuity estimates of the effect of the Boston bombing on other individual feelings
Sample Drop States close
by Other states Women April 15
average of the ten days before treatment (1.91) (1.91) (1.88) (1.91) (2.02)
Bandwidth 7 days Outcome tiredness 0.50 0.80 0.38 0.34 0.50
(0.46) (0.67) (1.05) (0.49) (0.51)
Bandwidth 14 days Outcome tiredness 0.40 0.45 0.23 0.28 0.64
(0.34) (0.44) (0.69) (0.36) (0.42
Bandwidth 38 days Outcome tiredness 0.49** 0.49** 0.44 0.45** 0.58**
(0.22) (0.24) (0.48) (0.23) (0.29)
Mean of sadness feelings 0.56 0.56 0.50 0.58 0.61
average of the ten days before treatment (1.22) (1.22) (1.07) (1.25) (1.38)
Bandwidth 7 days Outcome sadness 0.11 0.51 -0.08 0.07 0.33
(0.31) (0.42) (0.65) (0.30) (0.47)
Bandwidth 14 days Outcome sadness 0.22 0.42 0.20 0.21 0.30
(0.23) (0.27) (0.49) (0.24) (0.35)
Bandwidth 38 days Outcome sadness 0.15 0.21 0.19 0.15 0.14
(0.15) (0.15) (0.33) (0.16) (0.22)
Mean of pain feelings 0.88 0.88 0.93 0.87 1.07
average of the ten days before treatment (1.48) (1.48) (1.39) (1.50) (1.69)
Bandwidth 7 days Outcome painfulness -0.77** -0.88** -1.60** -0.65* -0.55
(0.37) (0.38) (0.80) (0.39) (0.60)
Bandwidth 14 days Outcome painfulness -0.31 -0.33 -0.77 -0.26 -0.27
(0.26) (0.25) (0.72) (0.27) (0.41)
Bandwidth 38 days Outcome painfulness 0.16 0.24 -0.04 0.19 0.10
(0.17) (0.17) (0.43) (0.18) (0.27)
Mean of stress feelings 1.46 1.46 1.03 1.55 1.45
average of the ten days before treatment (1.86) (1.86) (1.62) (1.89) (1.86)
Bandwidth 7 days Outcome stress 1.25** 1.30** 1.76** 0.85* 1.27**
(0.41) (0.58) (0.51) (0.48) (0.53)
Bandwidth 14 days Outcome stress 0.71** 0.62 1.54** 0.35 1.16**
(0.35) (0.43) (0.63) (0.39) (0.45)
Bandwidth 38 days Outcome stress 0.34 0.22 1.23** 0.07 0.75**
(0.24) (0.25) (0.50) (0.25) (0.32)
Mean of meaningfulness feelings 4.25 4.25 4.60 4.17 4.59
average of the ten days before treatment (1.88) (1.88) (1.48) (1.96) (1.70)
Bandwidth 7 days Outcome meaningfulness -0.02 0.02 -0.26 0.01 -0.57
(0.34) (0.50) (0.45) (0.43) (0.40)
Bandwidth 14 days Outcome
meaningfulness 0.28 0.24 -0.02 0.31 -0.42
(0.29) (0.38) (0.50) (0.34) (0.36)
Bandwidth 38 days Outcome
meaningfulness 0.11 0.20 -0.48 0.29 -0.48**
(0.21) (0.23) (0.45) (0.23) (0.26)
All the models are estimated using the ATUS Well-Being module weights. Standard errors are clustered by respondent (as emotional feelings are collected with respect to three activities randomly selected for each respondent). ** p<0.05, * p<0.1
Table 5. Regression-discontinuity estimates of the effect of the Boston marathon attack on affect balance (the difference between mean positive feelings and mean negative feelings).
Sample Drop April 15 States close by Other States Women Women in other States
Mean affect balance 3.03 3.03 3.30 2.97 3.16 3.19
tena days before treatment (2.07) (2.07) (1.70)
(2.14) (2.15) (2.19)
Non-parametric local polynomial triangular Kernel estimates
Bandwidth 7 days -0.69* -1.03 -1.11 -0.33 -1.15** -0.64 (0.39) (0.65) (0.74) (0.45) (0.50) (0.50) Bandwidth 10 days -0.70* -0.95* -1.05 -0.37 -1.35** -1.10** (0.37) (0.56) (0.70) (0.41) (0.51) (0.51) Bandwidth 14 days -0.50 -0.63 -1.00 -0.21 -1.15** -0.96** (0.35) (0.49) (0.68) (0.39) (0.51) (0.50) Bandwidth 21 days -0.44 -0.55 -1.41** -0;06 -1.00** -0.74* (0.31) (0.39) (0.65) (0.34) (0.45) (0.45) Bandwidth 26 days -0.46* -0.55* -1.47** -0.09 -0.95** -0.70* (0.29) (0.34) (0.62) (0.31) (0.41) (0.40) Bandwidth 38 days -0.46* -0.52* -1.33** -0.16 -0.95** -0.74** (0.25) (0.28) (0.54) (0.26) (0.35) (0.35)
Linear regression with interactions of the treatment and the polynomial in the days elapsed since the bombing
Bandwidth 7 days -0.85** -1.09* -1.03 -0.56 -1.48** -1.36** (0.42) (0.61) (0.78) (0.47) (0.61) (0.62) Bandwidth 10 days -0.45 -0.52 -0.85 -0.26 -1.32** -1.24** (0.39) (0.52) (0.73) (0.42) (0.55) (0.55) Bandwidth 14 days -0.40 -0.53 -1.60** 0.03 -0.98** -0.64 (0.33) (0.43) (0.73) (0.38) (0.51) (0.51) Bandwidth 21 days -0.54* -0.62* -1.66** -0.15 -0.97** -0.74* (0.29) (0.33) (0.75) (0.31) (0.41) (0.41) Bandwidth 26 days -0.47* -0.51* -1.39** -016 -1.05** -0.82* (0.29) (0.32) (0.58) (0.31) (0.41) (0.44) Bandwidth 38 days -0.41* -0.44* -1.31** -0.12 -0.85** -0.66** (0.22) (0.24) (0.52) (0.23) (0.31) (0.32)
All the models are estimated using the ATUS Well-Being module weights. The sub-sample labelled “States close by ” includes the geographically-close States of Connecticut, Massachusetts, Maine, New Hampshire, New Jersey, New York, Pennsylvania, Rhode
Table 6. Regression-discontinuity estimates of the effect of the Boston marathon attack on individual time allocation (local polynomial estimates)
Sample
Drop April 15th
States
close by Other States Women Women in other States
Mean market hours per day 2.76 2.76 1.40 2.73 2.13 2.08
in the ten days before treatment (4.05) (4.05) (3.65) (4.02) (3.53) (3.4)
Bandwidth 7 days: market hours 3.68** 5.30** 3.52** 3.97** 3.39** 4.39**
(0.64) (1.03) (1.17) (0.99) (1.15) (1.09)
Bandwidth 21 days: market hours 1.04* 1.23* 0.75 1.17* 1.55** 1.89**
(0.61) (0.65) (0.13) (0.68) (0.77) (0.81)
Bandwidth 26 days: market hours 0.89* 0.99* 0.53 1.04* 1.30* 1.62**
(0.55) (0.57) (1.05) (0.61) (0.68) (0.73)
Bandwidth 38 days: market hours 0.87** 0.93* 0.20 1.07** 1.14** 1.33**
(0.46) (0.48) (0.94) (0.52) (0.56) (0.61)
Mean of household
work per day 2.76 2.76 2.48 2.73 2.25 2.08
average of the ten days before treatment (4.05) (4.05) (3.45) (4.02) (2.47) (3.44)
Bandwidth 7 days: household work -0.15 -0.22 0.31 -0.37 -0.44 -0.49
(0.52) (0.81 (1.43) (0.47) (0.75) (0.62)
Bandwidth 21 days: household work 0.10 0.08 0.93 -0.14 -0.29 -0.43
(0.32) (0.36) (0.99) (0.29) (0.51) (0.43)
Bandwidth 26 days: household work 0.14 0.15 0.86 -0.06 -0.07 -0.18
(0.29) (0.31) (0.88) (0.26) (0.46) (0.42)
Bandwidth 38 days: household work 0.10 0.10 5.22** -0.07 -0.05 -0.15
(0.24) (0.26) (2.16) (0.24) (0.39) (0.39)
Mean of active leisure per day 0.36 0.36 0.38 0.35 0.20 0.22
average of the ten days before treatment (0.97) (0.97) (0.85) (1.00) (0.54) (0.57)
Bandwidth 7 days: active leisure -0.24 -0.29 -0.82 -0.08 -0.05 0.05
(0.19) (0.21) (0.56) (0.19) (0.15) (0.21)
Bandwidth 21 days: active leisure -0.22* -0.19 -0.60** -0.11 -0.07 -0.03
(0.12) (0.13) (0.30) (0.13) (0.08) (0.11)
Bandwidth 26 days : active leisure -0.21* -0.19 -0.52* -0.13 -0.10 -0.07
(0.11) (0.12) (0.28) (0.12) (0.07) (0.09)
Bandwidth 38 days : active leisure -0.18* -0.16* -0.29 -0.15 -0.16** -0.16**
(0.10) (0.10) (0.24) (0.11) (0.06) (0.07)
Mean of television and radio time per day 2.80 2.80 3.16 2.71 2.83 2.85
average of the ten days before treatment (2.64) (2.64) (2.09) (2.76) (2.69) (2.85)
Bandwidth 7 days: television & radio 0.17 -0.77 -0.15 0.31 -0.66 0.02
(0.66) (0.66) (0.33) (0.72) (0.74) (0.81)
Bandwidth 21 days: television & radio 0.29 0.06 -0.34 0.46 -0.55 -0.18
(0.39) (0.37) (0.93) (0.42) (0.42) (0.46)
Bandwidth 26 days : television & radio 0.29 0.12 -0.33 0.45 -0.51 -0.24
(0.35) (0.34) (0.83) (0.38) (0.38) (0.41)
Bandwidth 38 days : television & radio 0.31 0.19 -0.19 0.42 -0.40 -0.27
(0.30) (0.30) (0.70) (0.33) (0.32) (0.35)
Table 7. Regression-discontinuity estimates for the 2012 mass shooting at Sandy Hook Elementary School,
which took place on December 14th (local polynomial estimates).
Sample States close by Individuals with children>0 Women of age 25-40 Individuals aged 15 or 16 Mean happiness 4.18 4.17 4.18 4.25 4.45
tena days before SH (1.67)
(1.68) (1.67) (1.61) (1.77) Bandwidth 7 days 0.77 1.04 0.77 0.64 1.38 (0.52) (1.06) (0.52) (0.78) (1.25) Bandwidth 10 days 0.42 0.63 0.42 -0.31 1.39 (0.43) (0.90) (0.43) (0.80) (1.15) Bandwidth 14 days 0.33 0.26 0.33 -0.07 0.98 (0.37) (0.74) (0.37) (0.71) (0.93) Bandwidth 21 days 0.10 -0.06 0.10 -0.31 1.01 (0.21) (0.61) (0.32) (0.64) (0.83) Bandwidth 26 days 0.08 -0.08 0.08 -0.34 0.97 (0.30) (0.59) (0.30) (0.63) (0.78) Bandwidth 38 days -0.00 -0.08 -0.01 -0.28 0.61 (0.28) (0.55) (0.28) (0.61) (0.67)
Mean affect balance 2.87 3.04 2.87 2.98 3.33
tena days before SH (2.11) (2.22) (2.11) (2.04) (1.49)
Bandwidth 7 days 0.86 0.11 0.86 -0.92 0.79 (0.62) (1.71) (0.62) (1.28) (0.83) Bandwidth 10 days 0.35 -0.31 0.35 -0.93 0.77 (0.54) (1.58) (0.54) (1.29) (0.90) Bandwidth 14 days 0.15 -0.70 0.15 -0.30 0.44 (0.46) (1.34) (0.46) (1.14) (0.83) Bandwidth 21 days -0.15 -0.99 -0.15 -0.12 0.36 (0.40) (1.16) (0.40) (0.97) (0.78) Bandwidth 26 days -0.16 -0.92 -0.16 -0.11 0.31 (0.38) (1.13) (0.39) (0.95) (0.74) Bandwidth 38 days -0.17 -0.71 -0.17 -0.02 0.04 (0.36) (1.07) (0.36) (0.88) (0.62)
The data are drawn from the 2012 ATUS and Well-Being Module Survey. All the models are estimated using the ATUS Well-Being module weights and clustering standard errors at the level of the individual. The treatment is
the day of the mass shooting at Sandy Hook elementary school: Friday 14th December 2012. States close by are
Connecticut, Massachusetts, Maine, New Hampshire, New Jersey, New York, Pennsylvania, Rhode Island and Vermont. ** p<0.05, * p<0.1.