HAL Id: halshs-01359156
https://halshs.archives-ouvertes.fr/halshs-01359156
Submitted on 1 Sep 2016
HAL is a multi-disciplinary open access archive for the deposit and dissemination of sci-entific research documents, whether they are pub-lished or not. The documents may come from teaching and research institutions in France or abroad, or from public or private research centers.
L’archive ouverte pluridisciplinaire HAL, est destinée au dépôt et à la diffusion de documents scientifiques de niveau recherche, publiés ou non, émanant des établissements d’enseignement et de recherche français ou étrangers, des laboratoires publics ou privés.
Ports and the local embedding of commodity flows
César Ducruet, Hidekazu Itoh, Olivier Joly
To cite this version:
César Ducruet, Hidekazu Itoh, Olivier Joly. Ports and the local embedding of commodity flows. Papers in Regional Science, Springer Verlag, 2015, 94 (3), pp.607-627. �10.1111/pirs.12083�. �halshs-01359156�
Ports and the local embedding of commodity flows
Pre-final version of the article published in Papers in Regional Science, 94(3): 607-627, 2015
César DUCRUET, CNRS & UMR 8504 Géographie-Cités, Paris, France1 [email protected]
Hidekazu ITOH, Kwansei Gakuin University, Japan [email protected]
Olivier JOLY, University of Le Havre & UMR 6063 IDEES, France [email protected]
Abstract
Empirical evidence remains lacking about the territorial embedding of material flows. An analysis of 189 port regions in advanced economic areas, or Europe, Japan, and the United States, validates a number of ideas proposed by regional science and transport geography. Core economic regions such as large urban tertiary centres concentrate most valued, diversified, and weighty traffics, while more peripheral and traditional ones tend to specialize in bulky traffics. Moreover, the level of industry relatedness of port traffics appears as a key component of the socio-economic wealth of port regions. The research also underlines noticeable linkages between types of port regions and types of port-related policies across the three studied areas.
Keywords: freight flows; logistics; regional development; value chain; port activities
Ports and the local embedding of commodity flows
1. Introduction
Contemporary transport systems are marked by a dematerialization of the economy and rising average transport distances thereby making it increasingly difficult for decision-makers and scholars to map and explain the distribution of firms and flows in relation to their spatial environments (Leslie and Reimer, 1999; Hesse and Rodrigue, 2004; Wang et al., 2007). Continuous progress in the physical and organisational connectivity of transport systems as well as reduced trade barriers and logistics costs fostered the spatial volatility of flows, resulting in both concentration and diffusion of markets and flows across regions and nations (Fujita et al., 1999; Hesse, 2010) as well as in important freight transport detours between production and consumption areas (Woxenius, 2010). As noted by Janelle and Beuthe (1997), the absence of disaggregated data on detailed flows has often been a major obstacle to the analysis of their spatial determinants. Such state of affairs also relates with the persistent divide between qualitative and quantitative approaches within transport geography as well as the difficulty identify underlying causal structures (Goetz et al., 2009). The economic opportunities permitted by sea access and port efficiency seem more valid at national and continental levels than at infra-national levels nowadays (Limao and Venables, 2001; Clark et al., 2004; Haddad et al., 2006; Behrens et al., 2006).
The core hypothesis explored in this paper is the interdependence between the commodity specialization of port traffics passing through a region and the socio-economic specialization of this region. What are the implications of this level of industry relatedness, and are there invariants across the world? Answering such questions requires a number of theoretical and methodological clarifications about the nature of port activities and port regions. On the one hand, regional scientists provide a broader perspective based on modelling: "a greater concentration of industries in a given region generates a larger transport flow through the region, and lowers the cost of transportation via the region due to density economies, which in turn attracts a larger number of firms to the region. A successful region eventually emerges as an interregional transport hub as well as an industrial center" (Mori and Nishikimi, 2002, pp. 194-195). On the other hand, many field observations by transport geographers offer contrasted evidences about ports' local linkages.
While ports have been largely left aside by regional development literature (Hall, 2002; Ducruet et al., 2009), regional development has become less popular in port geography over the last decades (Ng, 2013). Three main arguments motivate further research, however. First, the multiplicity of case studies and their somewhat contradictory results lead to confusion, but one fact remains certain: not every port has become disconnected from its local economic base. Recent reports from the European Seaports Organization (Notteboom, 2010) and the OECD (Merk et al., 2011) insisted about the need to further understand and measure the links between port activities and local economies. Yet, this project remains harmed by the absence of both a clear theoretical framework and a systematic quantitative analysis. Second, two specific contributions from the New Economic Geography (NEG) provide the base upon which a theoretical framework can be built. Fujita and Mori (1996) proposed a model of local port-related urban growth, while Tabuchi and Thisse (2002) argued that agglomeration and dispersion forces are commodity-specific and depend on a certain degree of regional specialization. Third, detailed infra-national data about port traffics and socio-economic characteristics is internationally available nowadays, allowing to confront theory with new empirical evidences. This paper proposes an application of the theoretical framework to three large and advanced economic areas of the world, namely Europe, Japan, and the United States. The main hypothesis explored by this research is thus the permanency of port-region linkages despite contemporary logistical and territorial evolutions, and the existence of invariants across the world in terms of the types and location of port regions as well as related policies.
The remainder of this paper is as follows. Section 2 further develops the theoretical framework based on a review of both regional development and transport geography literatures. Section 3 introduces the data and methodology used to compare the mutual specialization of port traffic and local economies in Europe, Japan, and the United States. Section 4 describes the main results obtained from a Principal Components Analysis (PCA) and non-hierarchical clustering of port regions. Finally, Section 5 discusses the implications of the results for port policy and regional planning as well as prospects for further research in the field.
2.1 Regions, transport costs, and commodity specialization
The link between transport and regional development is one central pillar of the New Economic Geography (NEG). Although the case of ports is not directly addressed by NEG except from the work by Fujita and Mori (1996), a number of elements from other works are used in this study to build a framework for the analysis of ports and port regions. Agglomeration of firms or populations occurs due to unequal levels of accessibility to spatially dispersed markets (Fujita and Thisse, 2002). This accessibility depends on trade costs - of which transaction costs, tariff and non-tariff costs, transport costs, and time costs - that are inherent to exchanges across locations (Behrens, 2006; Spulber, 2007). NEG focuses primarily on the trade-off between increasing returns in production and transport costs (Krugman, 1991, 1995) as well as between agglomeration and dispersion forces, core regions and peripheral regions. For instance, port activities located in a peripheral region might only attract second-order activities (e.g. manufacturing), and higher-order activities (e.g. services such as logistics and distribution, including finance) remain concentrated in the core region (Fujita and Mori, 1996).
However, improving transport infrastructure may exacerbate regional disparities and lead to over-agglomeration in the core region (Ottaviano and van Ypersele, 2005). This is because high transport costs sustain the dispersion of activities, while low transport costs foster their agglomeration (Krugman, 1991; Fujita et al., 1999; Combes et al., 2008). Such processes also affect intra-firm organization. Due to rising incomes in the core region resulting from agglomeration, firms may find advantageous to relocate some activities to the periphery to benefit from lower wages, resulting in dispersion (Krugman and Venables, 1995; Puga, 1999). This fragmentation process can be possible only when transport costs and communication costs have reached a sufficiently low level (Feenstra, 1998; Spulber, 2007; Leamer and Storper, 2001). Nevertheless, it results in a separation between firms’ strategic functions in the core, and firms’ production functions in the periphery (Faini, 1999; Fujita and Thisse, 2006; Robert-Nicoud, 2008). Intermediate locations and transport nodes can emerge between different regions and have varied local economic impacts according to the distance to core regions internally and the level of trade openness externally (Konishi, 2000; Glaeser and Kolhase, 2004; Fujita and Mori, 2005; Behrens et al., 2006; Behrens, 2007).
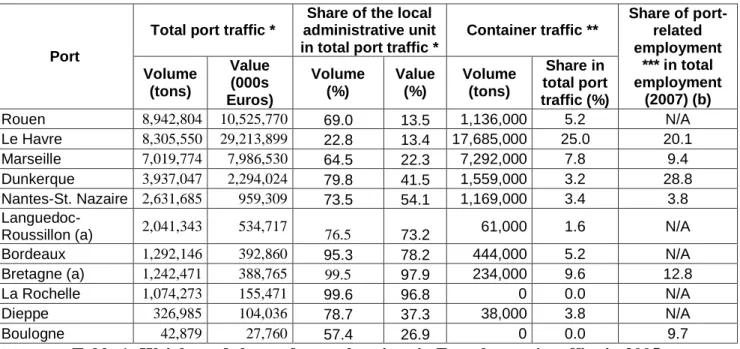
One crucial idea developed by Tabuchi and Thisse (2002) is that different sorts of goods exhibit distinct spatial patterns because of the commodity-specific dimension of agglomeration and dispersion forces. Notably, heavy industries and industries producing goods with high transport costs are more agglomerated than light industries and industries with lower transport costs. Such ideas are fully relevant in the case of ports, since different cargo types will have different affinities with the outlying region where port traffic takes place (Haefner et al., 1980; Marti, 1985). For instance, port-industry complexes process imported raw materials for local transformation, such as petrochemicals (Rodrigue et al., 2009; Dunford and Yeung, 2009). The size and diversity of urban economies adjacent to ports influences to some degree the size and diversity of port traffics in the United States (Carter, 1962) and in Europe (Ducruet et al., 2010), while smaller ports are often more specialized and bound to local industries by handling intermediate inputs (Kuby and Reid, 1992). The relatively good coincidence between the value of goods passing through seaports and their travelled distance inland was demonstrated by Debrie and Guerrero (2008) based on the French case. Table 1 provides a good illustration of this logic, where the largest and most valued traffics have less dependent on the local economy, notably for Le Havre, Paris' main gateway and France's largest container port. More bulky traffics are thus more locally oriented. Although transport geography seems to support the NEG findings, a number of logistical distortions that appeared in recent decades should be taken into account.
[Insert Table 1 about here]
2.2 Towards a model and typology of port-region linkages
The aforementioned volatility of flows across locations have somewhat blurred the core-periphery dichotomy. As evoked by Fujita and Mori (1996), some large port cities have continued to grow even though their initial advantage of direct access to cheaper and long-distance water transportation has diminished over time. This well-known process of port-city physical and functional separation (Bird, 1963; Hoyle, 1989), however, must not ignore that port activities have everything but disappeared. New infrastructures were created in the periphery such as deepwater sites and greenfield areas (Hayuth, 1981) during stages of urban growth, economic diversification, and waterfront redevelopment in the traditional port cities (Ducruet and Lee, 2006). Many port and logistics activities were also shifted inland around dry ports during the so-called regionalization phase in order to expand hinterland control and
relieve the seaport city from congestion and lack of space (Notteboom and Rodrigue, 2005), thus recalling classic models on the spatial evolution of port systems (Taaffe et al., 1963). Such logistical changes made possible that certain core regions become peripheral and
certain peripheral regions become central in the port system. Four types of regions rather
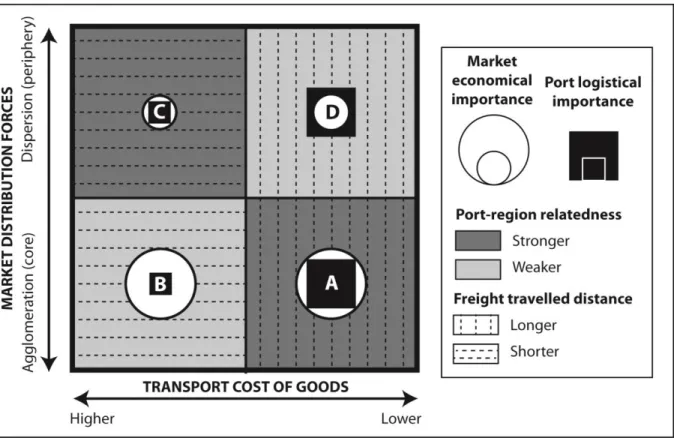
than two should thus be considered when having a closer look at the reality of modern transport systems. A typology is proposed in Figure 1 based on two main dimensions: agglomeration-dispersion forces and the transport cost of goods. Regions are also differentiated according to the volume of port traffics and the size of the regional market. Another yet crucial dimension of this model is the extent to which port activities are locally embedded or not. As explored by Neffke et al. (2011), regions with higher industry relatedness have been more robust to change over time than other regions. Stronger interdependence between port activities and other economic activities in the region appears as a competitive advantage favouring market stability.
While certain core regions have been able to sustain both higher accessibility and higher socio-economic welfare levels compared with national average (Type A), others have developed at the expense of port functions (Type B). The case of A-regions notably finds its justification in the work of Ducruet (2009) on OECD port regions where regional specialization in the industrial and tertiary sector had a negative and positive influence respectively on the volume and growth of container port throughputs. This result was interpreted as a strong evidence about both the difficulties faced by industrial regions in advanced economies, such as the fall of demand resulting from plant closure and relocation, and the concentration of higher valued flows at urban regions, where services and populations agglomerate. Several scholars also insisted on the ability of certain large port cities to maintain high levels of port activity, despite all the physical difficulties of a dense urban environment, due to the benefits levied by ports from urbanization economies and the tertiary sector (Lee et al., 2008; Lee and Ducruet, 2009; Wang and Chen, 2010; Hall and Jacobs, 2012; Wang and Ducruet, 2012). In China however, gross regional product, amount of Foreign Direct Investment, and industrial productivity had a positive influence on port traffic growth during the 1995-2007 period (Cheung and Yip, 2011).
The case of B-regions as in the model of Fujita and Mori (1996) is validated by a number of case studies depicting the dereliction of ports' local linkages with both quantitative (De Langen, 2007; Musso et al., 2000) and qualitative methods (Hoare, 1986; Campbell, 1993;
Vallega, 1996; McCalla et al., 2001). The weak influence of port traffic volume on the amount of maritime advanced producer services has been confirmed globally (Jacobs et al., 2011) but certain specialized gateways keep concentrating both tertiary activities and traffics, such as Rotterdam and Houston (Jacobs et al., 2010). Container traffic volumes have indeed become less correlated with the demographic size of port cities since the 1990s due to many factors such as port competition and diseconomies of scales in large urban nodes (Ducruet and Lee, 2006), but also the changes in the urban economy itself, such from industrial specialization to service specialization. Port regions even appeared poorer than other regions in Europe (Lever, 1995) and the United States (Grobar, 2008; Hall, 2009) in terms of average regional GDP per capita and wage levels, while port traffic growth has only limited effects on local employment growth (Ferrari et al., 2010). The necessity to relocate port activities thus provoked certain mismatches between the respective importance and nature of flows and local economies in both core regions (type B) and peripheral regions (type D).
While certain peripheral regions remain poorly connected in the transport system (Type C), others have been the focus of new investments in transport infrastructure (Type D). In the case of C-regions, ports simply serve the adjacent hinterland by carrying basic commodities such as mining and agricultural products. The case of D-regions differs by their focus on transit flows. Several transportation gates serving the (inland) core regions were planned as growth poles through important investments in port and transport infrastructures anticipating further port-related growth, but the lock-in effect or "urban shadow" of existing core regions often prevented such benefits to occur as well as the lack of industry relatedness of new port activities (Stern and Hayuth, 1984; Fujita and Mori, 1996). This questions the ability of intermediate hubs to foster regional economic development given their poor contribution to the local economy and despite the very high volume and value of the transferred goods (Rodrigue and Notteboom, 2010). This form of diversification might in fact exacerbate regional disparities at the expense of the periphery (Lafourcade and Thisse, 2011). D-regions are thus characterized by a mismatch between transit trade and local demand. This gap varies from one region to the other depending on many factors such as the size and geographic coverage of the hinterland2, the modal split of port traffics (e.g. road, rail, river, pipeline,
2 For instance, it was estimated that 70% of Marseilles' port traffic in 1900 was destined to local industries
(Garnier and Zimmermann, 2004) against 64% nowadays but only 22% in value (see Table 1). In the case of New York, 75% of port traffic is generated and consumed within a 300 mile radius from the port (Rodrigue, 2003). The urban areas of Bordeaux (France) and Busan (South Korea) accounted for only 15% and 10% of respective port traffics in recent years (source: port authorities), while the Capital Region in South Korea
sea), the freight detours in a context of port competition over inland markets, and the transhipment activity (e.g. coastal and short-sea shipping, hub-and-spokes, and relay/interlining services such as in liner shipping). The fact that about 40% of French exports pass through Antwerp and other Benelux ports is a good example of such detours (Gouvernal et al., 2010). Yet, transit flows are not entirely disconnected from the local economy since they create the need for additional activities and infrastructures (e.g. warehousing, packaging) and participate to the development of the so-called port cluster (De Langen, 2004).
[Insert Figure 1 about here]
3. Data and methodology
The port region remains a rather fuzzy concept broadly defined as the "immediate hinterland" of the port where most of its clients and port-related activities are located (Ducruet, 2009). The delineation of functional port regions or even hinterlands is often hampered by the absence of disaggregated data (McCalla et al., 2004; Guerrero, 2010). Nevertheless, 115 NUTS-2 regions (Europe, 16 countries), 39 prefectures (Japan), and 35 States (United States) recording port traffic in 2008 were selected due to the availability of comparable socio-economic data at such levels. Administrative boundaries do not always correspond to the true extent of port regions, such as the small Lander of Hamburg or the large California state including Los Angeles, Oakland, and other ports. It is also necessary to bear in mind huge contrasts in the spatial pattern and function of hinterlands within each studied area (Figure 2). Europe is more characterized by an inland concentration of main markets as opposed to Asia and North America, although the latter has also developed continental connections through intermodal transport. Gateway transhipment and port-region linkages thus exhibit different logics depending on the local context.
[Insert Figure 2 about here]
concentrates about 90% of Incheon port's total traffics (Ducruet et al., 2012). In Japan, about 96% of bulky cargos serve local hinterlands in 2009, while the international container cargos reach further market, for example, 12% of export cargo and 35 % of import cargo at Tokyo port are from/to local hinterlands in 2008 (MLIT, 2009).
The nature and level of economic specialization of such regions was measured on the level of six employment sectors (see Table 2)3. In addition to these core variables were added regional GDP, unemployment, population size and population density as proxies for market size and economic wealth. Each regional indicator was calculated as a location quotient based on the national average, except from demographic size and population density that are simply divided by the average score. Individual port traffics were summed by regional unit across six main commodity groups4.
[Insert Table 2 about here]
The possible links among those port and regional indicators remain difficult to address for two main reasons. First, the "risk of attributing to port-related differences what are in fact differences in regional economic structure" (Hall, 2002) is inherent to any multivariate analysis of mixed data. Second, the same commodity groups may be linked to different economic activities. Manufactured goods that are generally containerized can relate to manufacturing, retail, transport, and logistics (e.g. warehousing, distribution), cereals may be exported from an agricultural port region after production but imported by a more urban region for consumption, and oil products such as chemicals may fuel heavy industries but also be exported from production regions. The link between port traffic and local activities is thus multidimensional and depends greatly on the direction of flows. For such reasons, other key variables were added, such as international traffic (i.e. extra-EU27 for Europe), inbound traffic, level of commodity diversity, and level of spatial friction. International and inbound traffic express the scope and directionality of port activities, while the level of commodity variety reflects the capacity to handle multiple flows. The level of spatial friction was derived from the work of Debrie and Guerrero (2008) on French port hinterlands. Their analysis applied a spatial interaction model to customs data on the amount of transported freight by commodity types to/from seaports within the country, in order to estimate the role of distance on the volume and nature of port-related flows. In general, manufactured goods travel longer distances than liquid and dry bulks. Each of the six traffic categories was weighted according
3 The principal data sources are Eurostat for Europe, the Annual Report on Prefectural Accounts (Cabinet Office
of the Government), the Labor Force Survey, Employment Structure Basic Survey, and National Population Census (Statistics Bureau, Ministry of Internal Affairs and Communications) for Japan, the Bureau of Statistics and the OECD Territorial Database for the United States.
4 Data sources used to measure port traffics are Eurostat for Europe, the Ministry of Land, Infrastructure,
to their results by commodity-specific parameters5. This indicator particularly highlights
which commodities are more likely to remain produced, consumed, or processed within the port region (captive hinterland) as opposed to more mobile commodities reaching farther markets (contestable hinterlands).
4. Traffic specialisation and regional specialisation
4.1 Main trends
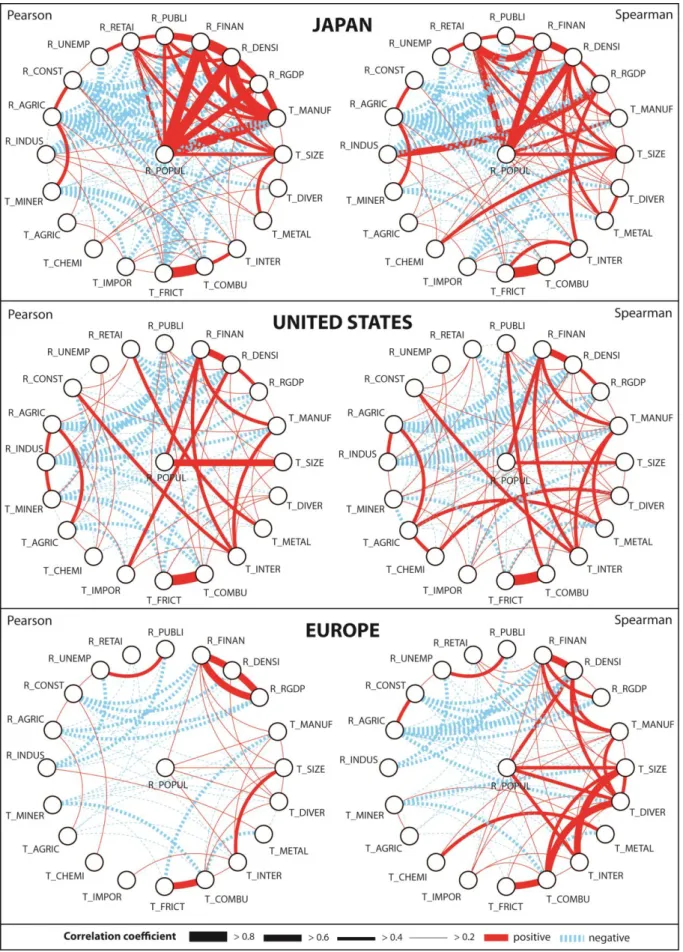
The comparison of Pearson and Spearman correlations (Figure 3) reveal interesting commonalities and differences among geographical areas. Japan is better defined by significant correlations between traffic volume, manufactured goods, population size and density, GDP, and the private service sector. This underlines the strong overlap between urban and port hierarchy as in Figure 2 in addition to a significant correlation between agricultural activities and minerals traffic. This is similar to the United States where traffic volume and demographic size have highest correlation, followed by manufactured goods traffic and the financial sector, metals traffic and the retail sector, agricultural goods traffics and the agricultural sector, international traffic and the construction and financial sectors. In Europe, Spearman correlations reveal similar trends, such as the closeness between manufactured goods traffic, the financial sector and population density, while demographic size is positively and significantly correlated with traffic volume, traffic diversity, and international traffic. The nature of port-region linkages remains similar although the statistical significance differs greatly.
[Insert Figure 3 about here]
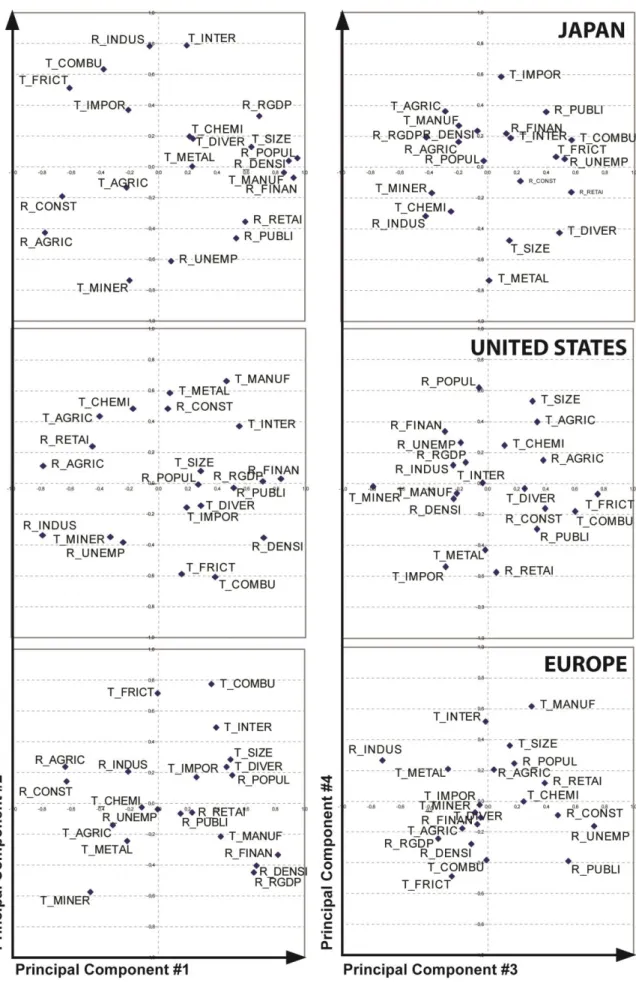
The Principal Components Analysis (PCA) of 21 port and regional variables confirms the higher cumulated variance of Japan (71%) than the United States (59%) and Europe (51%) at the fourth component (Table 3) again reflecting upon their diverse hinterland patterns (Figure 2). The main principal components as well as the non-hierarchical clustering of port regions
5 The weighting value for each commodity type corresponds to the share of variance (%) explained by distance
and has been measured as follows: 30.1% for manufactured goods, 53.7% for chemicals, 57.1% for minerals, 67.9% for metals, 75% for agricultural goods, and 92% for combustibles.
based on the scores for each region of the four components by PCA (Figures 4 to 7) are discussed by geographical area and with reference to the theoretical typology (Figure 1).
[Insert Table 3 about here] [Insert Figure 4 about here]
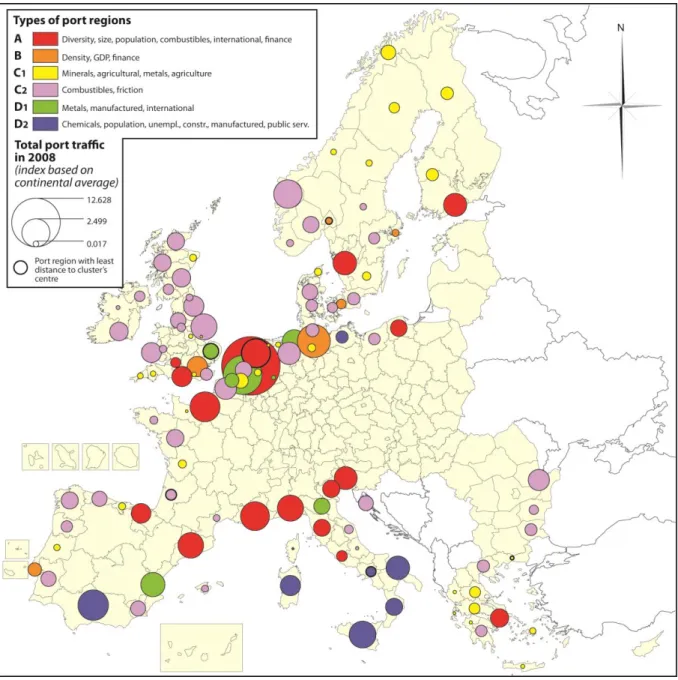
4.2 Europe
The European case confirms the theoretical opposition between core regions and peripheral regions (Figure 4). Larger, richer, and more densely populated regions performing retail and financial activities handle larger, higher valued, and more diversified traffics, while regions specialized in more traditional sectors (agriculture, construction, and industry) tend to concentrate smaller, more specialized, and lower valued traffics (minerals, metals, and agricultural goods). A closer look at the different clusters of regions (Figure 5) allows to further confirm the relevance of the theoretical framework proposed in Figure 1. The A-regions combine high traffic volume and diversity with advanced economic functions (finance) and important market size. Common factors include proximity to the economic core of Europe (e.g. Rotterdam, Amsterdam, Genoa, Venice, Trieste), capital city status (e.g. Piraeus, Rome, Helsinki), major regional economic dimension (e.g. Bilbao, Barcelona, Gdansk, Gothenburg, Southampton, Le Havre, Marseilles). The B-regions constitute a small cluster composed of capital cities having relatively lost their port functions over time (e.g. London, Stockholm, Copenhagen, Lisbon, Oslo), with the exception of Hamburg that still performs very important logistics activities. Recent and current policies include strategies to attract firms and value added in the port (e.g. Altenwerder in Hamburg, Minervahaven, Greenmills, Afrikahaven and Atlaspark in Amsterdam, Pancorbo logistics park near Bilbao) as well as innovative activities (e.g. Rotterdam Cityport), to reduce trucking time and cost to/from the port through road improvements (e.g. Kwiatkowski route in Gdynia, Poland). Other advanced environmental policies are mostly seen in A-regions across Europe, such as offshore wind energy (Le Havre), cold ironing / shore power (Rotterdam, Gothenburg, Venice, Civitavecchia), energy consumption reduction (Portsmouth). On the contrary, B-regions tend to support redevelopment policies such as in London (Docklands) and Stockholm with the shift of container terminals towards the new Norvikudden port and their replacement by the Royal Stockholm Seaport for urban uses.
Other regions are mostly localized at the periphery of Europe and of their host countries. C1 and C2 regions differ from D1 and D2 regions by the stronger industry linkages and higher spatial friction of their traffics (local hinterlands), yet reflecting upon very contrasted situations. C1 regions are traditional economies based on agriculture and mining, where port functions remain the major vector for exporting raw materials to the outside world; therefore they are less concerned by port competition and industrial reconversion. Yet, they can be the focus of very dynamic policies reinforcing such linkages, as seen with the Groningen Energy Park in Groningen, alongside with the port of Eemshaven (recycling, logistics), willing to attract energy-related industries (chemicals, metal-oriented companies, power plants, submarine cables) as well as in Delfzijl port (Handelskade, Chemical Park, Metal Park, De Valgen, Oosterwierum, Delta, Farmsumerpoort, De Zeesluizen and Fivelpoort). Another example is the Kluizendok project (Ghent): where 660 hectares are developed for logistics and intermodal activities, including a new terminal based on biofuels, vegetable oils and liquid bulks. D1 regions are mainly defined by their connection to specific value chains such as metals and manufactured goods (e.g. Valencia, Antwerp, Felixstowe, Bremen, Ravenna) in relation to dynamic light manufacturing activities, such as the food, mechanical, and automotive industries. Port-related policies include the development of inland terminals (dry ports) such as near Antwerp with the Extended Gateway project and notably the Trilogiport multimodal platform (Liege), the attraction of port-related technological centres (e.g. Time-Port in Bremerhaven), and the optimisation of the transit and management of containers (e.g. Flagship in Valencia).
Contrastingly, C2 and D2 regions face important difficulties as reflected by their overall profile. The cluster of C2 regions is defined by combustible traffics and spatial friction, in opposition to GDP, finance, and manufactured goods. Port activities in such regions have thus remained highly specialized in lower valued goods while at the same time, the local economy has been unable to diversify. Many old industrial regions compose this cluster, with Dunkirk (Nord-Pas-de-Calais) serving as a good example of drastic de-industrialization after the demise of coal production since the 1960s. Other examples such as numerous British regions as well as a number of East European regions (e.g. Romania, Croatia) encounter serious reconversion difficulties. D2 regions are better defined by higher unemployment levels, lower production levels, and a dominance of both chemical and manufactured goods. Such regions are mostly located in Southern Europe (southern Italy, Andalucia) with the exception of Mecklenburg-Vorpommern (Germany); they have in common to have been the focus of
growth pole strategies in the 1970s based on petrochemicals and steelworks as well as container hub strategies in the 1990s (e.g. Huelva, Algeciras, Cagliari, Gioia Tauro, Taranto), but such projects have not succeeded in creating more employment and regional balance notably after the oil crisis of the 1970s. Many C2 and D2 regions use waterfront redevelopment as a means diversifying their economy without further linkages with the port, such as fishing, recreation, and leisure activities in Huelva (Muelle de Levante), Alicante (Infantas Elena y Cristina dock), and Malaga (Punta Doncella), creative activities in Dunkirk (Jardin d'expédition), housing, tertiary, and cultural activities in Brest (Plateau des Capucins), Dundee (Victoria and Albert Museum ), Belfast (City Quays), and Liverpool (Wirral Waters). It is only recently that such regions adopted port-related strategies and their results remain to be seen, such as for the Liverpool-Manchester Atlantic Gateway project and the Tees and Hartlepool Portcentric project both suggesting new logistics solutions such as distribution platforms, and the SuperPort project in Liverpool related with airport activities. The green economy is also favoured in Hull and Belfast as a means welcoming new and clean industries.
[Insert Figure 5 about here]
4.3 Japan
The main opposition in Japan (PC1) lies between core and peripheral regions as in Europe, with larger port regions being richer, specialized in financial activities, and handling more voluminous, valued, diversified, export-oriented, and international traffics. Conversely there are regions more specialized in the agricultural and construction sectors with a higher level of spatial friction and handling lower valued goods, such as minerals, agricultural products, and combustibles. Figure 6 confirms that core regions A and B compose the backbone of the Japanese megalopolis: the so-called “Pacific belt” including Tokyo, Chiba, Yokohama, Osaka, Kobe, and Fukuoka. Tokyo stands out by its highest levels of imports, population, density, and concentration of financial activities while B-regions, unlike in the model (Figure 1), are also central in both urban and logistical systems due to the coastal concentration of hinterlands in Japan as seen in Figure 2. Indeed since the late 1960s, the port of Tokyo has continuously upgraded its facilities and has maintained efficient port operations (Itoh, 2002), while the Tokyo Port Terminal Corporation modernized a number of deepwater berths between 1996 and 2004, thereby overtaking Yokohama as largest international container port from 1998 onwards. Moreover, the Tokyo prefecture launched a new master plan for better
integrating various functions such as logistics, human interactions, environment, and safety within this 40 million resident metropolitan area, which also includes major airport activities. The proposed plan thus wishes establishing new logistics centers (e.g. high standard warehouse) connecting both seaport and airport (Haneda airport) for high value cargoes and consumer markets.
Type B regions are well illustrated by the case of Kobe, which port functions suffered from fierce competition in the early 1990s as well as from the Hanshin earthquake in 1995 having provoked the shift of large container traffic volumes to Busan in South Korea. Therefore, Kobe durably lost its third position in world container cargo handling as well as its transhipment functions (from 31.6% in 1994 to 4% in 2007) because budgets could not allow both reconstruction and modernisation. Kobe maintained and even increased its domestic feeder and local cargo function after the earthquake, as well as important passenger traffics, while its total port activity still remained 75% of its 1994 level in 2007. However, there are strategic plans to revive the international dimension of Kobe through management integration with Osaka port by 2015 and investments in new container terminals since 2005 (Shinohara, 2009).
Other regions are more peripheral, except from D1 regions. Those are specialized port regions complementing the functions of nearby tertiary centres through a spatial division of activities (i.e. backward linkages) and via domestic supply chains, such as Mie, Toyama, Aichi, Shizuoka, Fukui, and Ibaraki. Notably, Nagoya is the largest cargo handling port (value and volume) in Japan with nearly half of export cargo being finished cars in 2009, a wide hinterland covering most of Chubu area (central Japan), major highway links with Tokyo and Kansai areas (Osaka and Hyogo) as well as road networks allowing automobile companies such as Toyota to develop dense supply chain distribution with their affiliated companies. The opening of Chubu Centrair International airport in 2005 and road improvements (e.g. new highways) shall reinforce transport efficiency with regard to congestion issues felt at other major ports such as Tokyo. Another example is Hitachi-naka port (Ibaraki, North Kanto) planned as a new logistics center, energy hub (e.g. Tokyo Electric Power Company coal power station) in the early 1980s. The new port opened in 2000 allows shippers to avoid heavy congestion when passing through Tokyo bay area highways before reaching northern hinterlands. Komatsu and Hitachi companies built new manufacturing plants in this area in 2007 and 2008 thus increasing local demand and reducing inland transport costs and
environmental impacts: large machines can be exported directly through local ports instead of being split into parts for road traffic via Tokyo port. C1 regions are directly comparable with the European case, with basic industries composing local and captive hinterlands. Production and transformation functions such as petrochemical, petroleum refining and electronic plants purchase raw materials (e.g. sand, gravel) and ship industrial products both through the port. Land shortage at Oita port for instance motivated further expansion of existing facilities to cope with increasing regional general cargo traffic.
The two last types C2 and D2 exhibit certain mismatch between port and regional specialization. Being one of the only international ports along the Sea of Japan, Niigata mostly handles liquefied gas and containers alongside oil and LNG storage. The prefecture and city governments in the late 1970s supported the development of several industrial parks welcoming chemical, food, and precision machines. However, storage facilities and power plants (e.g. Tohoku Electric Power Company) generate specialized traffics destined to distant regions such as Tohoku (North Japan), thus weakening local port-industry linkages. An example of D2 region is Sendai port that opened in 1971 to serve existing petrochemical plants but without enticing further industrial development. Sendai thus succeeded in developing other traffics such as ferry services, domestic feeder cargos (e.g. containers), Pacific routes with North America, and new rail cargo services to complement Tokyo Bay ports since 1998. The transit nature of flows has not yet been able to entice local port-related economic development.
[Insert Figure 6 about here]
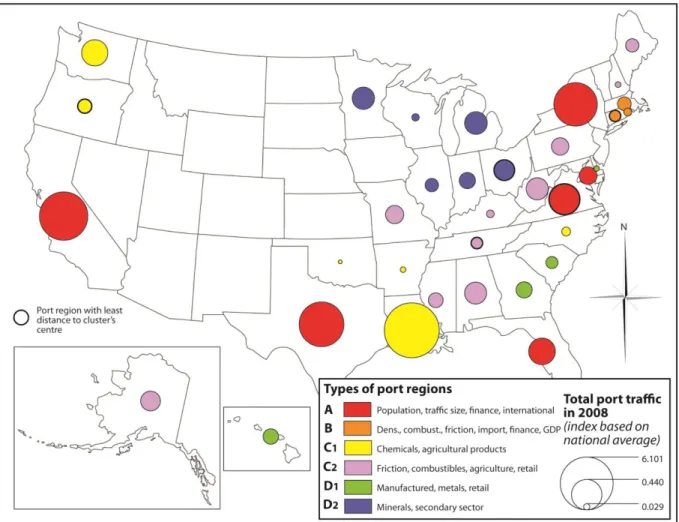
4.4 United States
The case of the United States provides a very clear opposition (PC1) between large urban tertiary centres concentrating manufactured goods as well as combustibles (core regions), and industrial/agricultural regions specialized in raw materials traffics (peripheral regions). The A-regions are defined by the larger size and more international dimension of their traffics while concentrating population and financial/retail activities, as seen with New York, California, Texas, Florida, Virginia, and Maryland, which together handle about half of national port traffics and comprise major cities and container ports (Figure 7). Despite its goal to redevelop the 837km waterfront through no less than 130 projects and the 37 hectares
Brooklyn Bridge Park for housing, the "Vision 2020" initiative in New York also plans to sustain the 13,000 port-related jobs. Maintaining and expanding port-region linkages is also the goal of the SEVA-PORT project (Southeastern Virginia Partnership for Regional Transformation) through enhancing the integration of port-related industries of transportation, warehousing and distribution in the local economy. The three B-regions (Massachusetts, Rhode Island, and Connecticut) concentrate fewer port traffic volumes but specialize in financial, real estate activities while being richer and more densely populated than average. As in the model, their traffic is dominantly serving the local economy due to the higher levels of spatial friction and share of imports and combustibles. Boston is a good example of a wealthy coastal city having gradually lost its port functions over time, currently engaged in redeveloping 9.3 hectares of port areas into office space, housing, hotels, cultural facilities and parks (Boston Innovation District).
Those core regions are functionally and spatially opposed to other regions of which a majority locates in the interior while being served by river and lake ports. C1 regions specialize in chemical and agricultural products, such as Louisiana, Washington, and Oregon states, without any specific socio-economic background. Local initiatives tend to confirm the importance of such commodities for the local economy, such as the Fishermen’s Terminal 20-Year Plan in Seattle aiming at maintaining the 3,900 jobs in fisheries and related industries. C2 regions have the same traffic profile than B regions (i.e. friction, combustibles), but their socio-economic profile differs drastically with regard to lower population density, lower GDP per capita, and lesser financial activities. Their spatial distribution is either peripheral, such as Alaska, or along the so-called "rust belt", which includes West Virginia and Pennsylvania and faces industrial decline since the 1970s. Nevertheless, port activities remain very much tied to the local economy, as seen in the impact study by Prokop and Hall (2007) on Anchorage showing the higher multiplier effects of sea transport compared with other modes and with the rest of the country. While the two clusters of D1 and D2 regions are defined in opposition to spatial friction that suggest a propensity to be more transit-oriented, D2 regions are fully part of the aforementioned "rust belt" around the Great Lakes with a high specialization in minerals and the secondary sector. This category, however, differs from the European and Japanese cases where the main explanatory variables are unemployment and public service indexes. Yet, their common difficulty is to maintain a link between port activities and local economic development. There are numerous attempts to revive such links, as seen with the International Maritime Trade District project proposed by the Cleveland-Cuyahoga Port
Authority in 2009 to develop value-added logistics, and the redevelopment of Milwaukee Inner Harbor into a research hub on neutral carbon and water industries. D1 regions seem to have realized such potential already by concentrating metal products and manufactured goods while specializing in retail and transport activities, such as Georgia, South Carolina, and Hawaii.
[Insert Figure 7 about here]
5. Conclusion
Despite the contemporary spatial and functional complexity of commodity chains, the link between material flows and the territories where they are handled remains important nowadays if not crucial. This result appeared despite all the methodological difficulties of a systematic approach such as the use of administrative rather than functional spatial units, the inclusion of transit flows, the focus on volume rather than value of cargo, and the differences between the three studied geographical areas. Economically and demographically larger, richer regions specialized in the private service sector concentrate larger, more diversified traffic volumes as well as higher valued goods. Agricultural and industrial regions are more specialized in bulk traffics. The theoretical model based on core-periphery and transport cost of goods is well validated by the typology of port regions. One important finding is that the level of industry relatedness between types of flows and types of local economies is a strong component of the wealth of port regions. However, different situations coexist. High relatedness such as between combustibles traffics and the industrial sector often go along with higher unemployment, lower productivity, difficult reconversion, and remoteness, but a high relatedness found in agricultural and urban regions leads to rather positive effects. Similarly, the mismatch between types of flows and types of local economies can be either detrimental or beneficial depending on the creation (or not) of value-added from transit flows. This is why certain port-related policies are found in certain places and not in others. Yet, port regions maintaining high industry relatedness often support port-related policies, while port regions facing functional and spatial port-region mismatch tend to either support value-added creation or shift the focus towards non-port activities. More advanced port-related initiatives towards environmental protection as well as the attraction of innovative activities are more often observed in core port regions.
Possible improvements may be obtained by better adjusting administrative levels to port traffics, with smaller and more distance-constrained ports being bound to lower administrative levels (e.g. NUTS-3 region in Europe, county in the United States, living zone in Japan) or city levels (e.g. Functional Urban Areas or Large Urban Zones in Europe, cities and wards in Japan), larger ports analyzed at intermediate level (NUTS-2, state, prefecture), and largest ports extending across two or more regions, such as Le Havre and Rouen analyzed at the level of the Greater Paris region. A more disaggregated approach to traffics and employment would allow further discussions about the nature of port-region linkages. Spatial statistics would test the influence of neighbourhood on such linkages while multilevel analysis can shed more light on national versus local effects. Another possible research direction is the inclusion of additional countries in both the developed and developing world as well as other indicators such as about innovation, environment, and wages depending on their availability. Lastly, the evolution of specialization should be considered with regard to diversification strategies and their uneven port-region impacts.
Acknowledgments
This research has benefitted financial support from the European Commission in the framework of the European Spatial Planning Observatory Network (ESPON) project on Territorial Impact of Globalization on Europe and its Regions (TIGER). In addition, the research leading to these results has received funding from the European Research Council under the European Union's Seventh Framework Programme (FP/2007-2013) / ERC Grant Agreement n. [313847] "World Seastems". Moreover, the research was supported by JSPS KAKENHI Grant Number 24730259, Japan.
References
Behrens K (2006) Do changes in transport costs and tariffs shape the space-economy in the same way? Papers in Regional Science 85: 379–399.
Behrens K (2007) On the location and lock-in of cities: geography vs. transportation technology. Regional Science and Urban Economics 37: 22–45.
Behrens K, Gaigné C, Ottaviano GIP, Thisse JF (2006) Is remoteness a locational disadvantage? Journal of Economic Geography 6: 347–368.
Bird J (1963) The Major Seaports of the United Kingdom, Hutchinson, London.
Bottasso A, Conti M, Ferrari C, Merk O, Tei A (2013) The impact of port throughput on local employment: Evidence from a panel of European regions, Transport Policy 27: 32–38.
Campbell S (1993) Increasing trade, declining port cities: Port containerization and the regional diffusion of economic benefits. In: Noponen H, Graham J, Markusen AR (eds)
Trading industries, trading regions: international trade, American industry, and regional economic development. Guildford Press, New York.
Carter RE (1962) A comparative analysis of United States ports and their traffic characteristics. Economic Geography 38: 162–175.
Charlier J (1994) Sur le concept de tonnages pondérés en économie portuaire. L'exemple du Northern Range. Les Cahiers Scientifiques du Transport 29: 75–84.
Cheung SMS, Yip TL (2011) Port city factors and port production: analysis of Chinese ports.
Transportation Journal 50(2): 162–175.
Combes PP, Mayer T, Thisse JF (2008) Economic Geography. The Integration of Regions
and Nations, Princeton, Princeton University Press.
De Langen PW (2004) Analysing the performance of seaport clusters. In: Pinder D, Slack B (eds) Shipping and ports in the 21st century. Routledge, London.
De Langen PW (2007) The economic performance of seaport regions. In: Wang JJ, Oliver D, Notteboom TE, Slack B (eds) Ports, cities, and global supply chains. Ashgate, Aldershot. Debrie J, Guerrero D (2008) (Re)spatialiser la question portuaire : pour une lecture géographique des arrière-pays européens. L’Espace Géographique 37(1): 45–56.
Ducruet C (2009) Port regions and globalization. Notteboom TE, Ducruet C, De Langen PW (eds) Ports in proximity: competition and coordination among adjacent seaports. Ashgate, Aldershot, pp 41–53.
Ducruet C, Carvalho De L, Roussin S (2012) The flight of Icarus? Incheon's transformation from port gateway to global city. Hall PV, Hesse M (eds) Cities, regions, and flows. Routledge, London and New York, pp. 149–169.
Ducruet C, Koster HRA, Van der Beek DJ (2010) Commodity variety and seaport performance. Regional Studies 44(9): 1221–1240.
Ducruet C, Lee SW (2006) Frontline soldiers of globalisation: port-city evolution and regional competition. Geojournal 67(2): 107–122.
Ducruet C, Notteboom TE, De Langen PW (2009) Revisiting inter-port relationships under the New Economic Geography research framework. Notteboom TE, Ducruet C, Langen de PW (eds) Ports in proximity: competition and coordination among adjacent seaports. Ashgate, Aldershot, pp. 11–27.
Dunford M, Yeung G (2009) Regional development: port-industrial complexes. In: Kitchin R, Thrift N (eds) International encyclopedia of human geography. Elsevier, Amsterdam.
Faini R (1999) Trade unions and regional development. European Economic Review 43: 457– 474.
Feenstra RC (1998) Integration of trade and disintegration of production in the global economy. Journal of Economic Perspectives 12: 31–50.
Ferrari C, Percoco M, Tedeschi A (2010) Ports and local development: evidence from Italy.
International Journal of Transport Economics 37(1): 9–30.
FNAU (2009) Observatoires portuaires. Fédération Nationale des Agences d’Urbanisme, September, http://www.fnau.org/file/news/ObservatoiresPortuaires%281%29.pdf
Fujita M, Krugman P, Venables AJ (1999) The spatial economy: cities, regions and
international trade. MIT Press, Cambridge & London.
Fujita M, Mori T (1996) The role of ports in the making of major cities: self-agglomeration and hub-effect. Journal of Development Economics 49(1): 93–120.
Fujita M, Mori T (2005) Transport development and the evolution of economic geography.
Portuguese Economic Journal 4: 129–156.
Fujita M, Thisse JF (2002) Economics of agglomeration. Cities, industrial location, and
Fujita M, Thisse JF (2006) Globalization and the evolution of the supply chain: who gains and who loses? International Economic Review 47: 811–836.
Garnier J, Zimmermann JB (2004) L'aire métropolitaine marseillaise et les territoires de l'industrie. LEST-GREQAM Working Paper.
Glaeser EL, Kohlhase JE (2004) Cities, regions and the decline of transport costs. Papers in
Regional Science 83: 197–228.
Goetz AR, Vowles TM, Tierney S (2009) Bridging the qualitative–quantitative divide in transport geography? The Professional Geographer 61: 323–335.
Gouvernal E, Slack B, Franc P (2010) Short sea and deep sea shipping markets in France.
Journal of Transport Geography 18: 97–103.
Grobar LM (2008) The economic status of areas surrounding major U.S. container ports: evidence and policy issues. Growth and Change 39(3): 497–516.
Guerrero D (2010) Les aires d'influence des ports de la France entre réseau et gravitation. Unpublished PhD dissertation in Geography, Paris Diderot – Paris VII University, Paris. Haddad EA, Hewings GJD, Perobelli FS, Santos dos RA (2010) Regional effects of port infrastructure: a spatial CGE application to Brazil. International Regional Science Review 33(3): 239–263.
Haefner LE, Lang DE, Cronin T (1980) Forecast of key commodity flows at a regional port.
Transportation Research Record 763: 2–5.
Hall PV (2002) The institution of infrastructure and the development of port-regions. University of California, Berkeley.
Hall PV (2009) Container ports, local benefits and transportation worker earnings. Geojournal 74(1): 67–83.
Hall PV, Jacobs W (2012) Why are maritime ports (still) urban, and why should policy makers care? Maritime Policy and Management 39(2): 189–206.
Hayuth Y (1981) Containerization and the load center concept. Economic Geography 57: 161–176.
Hesse M, Rodrigue JP (2004) The transport geography of logistics and freight distribution.
Journal of Transport Geography 12: 171–184.
Hesse M (2010) Cities, material flows and the geography of spatial interaction: urban places in the system of chains. Global Networks 10(1): 75–91.
Hoare AG (1986) British ports and their export hinterlands: a rapidly changing geography.
Geografiska Annaler 68B(1): 29–40.
Hoyle BS (1989) The port-city interface: trends, problems, and examples. Geoforum 20(4): 429–435.
Itoh H (2002) Efficiency changes of major container ports in Japan: a window application of data envelopment analysis. Review of Urban and Regional Development Studies 15(2): 133– 152.
Jacobs W, Ducruet C, De Langen PW (2010) Integrating world cities into production networks: the case of port cities. Global Networks 10(1): 92–113.
Jacobs W, Koster, HRA, Hall PV (2011) The location and global network structure of maritime advanced producer services. Urban Studies 48(13): 2749–2769.
Janelle DG, Beuthe M (1997) Globalization and research issues in transportation. Journal of
Transport Geography 5(3): 199–206.
Konishi H (2000) Formation of hub cities: transportation cost advantage and population agglomeration. Journal of Urban Economics 48: 1–28.
Krugman PR (1991) Increasing returns and economic geography. Journal of Political
Economy 99: 483–499.
Krugman PR (1995) Development, Geography, and Economic Theory, Cambridge, The MIT Press.
Krugman PR, Venables AJ (1995) Globalization and the inequality of nations. Quarterly
Journal of Economics 110: 857–880.
Kuby M, Reid N (1992) Technological change and the concentration of the U.S. general cargo port system: 1970-88. Economic Geography 68: 272–289.
Lafourcade M, Thisse JF (2011) New Economic Geography: The Role of Transport Costs. In André de Palma, Robin Lindsey, Emile Quinet and Roger Vickerman (eds.) Handbook of Transport Economics (Cheltenham: Edward Elgar Publishing Ltd.).
Leamer EE, Storper M (2001) The economic geography of the Internet age. Journal of
International Business Studies 32: 641–655.
Lee SW, Song DW, Ducruet C (2008) A tale of Asia’s world ports: the spatial evolution in global hub port cities. Geoforum 39(1): 372–385.
Lee SW, Ducruet C (2009) Spatial glocalization in Asia-Pacific hub port cities: a comparison of Hong Kong and Singapore. Urban Geography 30(2): 161–184.
Leslie D, Reimer S (1999) Spatializing commodity chains. Progress in Human Geography 23(3): 401–420.
Lever WF (1995) Regional economic growth and port activities in European cities. Proceedings of the 5th International Conference Cities and Ports, Dakar, Senegal.
Limao N, Venables AJ (2001) Infrastructure, geographical disadvantage, transport costs, and trade. The World Bank Economic Review, 15(3), 451–479.
Marti BE (1985) Chilean ports: commodity specialization and potential for containerization.
The Professional Geographer 37: 320–328.
McCalla RJ, Slack B, Comtois C (2001) Intermodal freight terminals: locality and industrial linkages. The Canadian Geographer 45(3): 404–413.
McCalla RJ, Slack B, Comtois C (2004) Dealing with globalisation at the regional and local levels: the case of contemporary containerization. The Canadian Geographer 48(4): 473–487. Merk O, Ducruet C, Dubarle P, Haezendonck E, Dooms M (2011) The Competitiveness of
Global Port-cities: The Case of the Seine Axis (Le Havre, Rouen, Paris, Caen) - France.
OECD Regional Development Working Papers, no. 2011/7.
MLIT (2009) The bulk cargo flow survey, Planning Division, Ports and Harbours Bureau, Ministry of Land, Infrastructure, Transport and Tourism (MLIT), Japan.
Mori T, Nishikimi K (2002) Economies of transport density and industrial agglomeration.
Regional Science and Urban Economics 32: 167–200.
Musso E, Benacchio M, Ferrari C (2000) Ports and employment in port cities. International
Journal of Maritime Economics 2: 283–311.
Neffke F, Henning M, Boschma R (2011) How do regions diversify over time? Industry relatedness and the development of new growth paths in regions. Economic Geography 87(3): 237–265.
Ng AKY (2013) The evolution and research trends of port geography. The Professional
Geographer 65(1): 65–86.
Notteboom T (2010) Dock Labour and Port–related Employment in the European Seaport
System. http://www.espo.be/
Notteboom TE, Rodrigue JP (2005) Port regionalization: toward a new phase in port development. Maritime Policy and Management 32(3): 297–313.
Ottaviano GIP, van Ypersele T (2005) Market size and tax competition. Journal of
International Economics 67: 25–46.
Prokop D, Hall R (2007) The economic impact and logistics of the port of Anchorage, Proceedings of the CTRF Conference, http://www.citt.ca/members/downloads/ctrf_2007.html Puga D (1999) The rise and fall of regional inequalities. European Economic Review 43: 303– 334.
Robert-Nicoud F (2008) Off-shoring of business services and deindustrialization: threat or opportunity - and for whom? Discussion Paper 5617, Centre for Economic Policy Research, http://www.cepr.org/meets/wkcn/4/4556/papers/Robert-Nicoud.pdf
Rodrigue JP (2003) L’autorité portuaire de New York et New Jersey : changements globaux, gains régionaux et problèmes locaux du développement portuaire. Les Cahiers Scientifiques
du Transport 44: 55–75.
Rodrigue JP, Comtois C, Slack B (2009) The geography of transport systems. Routledge, New York.
Rodrigue JP, Notteboom TE (2010) Foreland-based regionalization: Integrating intermediate hubs with port hinterlands. Research in Transportation Economics 27(1): 19-29.
Shinohara M (2009) Port competition paradigms and Japanese port clusters. Notteboom TE, Ducruet C, De Langen PW (eds) Ports in proximity: competition and coordination among
adjacent seaports. Ashgate, Aldershot, pp 41–53.
Stern E, Hayuth Y (1984) Developmental effects of geopolitically located ports. In: Hoyle BS, Hilling D (eds) Seaport systems and spatial change. Wiley, Chichester.
Tabuchi T, Thisse JF (2002) Regional specialization and transport costs. Discussion Paper 3542, Centre for Economic Policy Research, http://www.cepr.org/pubs/dps/DP3542.asp Vallega A (1996) Cityports, coastal zones and sustainable development. In: Hoyle BS (ed)
Cityports, coastal zones and regional change. Wiley, Chichester.
Wang C, Ducruet C (2012) New port development and global city making: Emergence of the Shanghai-Yangshan multilayered gateway hub. Journal of Transport Geography 25: 58–69. Wang JJ, Olivier D, Notteboom TE, Slack B (2007) Ports, cities and global supply chains. Ashgate, Aldershot.
Wang JJ, Chen MC (2010) From a hub port city to a global supply chain management center: a case study of Hong Kong. Journal of Transport Geography 18(1): 104–115.
Woxenius J (2010) Freight transport detours. 12th World Conference on Transport Research (WCTR), Lisbon, July 11-15.
Port
Total port traffic *
Share of the local administrative unit in total port traffic *
Container traffic ** Share of port-related employment *** in total employment (2007) (b) Volume (tons) Value (000s Euros) Volume (%) Value (%) Volume (tons) Share in total port traffic (%) Rouen 8,942,804 10,525,770 69.0 13.5 1,136,000 5.2 N/A Le Havre 8,305,550 29,213,899 22.8 13.4 17,685,000 25.0 20.1 Marseille 7,019,774 7,986,530 64.5 22.3 7,292,000 7.8 9.4 Dunkerque 3,937,047 2,294,024 79.8 41.5 1,559,000 3.2 28.8 Nantes-St. Nazaire 2,631,685 959,309 73.5 54.1 1,169,000 3.4 3.8
Languedoc-Roussillon (a) 2,041,343 534,717 76.5 73.2 61,000 1.6 N/A Bordeaux 1,292,146 392,860 95.3 78.2 444,000 5.2 N/A Bretagne (a) 1,242,471 388,765 99.5 97.9 234,000 9.6 12.8 La Rochelle 1,074,273 155,471 99.6 96.8 0 0.0 N/A Dieppe 326,985 104,036 78.7 37.3 38,000 3.8 N/A Boulogne 42,879 27,760 57.4 26.9 0 0.0 9.7
Table 1: Weight and share of coastal regions in French ports' traffics in 2005 Sources : calculated based on * Guerrero (2010), ** Eurostat, and *** FNAU (2009)
(a) reference is the Région instead of Département
(b) calculated on the level of travel-to-work areas (bassins d'emploi) N.B. data accounts for extra-EU maritime flows excluding oil products
Type of
indicator Code Specialization Code characteristicsGeneral
Port traffic
T_COMBUS *Combustibles (coal, oil, gas) T_SIZE *Traffic size T_CHEMI *Chemical products & fertilizers T_IMPOR *Import/inbound
traffic
T_METAL *Metal products (iron & steel, scrap) T_INTER *International traffic T_AGRIC *Agricultural, forestry products & live
animals T_DIVER *Commodity diversity
T_MINER *Minerals & construction materials (ores,
sand, gravel) T_FRICT ***Spatial friction
T_MANUF *Manufactured goods (containers, vehicles, food products)
Socio-economic
R_AGRIC **Employment in agriculture and fisheries R_POPUL *Demographic size R_CONST **Employment in construction R_DENSI *Population density R_INDUS **Employment in mining & manufacturing R_UNEMP **Unemployment R_RETAI **Employment in retail, hotel, & transport R_RGDP **GDP per capita R_FINAN **Employment in finance & real estate
R_PUBLI **Employment in public services
Table 2: List of traffic and regional indicators
Area PC1 PC2 PC3 PC4 PC5 PC6 Eigenvalues Europe Japan 4.086 6.666 2.623 3.752 2.264 2.390 1.784 2.108 1.299 1.358 1.191 0.954
USA 4.738 2.919 2.661 2.094 1.904 1.485 Cumulated variance Europe 19.456 31.945 42.725 51.219 57.403 63.072 Japan 31.742 49.610 60.992 71.032 77.500 82.040 USA 22.560 36.460 49.133 59.103 68.168 75.238
Figure 1: Main factors differentiating port regions
Figure 2: Hinterland patterns of some large regions