HAL Id: hal-01576865
https://hal.inria.fr/hal-01576865
Submitted on 24 Aug 2017HAL is a multi-disciplinary open access archive for the deposit and dissemination of sci-entific research documents, whether they are pub-lished or not. The documents may come from teaching and research institutions in France or abroad, or from public or private research centers.
L’archive ouverte pluridisciplinaire HAL, est destinée au dépôt et à la diffusion de documents scientifiques de niveau recherche, publiés ou non, émanant des établissements d’enseignement et de recherche français ou étrangers, des laboratoires publics ou privés.
Continuous selection pressure to improve temperature
acclimation of Tisochrysis lutea
Hubert Bonnefond, Ghjuvan Micaelu Grimaud, Judith Rumin, Gaël
Bougaran, Amélie Talec, M Gachelin, M Boutoute, Eric Pruvost, Olivier
Bernard, Antoine Sciandra
To cite this version:
Hubert Bonnefond, Ghjuvan Micaelu Grimaud, Judith Rumin, Gaël Bougaran, Amélie Talec, et al.. Continuous selection pressure to improve temperature acclimation of Tisochrysis lutea. PLoS ONE, Public Library of Science, 2017. �hal-01576865�
Continuous selection pressure to improve temperature acclimation of Tisochrysis lutea
1
Bonnefond H1, Grimaud G2, Rumin J3, Bougaran G3, Talec, A1, Gachelin M1, Boutoute M1, Pruvost E1,
2
Bernard O2, Sciandra A1
3
1Sorbonne Universités, UPMC Univ Paris 06, CNRS-INSU, Laboratoire d'Océanographie de
4
Villefranche-sur-mer (LOV), 06230 Villefranche-sur-mer, France 5
2INRIA BIOCORE, 06902 Sophia Antipolis Cedex, France
6
3IFREMER, PBA, 44311 Nantes, France
7 8 9
Abstract. 10
Temperature plays a key role in outdoor industrial cultivation of microalgae. Improving the thermal 11
tolerance of microalgae to both daily and seasonal temperature fluctuations can thus contribute to 12
increase their annual productivity. A long term selection experiment was carried out to increase the 13
thermal niche (temperature range for which the growth is possible) of a neutral lipid overproducing 14
strain of Tisochrysis lutea. The experimental protocol consisted to submit cells to daily variations of 15
temperature for 7 months. The stress intensity, defined as the amplitude of daily temperature 16
variations, was progressively increased along successive selection cycles. Only the amplitude of the 17
temperature variations were increased, the daily average temperature was kept constant along the 18
experiment. This protocol resulted in a thermal niche increase by 3°C (+16.5 %), with an 19
enhancement by 9 % of the maximal growth rate. The selection process also affected T. lutea 20
physiology, with a feature generally observed for ‘cold-temperature’ type of adaptation. The amount 21
of total and neutral lipids was significantly increased, and eventually productivity was increased by 22
34%. This seven month selection experiment, carried out in a highly dynamic environment, 23
challenges some of the hypotheses classically advanced to explain the temperature response of 24
microalgae. 25
Keywords: Tisochrysis lutea, adaptation, selectiostat, temperature response, lipids, continuous 26
selection, evolution engineering. 27
Introduction 28
Microalgae are a promising source of resources and bulk chemicals for various applications such as 29
nutrition, aquaculture, cosmetics and, at a longer time scale, biofuels or green chemistry. However, 30
the wild type strains commonly cultivated offer poor industrial yields, limiting their profitability. 31
These wild species adapted to natural conditions do not tolerate extreme temperatures reached by 32
artificial culturing systems (photobioreactors or greenhouse cultures) with a low thermal inertia 33
[1][2]. Moreover, in temperate climates, microalgae production throughout the year is limited by the 34
low winter temperatures. This sensitivity to temperature therefore restricts production, unless 35
temperature is regulated with a high cooling/heating system involving high financial and 36
environmental costs [1]. The need to select new strains adapted to a wider range of temperature is 37
thus crucial for increasing productivity and reducing cultivation costs. 38
The steady state growth response of microalgae to temperature, i.e. the growth rate as a function of 39
temperature in acclimated and non-limiting conditions, also called the thermal reaction norm, has 40
been extensively studied [2][3], and can be accurately predicted by the model of [4]. This model is 41
parameterized by three cardinal temperatures: Tmin and Tmax, corresponding respectively to the
42
temperatures below and above which growth is not possible. Topt, the optimum growth temperature,
43
was defined as the temperature leading to the highest growth rate (all other parameters being kept 44
constant). The temperature values ranging between Tmin and Tmax represent the thermal niche. The
45
selection of strains with a larger thermal niche and thus lower temperature sensitivity is a promising 46
approach to increase outdoor productivity. 47
Microalgal strains acclimate to temperature in a process similar to photoacclimation [5]. Under weak 48
thermal perturbation and on short term exposition (less than 10 generations), acclimation enhances 49
ecological fitness by modulating the flux of energy produced by photosynthesis to carbon fixation 50
rate through the Calvin cycle in a more efficient way [6]. However, when the thermal stress exceeds 51
its physiological tolerance, adaptation mechanisms are triggered. The genetic modifications triggered 52
during the adaptation process result from the selection of individuals with highest fitness in the new 53
thermal stressing conditions. Adaptation occurs by two different mechanisms: selection of the most 54
adapted individuals among the pre-existing genetic diversity of a non-monoclonal population (pre-55
selective mutations), and de novo genetic mutations induced by environmental stress (adaptive 56
mutation) [7]. In this paper “adapted strain” was defined as the resulting strain supporting 57
temperature stresses that the simply “acclimated strain” do not tolerate. As it is shown later, 58
adaption also results in a different lipid profile, compared to the initial strain, when submitted to the 59
same environment. Little information exists on physiological temperature adaptation in microalgae. 60
The only available studies are for extremophile strains, resulting of a million year evolutionary 61
process of thermal adaptation. Life at low temperatures has selected individuals that could mitigate 62
the lowering of their metabolic activities and growth by synthetizing psychrophilic enzymes with 63
higher activity at cold temperatures [8][9] or stimulating enzyme production [10][11], and can 64
preserve the fluidity of their membranes by increasing the synthesis of unsaturated fatty acids 65
[12][13][3]. Conversely, under high temperature conditions that tend to denature proteins and 66
membranes [10][14], extremophile adapted microalgal species produce more Heat Shock Proteins 67
[15] or saturated fatty acids, allowing them to resist these lethal effects [14]. This study therefore 68
investigated the possibility of changing the temperature response (growth rate and physiology) of a 69
non-extremophile strain of Tisochrysis lutea, keeping this species for several months in continuous 70
cultures, under increasing stressful thermal conditions consisting in daily temperature shifts. This 71
species is well-used in aquaculture and mollusk hatcheries for fish larva and bivalve nutrition 72
especially because of its high content in essential polyunsaturated fatty acids. It is a fast growing 73
microalgae (µmax about 2 d-1), easy to cultivate under temperate climate, requiring a pH about 7, a
74
solar irradiance of 780 µmol photons.m-2.s-1 at about 30°C [16].
Materials and methods 76
Microalgae strain. The Tisochrysis lutea strain (CCAP 927/17) used in this experiment, named W2X,
77
was obtained by a selection/mutation process from the original strain CCAP 926/14. This strain is 78
characterized by a doubled triglyceride productivity [17][18]. Note that the strain used was non-79
monoclonal and thus contained a pre-existing genetic diversity supposed to facilitate the emergence 80
of new traits. 81
Culturing system. The culturing system was specifically designed to maintain long-term continuous
82
cultures of microalgae in computer-controlled growing conditions. The enrichment medium was 83
prepared in several 20 L tanks (Nalgene) filled with 3 weeks-matured natural seawater, previously 84
filtered on 0.1 µm, and autoclaved at 120°C for 40 min. After cooling, f/2 medium [19] was added 85
through a 0.22 µm sterile filter. The culture vessels consisted of water jacketed, 1.9-liter plane 86
photobioreactors (thereafter named “selectiostat”) connected to a circulating programmable water 87
bath (Lauda Proline RP845). 30 to 40 min were necessary to vary the temperature from 10 to 40 °C 88
inside the selectiostats. Cultures were continuously and gently homogenized by a magnetic stirrer 89
and bubbling air. They were illuminated with LEDs (Nichia NVSL219BT 2 700°K) placed on one side of 90
the photobioreactors. The light intensity, continuously measured with a probe (SKY, SKL2620) placed 91
on the opposed side of the reactor was maintained at Iin = 250 µmol photons.m-2.s-1. pH was
92
maintained constant at 8.2 by computer-controlled microinjections of CO2. Turbidity was measured
93
on-line using a red LED (Rodan HIRL5010) at 800 nm on one side of the reactor and a photodiode 94
(Optek OP993) on the other side. Light, pH, temperature, turbidity, and dilution rate were 95
continuously monitored by ODIN® software [20]. 96
Cleaning procedure. As the selection experiment lasted about 260 days in stressing conditions, algae
97
biofilm was removed monthly. After saving 1 liter of culture in an autoclaved Schott bottle, the 98
different pieces of the selectiostats were dismounted and washed with milliQ water then 70 % 99
ethanol. Once dried and reassembled, the photobioreactors were sterilized with 10 % HCl and then 100
rinsed with fresh sterile medium filtered through 0.22 µm (SpiralCap, Gelman). Selectiostats were 101
then inoculated with the preserved culture, and complemented with sterile medium filtered through 102
0.22 µm with a Stepdos pump (KNF) to readjust the culture volume. 103
Turbidostats vs fedbatch modes. Two selectiostats were processed in parallel, each of them using a
104
different culturing mode. In the selectiostat named STurb (turbidostat mode), the dilution rate was 105
dynamically changed by the ODIN® software through a PID control algorithm to maintained turbidity 106
at a constant level corresponding approximately to a cell concentration of 9 105 cell.mL-1.
107
The biomass set point was chosen as the maximal value permitting to avoid marked light shading. 108
The nitrogen concentration in the inflowing medium permitted a biomass concentration of 3.3 106
109
cell.mL-1. Moreover for cell concentration higher than 5 106 cell.mL-1, light limitation was observed in
110
the selectiostat. To be conservative, a biomass concentration below 106 cell.mL-1 was chosen to fulfill
111
these conditions. 112
In the selectiostat named SFb (fed-batch mode), a fraction of the culture volume was replaced with 113
fresh sterile medium every 7 days. Only 5 to 10 % of the initial volume was kept, in order to restart 114
cultures with an initial cell density of 5 105 cell.L-1.
115
Continuous selection procedure, the “ratchet” protocol. Our selection method was inspired from the
116
original protocols proposed by [16] and [17], but instead of gradually increasing the culture 117
temperature, the daily average temperature was kept unchanged at 28°C along the experiment 118
(Eq.1). The stress consisted in progressively increasing the amplitude of the daily temperature 119
variation pattern. Indeed, square wave temperature variations were applied, with 8 hours at low 120
temperature (Tlow) followed by 16 hours at high temperature (Thigh) with an average daily
121 temperature of 28°C. 122 𝑇𝑑𝑎𝑖𝑙𝑦 𝑎𝑣𝑒𝑟𝑎𝑔𝑒 = 1 24 (𝑇ℎ𝑖𝑔ℎ 𝑥 16 + 𝑇𝑙𝑜𝑤 𝑥 8) (1) 123
This daily pattern was repeated identically over 7 days (i.e. a selection cycle). This duration allowed 124
to avoid nitrogen starvation in the fed-batch mode and to reach equilibrium in the turbidostat mode. 125
At the end of a selection cycle, if the measured growth rate was higher than 0.4 d-1 (i.e. more than 50
126
% of the maximum growth rate, meaning that cells were able to cope with temperature stress), a 127
new cycle was implemented by reducing Tlow by 2°C and increasing Thigh by 1°C. Otherwise the
128
temperature conditions were remained unchanged to provide a longer adaptation period (Fig. 1). 129
The rationale behind this asymmetrical mode was motivated by the asymmetry of microalgal 130
response to temperature, where the variation of the growth rate observed for temperatures higher 131
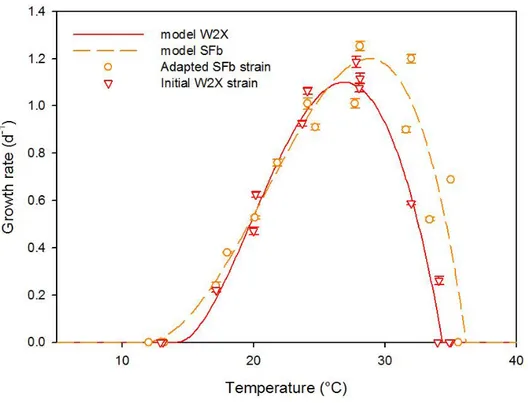
than Topt is generally steeper than below Topt (Fig. 2) [4]. For the two last selection cycles 9 and 10,
132
Thigh was increased by only 0.5°C and Tlow decreased by only 1°C in order to reduce the mortality
133
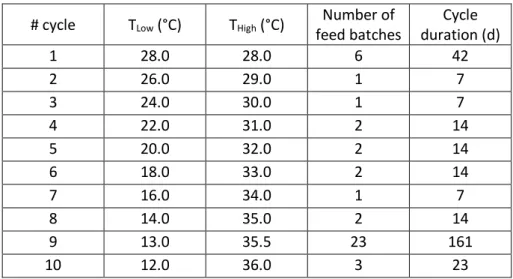
resulting from the very large daily variations of temperature at the end of the experiment (Table 1). 134
Figure 1: temperature conditions applied during the 3 first cycles of the selection experiment in 135
STurb and SFb. The same protocol with increasing temperature amplitudes was used for the 136
following cycles (4 to 10). 137
138
Figure 2: growth rate measured at different temperatures in the TIP device for the initial W2X strain 139
(triangles) and the temperature selected strain SFb (open circles). Lines represent the best fit of the 140
[4] model to the data series. 141
# cycle TLow (°C) THigh (°C) Number of feed batches Cycle duration (d) 1 28.0 28.0 6 42 2 26.0 29.0 1 7 3 24.0 30.0 1 7 4 22.0 31.0 2 14 5 20.0 32.0 2 14 6 18.0 33.0 2 14 7 16.0 34.0 1 7 8 14.0 35.0 2 14 9 13.0 35.5 23 161 10 12.0 36.0 3 23 142
Table 1: Temperature conditions applied during the selection experiment. A cycle was a set of 143
temperature conditions (Tmin and Tmax) daily applied to culture during selection procedure.
144
Cell population. Size distribution of the cell population was monitored once or twice a day with an
145
optical particle counter (HIAC - Royco; Pacific Scientific Instruments). Mean cell diameter and 146
biovolume were calculated from the size distribution. The variability between triplicate samples was 147
routinely lower than 5 %. The first and the second counting were performed at the beginning of the 148
low and high temperature periods, respectively. Measurements were performed at least once per 149
cycle (Fig. 3; Tab. 1). 150
The average growth rate, experimentally measured for a cycle of selection µ̅𝐸𝑥𝑝−𝑆𝐹𝑏 (d-1) of the SFb
151
culture was calculated using the following equation: 152 µ̅𝐸𝑥𝑝−𝑆𝐹𝑏= 𝐿𝑛(𝐵𝑉2 𝐵𝑉1) 𝑡2−𝑡1 (2) 153
where BV1 and BV2 were the biovolume (µm3.mL-1) at time t1 and t2 (d), respectively. The growth rate
154
was the average of 4 days of measurements (n > 4). The computation of the average growth rate in a 155
continuous culture (µ̅𝐸𝑥𝑝−𝑆𝑇𝑢𝑟𝑏) with permanent stress affecting growth is tricky and would have
156
needed high frequency biomass measurements. For the routine daily monitoring of the selectiostats, 157
we used the average dilution rate over one week. However, this proxy of average growth rate turned 158
out not to be accurate enough to support the discussion (standard deviation of measurements > 10 159
%). Therefore, the evolution of the growth rate for the turbidostat (which qualitatively follows a 160
similar trend as for the fed batch) was not used for the analyses, and only the features of the final 161
adapted strain are discussed in this paper. 162
Growth response with respect to temperature (TIP experiment). A special device (TIP) composed
163
with 17 photobioreactors (0.5 L) and permitting to control independently temperature, pH and light 164
intensity [16] was used to assess the temperature response on growth at constant pH and irradiance 165
[16]. Three strains were used, T. lutea before (W2X strain, stored at 19°C for 2 years) and after (STurb 166
and SFb, stored for one month at 21°C) the selection experiment. After one day acclimation in the 167
TIP, the exponential growth rate was estimated at 8 temperatures ranging from 12°C to 35.5°C from 168
the linear regression of the logarithm of DO680 (n>12). Irradiance (250 µmol.m-2.s-1) and pH (7.9) were
169
maintained constant. Cell concentration was assessed by image analysis after Lugol staining on 170
Malassez slides using specific software (Samba Technologies, Meylan, France) to check the DO680
171
measurement validity. Lipid classes and fatty acid composition were analyzed for STurb and SFb 172
strains growing at 28°C after 7.2 days of cultivation in nitrogen starvation and compared with the 173
measurements obtained during the W2X lipid comparison experiment (detail below). 174
Characterisation of temperature response. The three cardinal temperatures (Tmin, Tmax and Topt) were
175
estimated for the initial W2X and for the new selected strains SFb and STurb, obtained after 10 176
months of selection, by fitting the model proposed by [4] to the TIP growth response (Fig. 2). A 177
gradient-based optimisation procedure was run and a jackknife analysis provided an estimate of 178
these parameters together with their confidence intervals [4]. 179
To quantify the effect of temperature selection on the measured growth rate of SFb strain, a 180
“selection coefficient” sSFb [21] was calculated as follow: 181
𝑠𝑆𝐹𝑏 = ln(µ̅𝐸𝑥𝑝−𝑆𝐹𝑏) − ln(µ̅𝑇ℎ−𝑊2𝑋) (3)
where µ̅𝑇ℎ−𝑊2𝑋 is the theoretical growth rate of the strain W2X calculated for the same temperature
183
conditions as experienced by the culture SFb during each selection cycle, with the cardinal parameter 184 of the W2X strain: 185 µ̅𝑇ℎ−𝑊2𝑋(𝑇𝑙𝑜𝑤, 𝑇ℎ𝑖𝑔ℎ) = 7.5 24µ𝑊2𝑋(𝑇𝑙𝑜𝑤) + 15.5 24 µ𝑊2𝑋(𝑇ℎ𝑖𝑔ℎ) + 1 24µ𝑊2𝑋(𝑇𝑎𝑣𝑒𝑟𝑎𝑔𝑒) (4) 186
where Tlow and Thigh are the low and high temperature values set during the selection cycles, and 187
Taverage the mean temperature experienced during the 1h transition time between low and high
188
temperatures. Selection occurs if the frequency of adapted strains in the population increases (s > 0) 189
[21]. 190
W2X lipid comparison experiment (benchmark experiment). To compare the lipid content of the
191
initial W2X strain with the new adapted strains, a benchmarking experiment in similar conditions 192
than the TIP experiment was performed. Three cylindrical glass photobioreactors of 2 L were used as 193
triplicates. Temperature was controlled at 28°C and pH maintained constant at 7.9 by micro-194
additions of CO2 in the bubbling air. Continuous light was provided by fluorescent tubes (Dulux®1,
195
2G11, 55W/12-950, lumilux de lux, daylight, OsramSylvania) at 250 µmol.m-2.s-1 and measured in the
196
center of the empty photobioreactors as in the TIP device. Cultures were gently homogenized by 197
magnetic stirring. The enrichment medium was prepared in several 20 L tanks (Nalgene) filled with 3 198
weeks-matured natural seawater, previously filtered on 0.1 µm, and autoclaved at 120°C for 40 min. 199
After cooling, f/2 medium was added through a 0.22 µm sterile filter [19]. Nitrogen concentration 200
was lowered at f/4 concentration to reach N starvation. Lipid sampling (400 mL of culture) was 201
realized at the end of the experiment during the starvation phase. 202
Cellular content analysis. 6.65 mL triplicates of culture were sampled weekly, 3 days after the
203
beginning of the selection cycle and just after the temperature shift from Thigh to TLow, and filtered
204
onto glass-fiber filters (Whatman GF/C, threshold 1.2 µm) precombusted at 450°C for 12h. For 205
particulate carbon and nitrogen measurement, samples were kept at 60°C until analyses were 206
performed with a CHN analyzer (2400 Series II CHNS/O, Perkin Elmer). For pigments, samples were 207
kept at -80°C, and extracted in acetone (3 ml) for 1 hour at 4°C in the dark with frequent and gentle 208
stirring. After 5 min of centrifugation (JOUAN G 412) at 2000 rpm, supernatant was analyzed with a 209
spectrophotometer (Perkin Elmer UV/Vis Spectrophotometer Lambda2). Chlorophyll a, b and total 210
carotenoid were determined using the equations of Lichtenthaler and absorbance at 470.0, 644.8 211
and 661.6 nm [22]. The variability between triplicates was lower than 7 %. 212
For adapted strains, lipid samplings were made at the end of the TIP experiment, after 7.7 days of 213
cultivation in nitrogen starved conditions at 28°C. For the W2X, lipids were sampled at the end of the 214
lipid comparison experiment (6.9 days) in N-starved conditions. Known volumes of culture were 215
centrifuged (JOUAN G 412) for 10 min at 2000 rpm, after the addition of 100 µL of Cl3Fe (50 mg.mL-1)
216
as flocculate. The lipid extraction protocol was derived from Bligh and Dyer [23]. Total lipids were 217
determined gravimetrically. Neutral lipids, glycolipids and phospholipids were separated on Extract-218
Clean SPE Silica 500 mg/8 mL (Alltech) and eluted respectively with 6 column volumes of chloroform, 219
4 column volumes of acetone and 6 column volumes of methanol completed with 2 volumes of 220
methanol–10 % ammonia. Total lipids were placed on top of the column in chloroform. All fractions 221
were dried under vacuum and weighted to provide an estimate of each class of lipids. 222
The lipid productivity (µgLipid.mL-1.d-1) of the different strains during the benchmarking experiment
223
was calculated as follows: 224
𝑃𝑙𝑖𝑝𝑖𝑑=
𝐿𝑖𝑝𝑖𝑑𝑓−𝐿𝑖𝑝𝑖𝑑𝑖
𝑡𝑓−𝑡𝑖 (5)
225
where Lipidf and Lipidi are the total lipid concentration (µg.mL-1) at final and initial time respectively. 226
Note that, the initial lipid concentration was not measured (not enough matter for our lipid 227
protocol). Initial lipid content per gram carbon was thus assumed to be the same as the final content. 228
This hypothesis provides a slightly underestimated productivity, but has limited impact since initial 229
biomass is very low.Fatty acid analysis began by converting saponifiable lipids into methyl esters with 230
7 % boron trifluoride in methanol [24]. Gas chromatography (GC) of fatty acid methyl esters (FAME) 231
famewax (Restek) in a Perkin-Elmer XL autolab GC, equipped with a flame ionization detector (FID). 233
The column operated isothermally at 185°C. Helium was used as carrier gas at 7 psig. Injector and 234
detector were maintained at 250°C. The variability was routinely 3 % for major components, 1 – 9 % 235
for intermediate components and 25 % for minor components (<0.5 % of total fatty acids). 236
Measurements were relative and expressed as percentage of total fatty acid, no internal standard 237
was needed. 238
Results and discussion 239
From acclimation to adaptation. Fig. 3A shows that the theoretical growth rate of the initial strain
240
W2X calculated for the experimental temperature conditions (Eq. 4), decreased with the amplitude 241
of temperature variations. Fig. 3A also shows that, except for the very first 2 cycles, the growth rates 242
measured in the SFb selectiostat were significantly higher than the theoretical growth rate computed 243
for the parameters of the initial strain. It is also noticeable that, for the temperature conditions of 244
cycles 8, 9 and 10, the growth is still possible in the SFb selectiostat, while no growth could be 245
observed at these temperatures for the initial strain. The reason why the growth rates in the SFb 246
selectiostat measured during the two first cycles were lower than the theoretical growth rate for the 247
initial W2X strain might be due to an initial acclimation phase to the variable temperature conditions. 248
It is likely that, by maintaining the cells for a longer time in the temperature conditions of cycles 1 249
and 2, the growth rate would have progressively increased as a result of a combination of acclimation 250
and adaptation. This increase in average growth can indeed clearly be observed for the last cycles 251
which were repeated several weeks. As a matter of illustration, the average growth rate during the 252
cycle 9 was multiplied by 5 when comparing the first and the last week of the cycle (Fig. 3 A). The 253
selection coefficient s (Fig. 3 B) was positive after cycle 3; this means that the frequency of new 254
thermally adapted individuals in the population increased to the detriment of the initial strain [21]. 255
This increase shows that the initial strain was not fitted to these highly changing temperature 256
conditions. From cycle 8 to 10 (TLow = 12°C; THigh = 35.5°C), the transition from a cycle to the next led
systematically to a reduction of the selection coefficient. After the transition in the new cycle, it 258
gradually increased with the number of generations highlighting the progressive emergence of cells 259
better fitted to the selective pressure (Fig. 3 B; black arrows). 260
With a Luria-Delbrück fluctuation analysis [7], Costas et al. [25] studied the variance of the fitness 261
during selection conditions and determined the origin of mutant adapted to the new thermal 262
conditions. They increased the average growth temperature as a stressing parameter for Isochrysis 263
galbana wild type (Tmax = 28°C). Under a low temperature range (15 – 30°C), the increase of the strain
264
fitness was due to acclimation or pre-selective mutations (selection from the pre-existing genetic 265
diversity). Under a higher range (30 - 35°C), they assumed that the observed response was linked to 266
adaptive mutations (occurrence and selection of new mutants). With our protocol, it was not 267
possible to identify the source of fitness increase. Since the pressure of selection was dynamic, in 268
contrast to [25], the observed selection was probably a dynamical equilibrium involving acclimation, 269
pre-selective mutations and adaptive mutation to the emergence of a new population with a broader 270
thermal niche and/or a higher thermal acclimation capacity. 271
Figure 3: A) Mean growth rates measured for SFb strain during each selection cycle (black circles), 272
and theoretical growth rate calculated with the calibrated temperature model of the initial strain 273
W2X (triangles) submitted to the same temperature conditions. Growth rate was measured at a 274
minimum of 6 different dates on one culture (SFb, n>6), during the exponential phase to achieve a 275
linear regression with error < 5 % and thus an accurate growth rate determination. The vertical 276
dashed lines indicate the amplitude of temperature variations during each cycle, and the horizontal 277
continuous line corresponds to the mean temperature maintained constant at 28°C throughout the 278
selection experiment. B) Time change of the selection coefficient measured in SFb. When measured 279
during consecutive weeks of the same cycle, the selection coefficient increased with time (vertical 280
arrows). 281
282
New strain characterization. The new strains were obtained after 41 generations in fed-batch (SFb)
283
and approximately 157 generations in turbidostat (STurb; value obtained from the estimate of the 284
average growth rate of the STurb population based on the dilution rate). The thermal response of 285
these two final new strains and the initial strain W2X was characterized with the TIP [16] and 286
compared (Fig. 2). The cardinal temperatures for these new strains were assessed using the model of 287
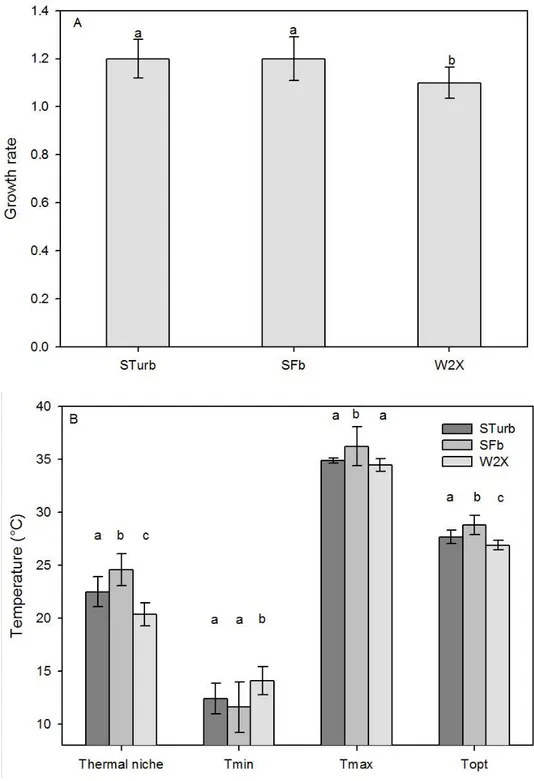
[4]. The optimal growth rates of the two new selected strains were significantly higher than the rate 288
of the initial W2X (+9 %; statistical difference at 1 %, Student test; Fig. 4 A). This result was expected 289
because it was demonstrated mathematically and experimentally that continuous medium renewal 290
eliminates preferentially individuals that grow slower, leading to an increase of the population mean 291
growth rate [26][27]. Consistent with Eppley [28], the increase in the optimal growth rate was 292
correlated with an increase in Topt (Fig. 4). However, despite the “hotter is faster” trend [29], the
293
Eppley curve normalized by the optimal growth rate of the W2X strain overestimates the evolution of 294
the optimal growth rate by 41.7 % and 51.1 % for STurb and SFb respectively. 295
The trade-off between thermal specialist and thermal generalist strains (narrow thermal niche/high 296
performances and large thermal niche/low performances respectively) is a common hypothesis in 297
literature. A microorganism with an increased thermal niche should have a lower maximal growth 298
rate. This assumption has sometimes been mathematically transcribed by a constant area beneath 299
the temperature response growth curve [29][30][31]. However, this widespread assumption in 300
evolutionary models of thermal adaptation is hardly supported by experimental data for 301
microorganisms. Bennett & Lenski [32] have refuted this assumption since they recorded, after 2000 302
generations, an increasing Topt of some E. coli strains without modifying the thermal niche. To our
303
knowledge, our experiment with microalgae is the first to assess this assumption. The increase in 304
growth rate coincided with an increase in the thermal niche (+11 % and +22 % respectively for final 305
STurb and SFb strains; statistical difference 1 %, Student test; Fig. 4). The dynamic environment used 306
in our experiments is probably a key factor explaining the inconsistency of the trade-off theory for T. 307
lutea. The thermal niche increase was the consequence of two significant effects, an increase in Tmax
308
and a decrease in Tmin (Fig. 4). When comparing the initial W2X thermal niche (20°) to the thermal
Porphyridium cruentum [4]), it appeared that the initial strain was probably a thermal specialist. On
311
the other hand, the new adapted strains with a thermal niche close to 25°C were closer to thermal 312
generalists. 313
Previous studies carried out with bacteria have shown that these microorganisms adapt their optimal 314
growth temperature (Topt) to the average temperature of their environment [33] or slightly above as
315
hypothesized by some models [34] but very few data reinforce this hypothesis. After an adaptation 316
of three months at constant average temperatures, [11] recorded the same growth rate for 317
Skeletonema costatum at 3°C and 18°C. Likewise, by submitting Isochrysis galbana to increasing
318
constant average temperatures, [35] reported positive growth at 35°C for the adapted strain, 319
whereas the wild type did not grow at this temperature. Here, Topt of the new strains increased
320
during the selection process and was at the end higher than the average temperature (28°C). This 321
evolution is consistent with [36] who compared the Topt modelled for 195 species with the average
322
temperature of the species location. 323
Our experiment, carried out with intense daily temperatures variations but constant mean value, 324
highlighted that temperature adaptation is complex and depends not only on the average 325
temperature but also on the temperature range and its dynamics. It also highlighted the importance 326
to consider all the cardinal temperatures and not only the optimal growth temperature as it is too 327
often the case. 328
Figure 4: comparison between the new STurb and SFb strains and the initial W2X strain. A) Growth 329
rate. B) Cardinal temperatures and thermal niche. Values are expressed as the mean ± standard 330
deviation determined by a jackknife analysis. Groups marked with the same letter (a, b or c) are not 331
statistically different (1 % error, Student test). Different letters indicate groups statistically different. 332
Evolution of the biochemical composition across the selection procedure. In T. lutea, nitrogen
times more neutral lipids (1.7 times more total lipids and a higher ratio of neutral to polar lipids) than 335
the wild type (CCAP 927/14; [17]). After our thermal selection experiment, it was necessary to check 336
the preservation of these highly interesting lipid properties. Lipid content of the adapted strains 337
cultivated at 28°C during the TIP experiment was compared with measurements made on the initial 338
W2X, during the benchmark experiment, in the same culture conditions. Starvation state were 339
similar (C:N ratio : 20.9, 17.7 and 18.0 ± 1.3 mol:mol respectively for SFb, STurb and W2X). 340
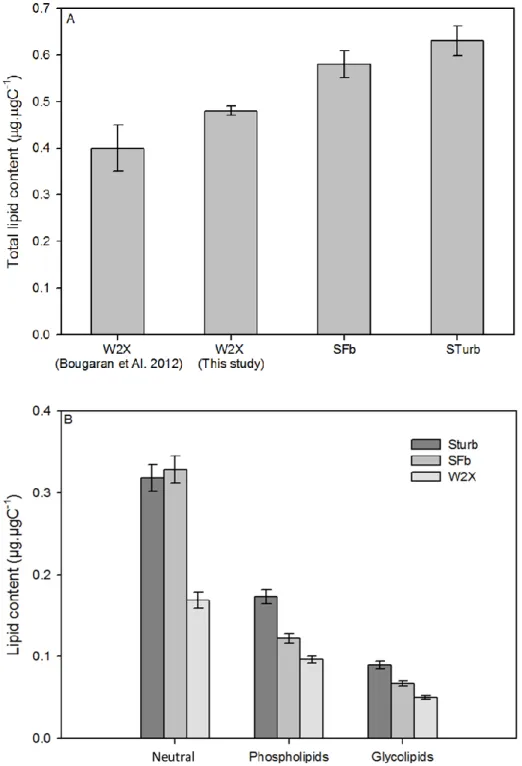
The adapted SFb and STurb strains had higher total lipid content than the initial W2X strain (0.58, 341
0.63 and 0.48 ± 0.01 µg.µgC-1 respectivelyfor SFb, STurb and W2X; Fig 5A). Lipid content found for
342
the W2X was in accordance with result from [17] for the same strain (0.4 ± 0.05 µg.µgC-1). It could be
343
hypothesized that total lipids were enhanced due to the thermal stress response induced by 344
temperature variations. The acclimation response of total lipids to temperature is not clear in the 345
literature [39]. For some species, total lipids increased as temperature decreases, and reach 346
maximum levels at extreme temperatures [40][40][41][3]. Other authors found a strong link between 347
total lipid content and growth rate [42][43][14]. However, only acclimation to temperature was 348
studied without emphasis on long term evolution. 349
Moreover, the repartition in lipid classes changed strongly between the adapted and the initial 350
strains. Under nitrogen starvation, adapted strains exhibited higher neutral lipid content (+ 92 %) and 351
higher phospholipid content (+53 %) than the W2X strain (Fig. 5B). No difference was observed in the 352
relative repartition of free fatty acids between these strains (Tab. 2). In response to cold 353
temperatures, membrane cell fluidity is preserved by an increase of polyunsaturated fatty acid and a 354
decrease of saturated and monosaturated fatty acid [14]. Very few information exist on lipid class 355
response to temperature (phospholipids, glycolipids and neutral lipids). Some works suggest that an 356
increase of the temperature increases total lipids and neutral lipids [44]. Once again, these works 357
studied only acclimation. Lipid adaptation to temperature was never experimented. Lipids were 358
affected by the thermal selection procedure but the attractive lipid profile of the initial strain in term 359
of neutral lipids production was not degraded but on the contrary improved. At the end, total lipid 360
productivity of the adapted strains was increased by 34% when compared with the initial W2X (13.6, 361
14.1 and 10.3 µgLipid.mL-1.d-1 for Sturb, SFb and W2X respectively).
362
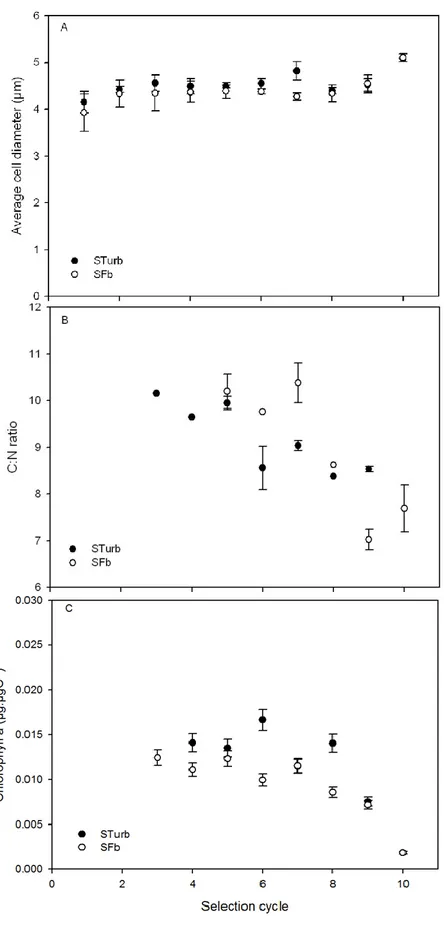
It is generally observed that warmer temperatures are more favorable to smaller cells, probably due 363
to the increase in enzymatic reaction rates [45][46]. During our selection procedure, the average cell 364
diameter was significantly decreased (ANOVA, p-value > 0.1), except during the last selection cycles 365
(9, 10) where it increased (Fig. 6 A). Moreover, the C:N ratio gradually decreased (Fig. 6 B), while the 366
Chl a:C ratio started to decrease after selection cycle 6 (Fig. 6 C). All these observations are 367
characteristic of cold adaptation pattern, as reported by [3] and [47] for T. lutea. This acclimation 368
features at lower temperature reflect the reallocation of cell resources (energy, carbon) necessary to 369
enhance the temperature-dependent biochemical reactions of the photosynthesis dark phase and to 370
rebalance the energy produced by the temperature-independent photochemical reactions involved 371
in the photosynthesis light phase [47]. 372
These results were unexpected since the daily average temperature was constant throughout the 373
selection (28°C). Our selection protocol turned out to be more selective towards cold temperatures 374
than high temperatures, probably because the decrease in temperature at each selection cycle was 375
more severe than its increase (-2°C and +1°C respectively). Secondly, this selection protocol was 376
dynamic and necessitated a continuous thermal acclimation. This particular physiological status may 377
offer a higher plasticity and acclimation capacity. 378
Figure 5: comparison of the total lipids (A) and lipid classes (B) between the adapted Sturb and SFb 379
strains (n = 3; measurement triplicates) and the initial W2X strain (n=3; independent culture 380
triplicates) after nitrogen starvation. 381
382 383
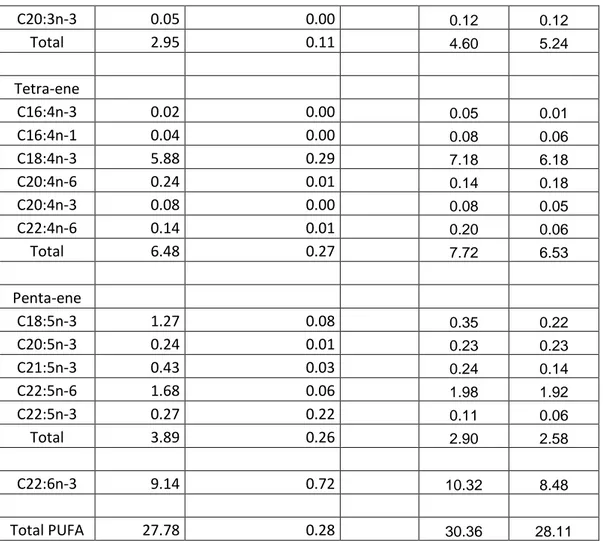
W2X Standard deviation STurb SFb Saturated ISO14:0 0.02 0.01 0.11 0.02 C14:0 23.64 0.88 27.95 23.92 ISO15:0 0.30 0.02 0.35 0.22 ANT15:0 0.14 0.02 0.13 0.15 C15:0 0.36 0.03 0.36 0.26 ISO16:0 0.04 0.01 0.14 0.08 ISO17:0 0.16 0.00 0.08 0.07 ANT17:0 0.04 0.01 0.05 0.04 C16:0 16.06 0.18 15.08 16.02 C17:0 0.08 0.00 0.05 0.05 C18:0 0.57 0.08 0.35 0.54 Total 41.86 0.89 44.64 41.37 Mono-ene C14:1n-5 0.71 0.08 0.78 0.62 C15:1n-8 0.03 0.01 0.03 0.03 C15:1n-6 0.01 0.00 0.02 0.02 C16:1n-7 2.98 0.23 2.93 2.26 C16:1n-5 0.32 0.01 0.34 0.46 C18:1n-9 22.27 1.14 18.03 24.37 C18:1n-7 2.94 0.24 0.96 1.43 C18:1n-5 0.45 0.05 1.32 0.53 C20:1n-9 0.10 0.01 0.07 0.04 C20:1n-7 0.03 0.00 0.00 0.04 C20:1n-5 0.08 0.01 C22:1n-13+11 0.22 0.06 0.25 0.31 C22:1n-9 0.12 0.16 0.27 0.41 Total 30.35 0.81 24.99 30.51 Di-ene C16:2n-6 0.14 0.01 0.08 0.07 C16:2n-4 0.41 0.02 0.34 0.26 C18:2n-6 4.14 0.15 3.85 4.79 C20:2n-6 0.16 0.03 0.55 0.17 Total 5.32 0.13 4.82 5.29 Tri-ene C16:3n-4 0.05 0.01 0.02 0.01 C16:3n-3 0.23 0.01 0.20 0.17 C18:3n-6 0.20 0.02 0.11 0.11 C18:3n-3 2.25 0.08 4.05 4.75
C20:3n-3 0.05 0.00 0.12 0.12 Total 2.95 0.11 4.60 5.24 Tetra-ene C16:4n-3 0.02 0.00 0.05 0.01 C16:4n-1 0.04 0.00 0.08 0.06 C18:4n-3 5.88 0.29 7.18 6.18 C20:4n-6 0.24 0.01 0.14 0.18 C20:4n-3 0.08 0.00 0.08 0.05 C22:4n-6 0.14 0.01 0.20 0.06 Total 6.48 0.27 7.72 6.53 Penta-ene C18:5n-3 1.27 0.08 0.35 0.22 C20:5n-3 0.24 0.01 0.23 0.23 C21:5n-3 0.43 0.03 0.24 0.14 C22:5n-6 1.68 0.06 1.98 1.92 C22:5n-3 0.27 0.22 0.11 0.06 Total 3.89 0.26 2.90 2.58 C22:6n-3 9.14 0.72 10.32 8.48 Total PUFA 27.78 0.28 30.36 28.11 384 385
Table 2: relative fatty acid composition of the two new adapted strains in comparison with the initial 386
W2X strain (n=3; independent culture triplicates) as a % of total fatty acid. 387
Figure 6: evolution of three biological markers during the selection process at the first iteration of 388
each cycle. A) Evolution of the cell diameter. B) C: N ratio C) Chl a: Carbon ratio. Standard deviation 389
was calculated on triplicate of independent measurements. 390
Conclusion 391
Dynamical selection pressure in continuous culture, for long periods of time has a strong potential 392
for domesticating strains for industrial applications. This study highlights the possibility to impact the 393
thermal niche of T. lutea by modifying Tmin and Tmax with fluctuating temperatures but at constant
394
daily average temperature. The increase in the thermal niche was also concomitant to an increase in 395
the maximum growth rate and associated to important physiological changes similar to a ‘cold-396
temperature’ acclimation. This approach permitted to keep the initial lipid properties of the strains in 397
term of neutral lipids production. One of the most interesting features triggered by the highly 398
dynamic protocol must still be explored: the capacity of the new strains to acclimate more rapidly 399
under large temperature fluctuations. 400
Acknowledgements 401
H. Bonnefond acknowledges the support of an ADEME grant. The experiments were carried out in 402
the framework of the ANR Facteur 4 ANR-12-BIME-0004. The authors gratefully acknowledge P. 403
Chang for improvement of the English and T. Blasco for total carbon measurements. 404
Cited references 405
1. Ras M, Steyer J, Bernard O. Temperature effect on microalgae: a crucial factor for outdoor 406
production. Rev Environ Sci Biotechnol. 2013; 153–164. doi:10.1007/s11157-013-9310-6 407
2. Béchet Q, Shilton A, Guieysse B. Modeling the effects of light and temperature on algae 408
growth: state of the art and critical assessment for productivity prediction during outdoor 409
cultivation. Biotechnol Adv. Elsevier Inc.; 2013;31: 1648–63. 410
doi:10.1016/j.biotechadv.2013.08.014 411
3. Thompson PA, Guo M, Harrison PJ. Effects of variation in temperature. I. On the biochemical 412
composition of eight species of marine phytoplankton. J Phycol. 1992;28: 481–488. 413
4. Bernard O, Rémond B. Validation of a simple model accounting for light and temperature 414
effect on microalgal growth. Bioresour Technol. Elsevier Ltd; 2012;123: 520–7. 415
doi:10.1016/j.biortech.2012.07.022 416
5. Raven J a, Geider RJ. Temperature and algal growth. New Phytol. 1988;110: 441–461. 417
doi:10.1111/j.1469-8137.1988.tb00282.x 418
6. Padfield D, Yvon-Durocher G, Buckling A, Jennings S, Yvon-Durocher G. Rapid evolution of 419
metabolic traits explains thermal adaptation in phytoplankton. Ecol Lett. 2016;19: 133–142. 420
doi:10.1111/ele.12545 421
7. Luria SE, Delbrück M. Mutations of Bacteria from Virus Sensitivity to Virus Resistance. 422
Genetics. 1943;28: 491–511. doi:10.1038/nature10260 423
8. Siddiqui KS, Williams TJ, Wilkins D, Yau S, Allen MA, Brown M V., et al. Psychrophiles. Annu 424
Rev Earth Planet Sci. 2013;41: 87–115. doi:10.1146/annurev-earth-040610-133514 425
9. Xu Y, Feller G, Gerday C, Glansdorff N. Moritella Cold-Active Dihydrofolate Reductase : Are 426
There Natural Limits to Optimization of Catalytic Efficiency at Low Temperature ? Moritella 427
Cold-Active Dihydrofolate Reductase : Are There Natural Limits to Optimization of Catalytic 428
Efficiency at Low T. J Bacteriol. 2003;185: 5519–5526. doi:10.1128/JB.185.18.5519 429
10. Devos N, Ingouff M, Loppes R, Matagne RF. Rubisco adaptation to low temperatures: a 430
comparative study in psychrophilic and mesophilic unicellular algae. J Phycol. 1998;34: 655– 431
660. doi:10.1046/j.1529-8817.1998.340655.x 432
11. Mortain-Bertrand a., Descolas-Gros C, Jupin H. Growth, photosynthesis and carbon 433
metabolism in the temperate marine diatom Skeletonema costatum adapted to low 434
temperature and low photon-flux density. Mar Biol. 1988;100: 135–141. 435
doi:10.1007/BF00392963 436
12. Renaud SM, Zhou H, Parry D. Efect of temperature on the growth, total lipid content and fatty 437
acid composition of recently isolated tropical microalgae Isochrysis sp., Nitzschia closterium, 438
Nitzschia paleacea, and commercial species Isochrysis sp.(clone T. J Appl …. 1995; 595–602. 439
Available: http://link.springer.com/article/10.1007/BF00003948 440
13. Renaud SM, Thinh L-V, Lambrinidis G, Parry DL. Effect of temperature on growth, chemical 441
composition and fatty acid composition of tropical Australian microalgae grown in batch 442
cultures. Aquaculture. 2002;211: 195–214. doi:10.1016/S0044-8486(01)00875-4 443
14. Guschina I a, Harwood JL. Lipids and lipid metabolism in eukaryotic algae. Prog Lipid Res. 444
2006;45: 160–86. doi:10.1016/j.plipres.2006.01.001 445
15. Kobayashi Y, Harada N, Nishimura Y, Saito T, Nakamura M, Fujiwara T, et al. Algae Sense Exact 446
Temperatures: Small Heat Shock Proteins Are Expressed at the Survival Threshold 447
Temperature in Cyanidioschyzon merolae and Chlamydomonas reinhardtii. Genome Biol Evol. 448
2014;6: 2731–2740. doi:10.1093/gbe/evu216 449
16. Marchetti J, Bougaran G, Dean L Le. Optimizing conditions for the continuous culture of 450
Isochrysis affinis galbana relevant to commercial hatcheries. Aquaculture. 2012;326–329: 451
106–115. Available: http://www.sciencedirect.com/science/article/pii/S0044848611009094 452
17. Bougaran G, Rouxel C, Dubois N, Kaas R, Grouas S, Lukomska E, et al. Enhancement of neutral 453
lipid productivity in the microalga Isochrysis affinis Galbana (T-Iso) by a mutation-selection 454
procedure. Biotechnol Bioeng. 2012;109: 2737–45. doi:10.1002/bit.24560 455
18. Carrier G, Garnier M, Le Cunff L, Bougaran G, Probert I, De Vargas C, et al. Comparative 456
transcriptome of wild type and selected strains of the microalgae Tisochrysis lutea provides 457
insights into the genetic basis, lipid metabolism and the life cycle. PLoS One. 2014;9. 458
doi:10.1371/journal.pone.0086889 459
19. Guillard R. Culture of phytoplankton for feeding marine invertebrates. Cult Mar Invertebr 460
http://scholar.google.com/scholar?hl=en&btnG=Search&q=intitle:Culture+of+phytoplankton+ 462
for+feeding+marine+invertebrates#0 463
20. Bernard O. Odin [Internet]. 2016. Available: https://team.inria.fr/biocore/software/odin/ 464
21. Chevin L-M. On measuring selection in experimental evolution. Biol Lett. 2011;7: 210–213. 465
doi:10.1098/rsbl.2010.0580 466
22. Lichtenthaler H. Chlorophylls and carotenoids: Pigments of photosynthetic biomembranes. 467
Methods Enzymol. 1987;148: 350–382. Available: 468
http://www.sciencedirect.com/science/article/pii/0076687987480361 469
23. Bligh E, Dyer W. A rapid method of total lipid extraction and purification. Can J Biochem 470
Physiol. 1959;37: 911–917. Available: 471
http://www.nrcresearchpress.com/doi/abs/10.1139/o59-099 472
24. Morrison WR, Smith LM. Preparation of Fatty Acid Methyl Esters and Dimethylacetals From 473
Lipids With Boron Fluoride--Methanol. J Lipid Res. 1964;5: 600–608. 474
25. Costas E, Baselga-cervera B, Lopez-Rodas V. Estimating the Genetic Capability of Different 475
Phytoplankton Organisms to Adapt to Climate Warming. Oceanogr Open Access. 2014;2. 476
doi:10.4172/2332-2632.1000123 477
26. Masci P, Bernard O, Grognard F. Continuous selection of the fastest growing species in the 478
chemostat. IFAC Proceedings Volumes (IFAC-PapersOnline). 2008. doi:10.3182/20080706-5-479
KR-1001.3265 480
27. Hansen SR, Hubbell SP. Single-nutrient microbial competition: qualitative agreement between 481
experimental and theoretically forecast outcomes. Science. 1980;207: 1491–1493. 482
doi:10.1126/science.6767274 483
28. Eppley RW. Temperature and phytoplankton growth in the sea. Fish Bull. 1972;70. 484
29. Knies JL, Kingsolver JG, Burch CL. Hotter is better and broader: thermal sensitivity of fitness in 485
a population of bacteriophages. Am Nat. 2009;173: 419–430. doi:10.1086/597224 486
30. Levins R. Evolution in changing environments. Princet Univ Press Princet NJ. 1968;2: 120. 487
doi:10.2307/2173276 488
31. Huey RB, Slatkin M. cost and benefits of lizard thermoregulation. Q Rev og Biol. 1976;51: 363– 489
384. 490
32. Bennett A, Lenski R. Evolutionary adaptation to temperature II. Thermal niches of 491
experimental lines of Escherichia coli. Evolution (N Y). 1993;47: 1–12. Available: 492
http://www.jstor.org/stable/10.2307/2410113 493
33. Bennett A, Lenski R, Mittler J. Evolutionary adaptation to temperature. I. Fitness responses of 494
Escherichia coli to changes in its thermal environment. Evolution (N Y). 1992;46: 16–30. 495
doi:10.2307/2409801 496
34. Urban MC, Bürger R, Bolnick DI. Asymmetric selection and the evolution of extraordinary 497
defences. Nat Commun. 2013;4: 2085. doi:10.1038/ncomms3085 498
35. Huertas IE, Rouco M, López-Rodas V, Costas E. Warming will affect phytoplankton differently: 499
evidence through a mechanistic approach. Proc Biol Sci. 2011;278: 3534–43. 500
doi:10.1098/rspb.2011.0160 501
36. Grimaud GM, Le Guennec V, Ayata S-D, Mairet F, Sciandra A, Bernard O. Modelling the effect 502
of temperature on phytoplankton growth across the global ocean. IFAC-PapersOnLine. 503
Elsevier Ltd.; 2015;48: 228–233. doi:10.1016/j.ifacol.2015.05.059 504
37. Lacour T, Sciandra A, Talec A, Mayzaud P, Bernard O. Neutral Lipid and Carbohydrate 505
Productivities As a Response To Nitrogen Status in Isochrysis Sp. (T-Iso; Haptophyceae): 506
Starvation Versus Limitation1. J Phycol. 2012;48: 647–656. doi:10.1111/j.1529-507
8817.2012.01154.x 508
38. Breuer G, Lamers PP, Martens DE, Draaisma RB, Wijffels RH. The impact of nitrogen starvation 509
on the dynamics of triacylglycerol accumulation in nine microalgae strains. Bioresour Technol. 510
Elsevier Ltd; 2012;124: 217–226. doi:10.1016/j.biortech.2012.08.003 511
39. Hu Q, Sommerfeld M, Jarvis E, Ghirardi M, Posewitz M, Seibert M, et al. Microalgal 512
triacylglycerols as feedstocks for biofuel production: Perspectives and advances. Plant J. 513
2008;54: 621–639. doi:10.1111/j.1365-313X.2008.03492.x 514
40. Gigova L, Ivanova N, Gacheva G, Andreeva R, Furnadzhieva S. Response of Trachydiscus 515
Minutus (Xanthophyceae) To Temperature and Light1. J Phycol. 2012;48: 85–93. 516
doi:10.1111/j.1529-8817.2011.01088.x 517
41. Converti A, Casazza A a., Ortiz EY, Perego P, Del Borghi M. Effect of temperature and nitrogen 518
concentration on the growth and lipid content of Nannochloropsis oculata and Chlorella 519
vulgaris for biodiesel production. Chem Eng Process Process Intensif. 2009;48: 1146–1151. 520
doi:10.1016/j.cep.2009.03.006 521
42. Roleda MY, Slocombe SP, Leakey RJG, Day JG, Bell EM, Stanley MS. Effects of temperature and 522
nutrient regimes on biomass and lipid production by six oleaginous microalgae in batch 523
culture employing a two-phase cultivation strategy. Bioresour Technol. 2013;129: 439–49. 524
doi:10.1016/j.biortech.2012.11.043 525
43. Vítová M, Bišová K, Kawano S, Zachleder V. Accumulation of energy reserves in algae: From 526
cell cycles to biotechnological applications. Biotechnol Adv. 2015; 527
doi:10.1016/j.biotechadv.2015.04.012 528
44. Sriharan S, Bagga D, Nawaz M. The effects of nutrients and temperature on biomass, growth, 529
lipid production, and fatty acid composition of Cyclotella cryptica Reimann, Lewin, and 530
Guillard. Appl Biochem Biotechnol. 1991;28–29: 317–326. doi:10.1007/BF02922611 531
45. Daufresne M, Lengfellner K, Sommer U. Global warming benefits the small in aquatic 532
ecosystems. Proc Natl Acad Sci U S A. 2009;106: 12788–12793. doi:10.1073/pnas.0902080106 533
46. Finkel Z V., Beardall J, Flynn KJ, Quigg A, Rees TA V, Raven J a. Phytoplankton in a changing 534
world: Cell size and elemental stoichiometry. J Plankton Res. 2010;32: 119–137. 535
doi:10.1093/plankt/fbp098 536
47. Geider RJ. Light and temperature dependence of the carbon to chlorophyll a ratio in 537
microalagae and cyanobacteria: imoplication for physiology and growth of phytoplankton. 538
New Phytol. 1987;106: 1–34. 539