HAL Id: hal-01505462
https://hal-univ-rennes1.archives-ouvertes.fr/hal-01505462
Submitted on 6 Sep 2017HAL is a multi-disciplinary open access archive for the deposit and dissemination of sci-entific research documents, whether they are pub-lished or not. The documents may come from teaching and research institutions in France or abroad, or from public or private research centers.
L’archive ouverte pluridisciplinaire HAL, est destinée au dépôt et à la diffusion de documents scientifiques de niveau recherche, publiés ou non, émanant des établissements d’enseignement et de recherche français ou étrangers, des laboratoires publics ou privés.
Synthesis, Spectroelectrochemical Behavior, and
Chiroptical Switching of Tris(β-diketonato) Complexes
of Ruthenium(III), Chromium(III), and Cobalt(III)
Miguel Cortijo, Christine Viala, Thibault Reynaldo, Ludovic Favereau,
Isabelle Fabing, Monika Srebro-Hooper, Jochen Autschbach, Nicolas
Ratel-Ramond, Jeanne Crassous, Jacques Bonvoisin
To cite this version:
Miguel Cortijo, Christine Viala, Thibault Reynaldo, Ludovic Favereau, Isabelle Fabing, et al.. Synthe-sis, Spectroelectrochemical Behavior, and Chiroptical Switching of Tris(β-diketonato) Complexes of Ruthenium(III), Chromium(III), and Cobalt(III). Inorganic Chemistry, American Chemical Society, 2017, 56 (8), pp.4555-4567. �10.1021/acs.inorgchem.6b03094�. �hal-01505462�
1
Synthesis, spectroelectrochemical behavior and
chiroptical switching of tris(β-diketonato)
complexes of Ru(III), Cr(III), and Co(III)
Miguel Cortijo,a Christine Viala,a Thibault Reynaldo,b Ludovic Favereau,b Isabelle Fabing,c
Monika Srebro-Hooper,d,* Jochen Autschbach,e,* Nicolas Ratel-Ramond,a Jeanne Crassous,b,*
and Jacques Bonvoisina,*
a
CEMES, CNRS UPR 8011, Université de Toulouse, 29 Rue Jeanne Marvig, BP 94347,
31055 Toulouse Cedex 4, France. E- mail: jbonvoisin@cemes.fr
b
Sciences Chimiques de Rennes UMR 6226, CNRS-Université de Rennes 1, Campus de
Beaulieu, 35042 Rennes Cedex, France. E-mail: jeanne.crassous@univ-rennes1.fr
c
UMR CNRS 5068, LSPCMIB, Université Paul Sabatier, 118 route de Narbonne, 31062
Toulouse Cedex 9, France.
d
Faculty of Chemistry, Jagiellonian University, R. Ingardena 3, 30-060 Krakow, Poland.
E-mail: srebro@chemia.uj.edu.pl
e
Department of Chemistry, University at Buffalo, State University of New York, Buffalo,
NY 14260, USA. Email: jochena@buffalo.edu
KEYWORDS. tris(β-diketonato) complexes, spectroelectrochemistry, electronic circular
2
ABSTRACT. Five tris(β-diketonato) complexes of ruthenium(III), chromium(III), and cobalt(III) (Ru(Buacac)3 (1), Ru(Oacac)3 (2), Cr(Buacac)3 (3), Cr(Oacac)3 (4), and
Co(Buacac)3 (5), Buacac = 3-butylpentane-2,4-dionato, Oacac = 3-octylpentane-2,4-dionato)
with a chiral propeller-like structure have been prepared. Ligands and complexes syntheses
are presented together with the characterization of the compounds by 1H- and 13C-NMR,
mass spectrometry, IR, UV-vis, electronic circular dichroism (ECD) spectroscopy,
electrochemistry studies, and first-principles calculations. The crystal structures of 1 and 5
have also been obtained and analyzed. A comparison of the 1H-NMR spectra of diamagnetic
(ligands and 5) and paramagnetic species (1 and 2) is presented. The optical resolution of the
five complexes has been achieved for the first time by supercritical fluid chromatography
using a chiral column, giving rise to very high purity grades in all cases. ECD measurements
and calculations for 1-5 have led to the assignment of the absolute configuration,
∆
orΛ
, ofeach enantiomer. Spectroelectrochemical UV-vis and ECD studies have been performed on
Ru
Λ
-2 and CrΛ
-4 complexes revealing their redox-triggered chiroptical switching activityand the non-innocence character of the β-diketonate ligands.
Introduction
Tris(β-diketonato) such as tris(pentane-2,4-dionato) complexes are intrinsically chiral
because of their propeller-like structure that displays an idealized D3 symmetry. They present
two possible configurations,
∆
orΛ
, that can be determined by the principle of the skew-lineconvention (Figure 1).1-2This type of compounds has been attracting a great deal of attention
as dopants in (achiral) nematic liquid crystals (NLCs) to form chiral LCs, also known as
cholesteric LCs (CLCs),3-11 which exhibit a twisted molecular arrangement. The first example
3 enantiomerically pure M(acac)3 complexes with M = Co, Cr, Ir, Rh, Ru, and acac =
acetylacetonate (pentane-2,4-dionate) ion to induce chirality in liquid crystals. The M(acac)3
display however a limited solubility in NLC at room temperature and therefore the use of
acac ligands with elongated substituents has been shown more convenient.3-11 LCs may also
undergo macroscopic structural transformations due to photo-induced conformational
changes of a dopant.6-11 For example, Horie and coworkers studied the photoracemization of
chromium(III) complexes Cr(Buacac)37-8 or Cr(Oacac)36 dissolved in a NLC, demonstrating
the chiroptical induction of a periodic stripe texture known as cholesteric fingerprint texture
of LC under the irradiation of visible circularly polarized light.This may allow the control of
the helical twist sense in a CLC and, consequently, the control of the handedness of circularly
polarized reflected light, i.e. chirality of a CLC.12
β-Diketonato ruthenium complexes bearing π-conjugated ligands are also known to display
electroactive properties. In this domain, many carbon-rich, polyimine, quinonoid, diketonato,
cyclometalated, and carbenic Ru(II) or Ru(III) complexes have been quite recently
reported.13-23 All these compounds possess at least one organic extended π-conjugated ligand
with non-innocent behavior, which means that induced upon redox process charge density is
localized not only on the metal ion, but also supported by the ligand itself. Surprisingly, to
the best of our knowledge,24-29 the spectroelectrochemical properties and redox chiroptical
switching of the parent tris(β-diketonato) transition metal complexes M(acac)3 have never
been studied, although the acac ligands are π-conjugated and their π-electron system can
4 O O O O O O M O O O O O O M
∆
Λ
Figure 1. Representation of
∆
andΛ
enantiomers of a tris(β-diketonato) M(III) complex. Taking all this into account, we have prepared five chiral tris(β-diketonato) complexesbased on Ru(III), Cr(III), and Co(III) transition-metal centers with ligands containing
elongated alkyl substituent in the 3-position of the pentane-2,4-dionate (acac) ion,
Ru(Buacac)3 (1), Ru(Oacac)3 (2), Cr(Buacac)3 (3), Cr(Oacac)3 (4), and Co(Buacac)3 (5) (see
Figure 2), that thanks to increased solubility in liquid crystals may be promising candidates
for future applications in, for example, doping liquid crystals. The systems have been fully
characterized by NMR spectroscopy, mass spectrometry, cyclic voltammetry, single-crystal
X-ray diffraction studies, IR, UV-vis, and electronic circular dichroism (ECD)
spectroscopies. The optical resolution of several examples of similar compounds has been
achieved using either a conventional chromatographic column packed with a
∆
-[Ru(phenanthroline)3]2+ system24-25 or HPLC with different chiral columns.5-6,26,30-32
However, to the best of our knowledge, this is the first time that supercritical fluid
chromatography (SFC) has been employed to optically resolve this type of complexes.
Absolute configuration (AC) of all the enantiomers was assigned by comparison of the
measured ECD spectra with those of similar compounds in the literature33 and the simulated
ones based on first-principles calculations. Finally, the electroactive properties of these
complexes enabled to evaluate their ability to act as chiroptical switches and the effect of
redox activity on their electronic and optical properties has been rationalized with a help of
5
Figure 2. (Left): Acetylacetonate-based ligands presented in this work. The numbering
employed to assign the 1H-NMR data is depicted in blue. (Right): The corresponding metal
complexes studied.
Experimental section
Materials
All chemicals and solvents were of reagent grade or better. Sodium pentane-2,4-dionate
was prepared according to a published procedure.34 The ligands and complexes were purified
prior to the supercritical fluid chromatography (SFC) by column chromatography using silica
gel of high-purity grade for flash chromatography (Fluka). Analytical thin layer
chromatography (TLC) was carried out using silica gel on TLC Al foils with fluorescence
6
Physical measurements
IR spectra were measured on a Perkin Elmer Spectrum 100 FT-IR spectrometer with
samples as KBr pellets. UV-visible spectra were recorded on a Varian Cary 5000
spectrophotometer. Cyclic voltammograms were obtained with an Autolab system
(PGSTAT100) in CH2Cl2 (0.1 M tetrabutylammonium hexafluorophosphate, n-Bu4NPF6 =
TBAPF6, as supporting electrolyte) at 25°C. A three-electrode cell was used comprising a 1
mm Pt-disk working electrode, a Pt-wire auxiliary electrode, and an aqueous saturated
calomel (SCE) reference electrode. Mass spectra were recorded by the ‘Service de
Spectroscopie de Masse’ of Paul Sabatier University using ESI UPLC XEVO G2 QTOF and
UHPLC 3000 DIONEX or EI (NH3) DSQ Thermo Fisher Scientific or ESI QTRAP 2000
(Applied Biosystems) and API-365 (Perkin Elmer Sciex). 1H-NMR and 13C-NMR spectra
were measured on Bruker Avance 500 MHz CryoSonde and Bruker Avance 300 MHz
equipments in CD2Cl2 and CDCl3 at 20°C (CD2Cl2 at δH: 5.32, δC: 54.0, CDCl3 at δH: 7.26,
δC: 77.16 ppm). 1H and 13C chemical shifts are reported in parts per million (ppm) relative to
Me4Si as reference standard. Electronic circular dichroism, ECD, (in M-1 cm-1) was measured
on a Jasco J-815 Circular Dichroism Spectrometer (IFR140 facility - Biosit - Université de
Rennes 1).
Optical resolutions
Supercritical fluid chromatography (SFC) has become a mainstream technology for chiral
separations based on its higher efficiency, throughput, and wide applicability. Isocratic
method development was developed on the ACQUITY UltraPerformance Convergence
Chromatography System™(UPC²)® from Waters. Chiral separations were run on
Preparative-scale SFC 80q system from Waters using a Chiralpack IC 5 µm (20 x 250) mm
column and a 2489 UV detector from Waters monitoring at 367 nm for 1, 2 and 4; 352 nm for
3, and 245 nm for 5. The working temperature and pressure of the column were 40ºC and 100
7 conditions and stacked injections for optimal collection efficiency. This process is called
volume overloading as opposed to concentration overloading.35 In order to increase the
productivity, the stacked injections gave the possibility to perform the second injection before
the end of the elution of the second enantiomer. All compounds were eluted in isocratic mode
using a 40 mL/min flow of a mixture of CO2/MeOH (8/2) except for 3, which was eluted with
a mixture of CO2/CH3CN (8/2). For 1, a sample of 400 mg was dissolved in 6 mL of
methanol, concentration of the injected quantity was 66.6 mg/mL. The volume of injection
was 0.5 mL which generated a mass of 33 mg per injection. Here, 9 injections of 33 mg or
297 mg were resolved in less than 50 min (see Figure S1c in the Supporting Information, SI).
For 2, a sample of 200 mg was dissolved in 8 mL of acetonitrile, concentration of the injected
quantity was 25 mg/mL. The volume of injection was 0.5 mL which generated a mass of 12.5
mg per injection. Here, 6 injections of 12.5 mg or 75 mg were resolved in less than 35 min
(Figure S1h, SI). For 3, compound was eluted in isocratic mode using a 40 mL/min flow of a
mixture of CO2/CH3CN (8/2). A sample of 200 mg was dissolved in 20 mL of acetonitrile;
concentration of the injected quantity was 10 mg/mL. The volume of injection was 1 mL
which generated a mass of 10 mg per injection. Here, 13 injections of 10 mg or 130 mg were
made in less than 104 min (Figure S1m, SI). For each fraction of 3, a second purification in
the same conditions was carried out to improve the purity of each of the peaks. This
separation was more difficult than the others. For 4, a sample of 200 mg was dissolved in 5
mL of methanol, concentration of the injected quantity was 40 mg/mL. The volume of
injection was 0.5 mL which generated a mass of 20 mg per injection. Here, 6 injections of 20
mg or 120 mg were resolved in less than 35 min (Figure S1r, SI). For 5, a sample of 200 mg
was dissolved in 5 mL of heptane, concentration of the injected quantity was 40 mg/mL. The
volume of injection was 0.5 mL which generated a mass of 20 mg per injection. Here, 9
Post-8 enantioseparation analyses were determined on an ACQUITY UPC² System from Waters
using a Chiralpack IC 3 µm (4.6 x 100 mm) column eluted with supercritical (sc)
CO2/CH3OH under gradient conditions. The detection was performed with an UV detector
coupled to a simple quadrupole mass detector from Waters. The flow was 1 mL/min. Starting
mobile phase composition of the gradient was 100% CO2 and final mobile phase composition
was a mixture of sc CO2 and CH3OH (70/30). The eluent composition was changing during 5
min. The working temperature and pressure of the column were 40°C and 120 bar. Purities
very close to 100% were obtained in all cases. All the analytical SFC files before and after
the chiral resolutions and the preparative SFC files are shown in the SI (part S1).
X-ray diffraction studies
Data for X-ray single-crystal structure determination were collected with a Nonius
Kappa-CCD automatic X-ray single-crystal diffractometer, using Mo Kα radiation, for which a
graphite monochromator was applied. Intensities were measured using an Apex2 detector and
at a temperature of 293 K. The crystallographic cell was found using Apex2 software.36 The
point group determination was followed by the determination of the position of all
non-hydrogen atoms by direct methods using SIR201137 and refined in the WinGX software
package38 using SHELX-97.39 Absorption corrections were performed using the SADABS
program.36 All non-hydrogen atoms were refined isotropically and then anisotropically. All
hydrogen atoms were placed geometrically and treated as riding in geometrically optimized
positions. CCDC 1423363 and CCDC 1476307 contain the supplementary crystallographic
data for this paper. These data can be obtained free of charge from the Cambridge
9
Table 1. Crystal and refinement data for 1 and 5.
Empirical Formula C27 H45 O6 Co [5] C27 H45 O6 Ru [1] Formula Weight 522.54 566.7 Wavelength (Å) 0.71073 0.71073
Crystal System Triclinic Triclinic
Space Group P-1 P-1
Unit cell dimensions
a (Å) 7.894 7.874 b (Å) 12.073 12.144 c (Å) 15.577 15.678 α (°) 83.38 83.19 β (°) 76.53 76.27 γ (°) 77.64 78.58 Volume (Å3) 1406.9 1423.4 Z 2 2 Dcalc (Mg/m3) 1.234 1.322 µ(MoKα) (mm-1) 0.646 0.586 F(000) 560 598 Crystal size (mm) 0.5*1.2*1.3 0.1*0.6*1 θ Range for data
collection (°) 1.347-28.386 1.716-28.877 Limiting indices -10<h<10 -10<h<10 -16<k<16 -16<k<16 -20<l<20 -21<l<21 Reflections observed/unique 45050/7053 75489/7434 Completeness to θ (%) 99.8 99.3
Refinement method Full matrix least squares on F2 Data/parameters 7053/316 6232/307 Goodness of fit on F2 1.062 1.087
Final R indices R1=0.0564 R1=0.0401 wR2=0.1773 wR2=0.1304 Largest difference in
peak and hole (e Å-3) 1.02 and -0.75 0.84 and -0.86
Ligands syntheses
A mixture of the corresponding 1-alkyliodide (32.0 mmol) and sodium pentane-2,4-dionate
(3.20 g, 26.0 mmol) in 2-butanone (50 mL) was heated under reflux for 72 h. Then, the
solvent was evaporated and diethyl ether was added. The solution was filtrated off, extracted
twice with brine and dried with magnesium sulfate. After evaporation of the solvent, the
10
3-butylpentane-2,4-dione (Buacac): yellowish oil (2.20 g, 54%). 1H-NMR (300 MHz,
CD2Cl2): keto (70%): 3.60 (t, J: 7.2 Hz, 1H), 2.14 (s, 6H), 1.83-1.76 (m, 2H), 1.40-1.14 (m,
4H), 0.88 (t, J: 7.2 Hz, 3H); enol (30%): 16.69 (s, 1H), 2.20 (m, 2H), 2.11 (s, 6H), 1.40-1.14
(m, 4H), 0.93 (t, J: 6.9 Hz, 3H). 13C-NMR (300 MHz, CD2Cl2): keto: 204.96, 69.06, 30.28,
29.62, 28.51, 23.12, 14.11; enol: 191.57, 111.16, 33.33, 27.75, 23.22, 23.19, 14.21. Chemical
Ionization-MS (NH3) 157 [M+H]+, 174 [M+NH4]+.
3-octylpentane-2,4-dione (Oacac): yellowish oil (2.44 g, 44%). 1H-NMR (300 MHz,
CD2Cl2): keto (70%): 3.58 (t, J: 7.2 Hz, 1H), 2.13 (s, 6H), 1.81-1.74 (m, 2H), 1.25 (m, 12H), 0.86 (t, J: 7.2 Hz, 3H); enol (30%) 16.69 (s, 1H), 2.21-2.16 (m, 2H), 2.10 (s, 6H), 1.25 (m, 12H), 0.87 (t, J: 7.2 Hz, 3H). 13C-NMR (300 MHz, CD2Cl2): keto: 204.97, 69.12, 32.40, 30.04, 29.85, 29.83, 29.76, 29.63, 28.83, 23.22, 14.43; enol: 191.57, 111.22, 32.44, 31.18, 30.17, 29.97, 29.89, 28.06, 23.22, 23.22, 14.43. Chemical Ionization-MS (NH3) 213 [M+H]+, 230 [M+NH4]+.
Complexes syntheses
Synthesis of Ru(Buacac)3 (1) and Ru(Oacac)3 (2): Ruthenium(III) chloride hexahydrate
(0.61 g, 2.5 mmol), the corresponding 3-alkylpentane-2,4-dione (7.5 mmol) and urea (0.45 g,
7.5 mmol) were placed in a purged flask and dissolved in 40 mL of a methanol/water (1/1)
mixture. The solution was refluxed under argon for 24 h. Then, the system was allowed to
warm up to room temperature and extracted with dichloromethane and brine. The organic
solution was dried over magnesium sulfate and evaporated. The product was purified by
chromatography in silica gel using dichloromethane as eluent. Crystals of 1 suitable for
single-crystal X-ray diffraction were obtained from a concentrated solution of the complex in
hexane at -20ºC.
Ru(Buacac)3 (1): red lake (0.46 g, 32%). 1H-NMR (500 MHz, CD2Cl2): 29.48 (s, 1H),
11 cm-1): 2960m, 2927m, 2876w, 2855w
ν
(C–H), 1541ν
(C=O) andν
(C=C). TOF-MS ES+: 567[M+H]+, 590 [M+Na]+, 1157 [2M+Na]+.
Ru(Oacac)3 (2): red lake (0.47 g, 26%). 1H-NMR (500 MHz, CD2Cl2): 29.29 (s, 1H), 28.99
(s, 1H), 1.84 (s, 2H), 1.72 (s, 2H), 1.34 (s, 6H), 0.91 (3H), -0.29 (s, 1H), -1.15 (s, 1H), -9.80
(s, 6H). IR (KBr, cm-1): 2956m, 2924m, 2866, 2854w
ν
(C–H), 1542ν
(C=O) andν
(C=C).TOF-MS ES+: 736 [M+H]+, 759 [M+Na]+, 1494 [2M+Na]+.
Synthesis of Cr(Buacac)3 (3) and Cr(Oacac)3 (4): The procedure was adapted from the literature.6,8 A solution of the corresponding 3-alkylpentane-2,4-dione (7.5 mmol), chromium
chloride hexahydrate (0.67 g, 2.5 mmol), urea (0.45 g, 2.5 mmol) in a 50 mL mixture of
water/ethanol (1/1) was heated under reflux for 24 h. The system was allowed to warm up to
room temperature and extracted with dichloromethane and brine. The organic solution was
dried over magnesium sulfate and evaporated. The product was purified by chromatography
in silica gel using dichloromethane as eluent.
Cr(Buacac)3 (3): green oil (0.20 g, 18%). The 1H NMR spectrum could not be interpreted.
IR (KBr, cm-1): 2957m, 2930m, 2866w, 2848w
ν
(C–H), 1563ν
(C=O). TOF-MS ES+: 518[M+H]+, 540 [M+Na]+, 1058 [2M+Na]+.
Cr(Oacac)3 (4): green oil (0.44 g, 25%). The 1H NMR spectrum could not be interpreted.
IR (KBr, cm-1): 2956m, 2924m, 2854m
ν
(C–H), 1568ν
(C=O). TOF-MS ES+: 687 [M+H]+,709 [M+Na]+, 1394 [2M+Na]+.
Synthesis of Co(Buacac)3 (5): The procedure was adapted from the literature.40
3-Butylpentane-2,4-dione (1.00 g, 6.40 mmol) was suspended in 60 mL of a water/ethanol (5/1)
mixture, and treated with a 0.2 M solution of NaOH (32 mL). A solution of sodium
hexanitritocobaltate(III) (0.86 g, 2.13 mmol) in 30 mL of water was then slowly added and
the reaction mixture was stirred at room temperature for 5 h. The residue was extracted with
12 purified by chromatography in silica gel using a mixture of dichloromethane/hexane (1/1) as
eluent.
Co(Buacac)3 (5): green lake (0.14 g, 13%). 1H-NMR (300 MHz, CD2Cl2): 2.30 (t, 2H),
2.19 (s, 6H), 1.37-1.35 (m, 4H), 0.93 (t, 3H). 13C-NMR (500 MHz, CDCl3): 187.93, 107.28,
33.5, 29.47, 25.43, 22.63, 14.21. IR (KBr, cm-1): 2960m, 2930m, 2875w, 2857w
ν
(C–H),1568s
ν
(C=O) andν
(C=C). TOF-MS ES+: 525 [M+H]+, 547 [M+Na]+, 563 [M+K]+, 1071[2M+Na]+.
Electrochemistry / Spectroelectrochemistry
Cyclic voltammograms were obtained with an Autolab system (PGSTAT100) in CH2Cl2
(0.1 M TBAPF6, as supporting electrolyte) at 25°C. A three electrode cell was used
comprising a 1 mm Pt-disk working electrode, a Pt-wire auxiliary electrode, and an aqueous
saturated calomel (SCE) reference electrode. UV/Vis/NIR spectroelectrochemistry (SEC)
experiments were performed at 20°C, under argon, with a home-built Optically Transparent
Thin-Layer Electrosynthetic (OTTLE) cell, using a Varian CARY 5000 spectrometer and an
EG&G PAR model 362 potentiostat. A Pt mesh was used as the working electrode, a Pt wire
as the counter electrode, and a Pt wire as a pseudo-reference electrode. The electrodes were
arranged in the cell such that the Pt mesh was in the optical path of the quartz cell. The
anhydrous freeze-pump-thaw degassed sample-electrolyte solution (0.2 M TBAPF6) was
cannula-transferred under argon into the cell previously thoroughly deoxygenated. Stable
isobestic points were observed during oxidation or reduction. In every case reduced or
re-oxidized samples displayed in the spectral region of interest no features other than those of
the parent material. ECD experiments were performed in similar conditions using a modified
cell with KBr windows, on a Jasco J-815 Circular Dichroism Spectrometer (IFR140 facility -
Computational details
To obtain insight into electronic structure and spectroscopic features of the experimentally
studied complexes 1-5, Kohn
optimizations and time-dependent KS (TDKS, TDDFT) response calculations were
performed for a series of Λ-M(Meacac)
dione) species (Figure 3). For compari
corresponding Λ-M(acac)3 (M = Ru, Cr, Co; acac = pentane
stability of different spin electronic configurations was also examined. A high similarity
between simulated spectral envelopes for M(Meacac)
(acac)3 core is predominantly responsible for the observed spectral features (note also high
resemblance of experimental ECD spectra of
complexes); in some cases the alkyl substituents of acac ligands appear however to slightly
affect energetic position and intensity of calculated bands.
Figure 3. Molecular structure of M(Meacac)
model for 1-5 along with
spin-To obtain insight into electronic structure and spectroscopic features of the experimentally
, Kohn-Sham density functional theory (KS DFT) geometry
dependent KS (TDKS, TDDFT) response calculations were
M(Meacac)3 (M = Ru, Cr, Co; Meacac = 3-methylpentane
). For comparison, some computations were also carried out for the
(M = Ru, Cr, Co; acac = pentane-2,4-dione) complexes, for which
stability of different spin electronic configurations was also examined. A high similarity
ral envelopes for M(Meacac)3 and M(acac)3 confirms that the metal
core is predominantly responsible for the observed spectral features (note also high
resemblance of experimental ECD spectra of 1-2 / 3-4 and the parent Ru(acac)
es); in some cases the alkyl substituents of acac ligands appear however to slightly
affect energetic position and intensity of calculated bands.
Molecular structure of M(Meacac)3 complex in its Λ configuration
-state details for particular species considered.
13 To obtain insight into electronic structure and spectroscopic features of the experimentally
Sham density functional theory (KS DFT) geometry
dependent KS (TDKS, TDDFT) response calculations were
methylpentane-2,4-son, some computations were also carried out for the
dione) complexes, for which
stability of different spin electronic configurations was also examined. A high similarity
confirms that the
metal-core is predominantly responsible for the observed spectral features (note also high
and the parent Ru(acac)3 / Cr(acac)3
es); in some cases the alkyl substituents of acac ligands appear however to slightly
configuration studied as a
14 All calculations were performed with Turbomole 6.6 package,41-43 without imposing
molecular symmetry. DFT geometry optimizations employed the B3LYP44-46
exchange-correlation functional in its default Turbomole parameterization. TDDFT linear response
electronic circular dichroism (ECD) calculations utilized the generalized gradient
approximation (GGA) Becke88-Perdew86 (BP)47-49 functional along with two commonly
used GGA hybrids B3LYP and PBE0.50 In all these computations the polarized triple-ζ
valence basis set TZVP51 was employed for all the atoms. Scalar relativistic effects were
treated implicitly by the use of a 60-electron relativistic effective core potential (ECP) in the
case of Ru,52 and neglected for Cr and Co. Solvent effects for dichloromethane (DCM, ε =
8.9) and 1,2-dichloroethane (DCE, ε = 10.66) were included in the calculations via the
conductor-like screening model (COSMO) as implemented in Turbomole.53-55
The simulated spectra shown are the sums of Gaussian functions centered at the vertical
excitation energies and scaled using the calculated rotatory strengths, with a global σ
parameter of 0.18 eV applied for the root mean square width.56 The benchmark ECD
calculations whose results are presented in the top panels of Figures S7a-c in the SI covered
the 175 (TDDFT BP) and 100 (TDDFT B3LYP and PBE0) lowest allowed excited states for
each system. For the analyzed B3LYP DCE spectra of the Λ-M(Meacac)3 complexes the
lowest number of excitations calculated extends at least 1 eV beyond the upper frequency
cutoff of the experimental spectra to avoid truncation errors in the simulated broadened ECD
intensity.
Results and discussion
Synthesis and characterization
The ligands Buacac and Oacac (Figure 2) were readily prepared with an approximate yield
of 50% by a 72-hours refluxing reaction of the corresponding 1-alkyliodide with sodium
15 literature for the synthesis of 3-decylpentane-2,4-dione.57An increase of the reaction time did
not improve the yield. Direct alkylation of acetylacetone with the corresponding
1-alkyliodide in the presence of potassium carbonate also led to the target ligands but the yield
was significantly smaller (15%).
The two chromium complexes Cr(Buacac)3 (3) and Cr(Oacac)3 (4) were prepared by the
procedure described by Anzai et al.6-7 The yield was 18% and 25% for 3 and 4, respectively.
The ruthenium systems 1 and 2 were synthesized with a 32% and a 26% yield following a
pathway similar to that employed to analogous Cr compounds.6-7 Ruthenium(III) chloride
hydrate and the acac-based ligand were heated in the presence of urea under argon
atmosphere for 24 hours in a methanol / water mixture of solvents. Neither shorter nor longer
time of the reaction improved the yield. The procedure was also examined without argon
atmosphere but a blue side-product was obtained together with the complexes 1 and 2.
The synthesis pathway analogous to that employed in the case of 1-4 did not lead to 5.
Consequently, an alternative procedure was adapted from the literature to prepare this
compound with a 13% yield.40 A solution of sodium hexanitritocobaltate(III) in water was
treated at room temperature with Buacac, previously deprotonated with NaOH. Note that the
complex 5 revealed very low chemical stability. Furthermore, despite efforts made, this
procedure did not give the Co(III)-Oacac derivative, resulting in a yellowish product instead.
The ligands and corresponding metal complexes were then fully characterized. The 1H-, 13
C-, and the 2D-NMR ((1H-1H) COSY, (1H-13C) HSQC, and (1H-13C) HMBC) were
measured either in CDCl3 or CD2Cl2 solution (see Figures S2a-S2m and S3a-S3m in the SI).
The numbering scheme employed in the 1H-NMR assignment is shown in Figure 2. The
Buacac and Oacac can exist in solution in the enol and keto forms, which is evidenced by the
simultaneous presence of a signal due to the OH group (position [6]) of the enol tautomer at
16 tautomer in their 1H-NMR spectra. The 1H-NMR spectra of both ligands reveal a similar
pattern, consistent with the presence of the diketone as the major form (> 70%) as evaluated
from the intensity ratios of the peaks. We have been able to assign all 1H-NMR signals to
particular 1H nuclei of Buacac and Oacac (Table 2, Figures S2c and S2i in the SI) and their
positions remain in an agreement with the bibliographic values.6,8,40 In the case of the 13
C-NMR spectra, all the C nuclei for both ligands have also been assigned (Figures S2f and S2l,
SI).
The NMR data of the cobalt(III) system 5 were straightforwardly interpreted because of the
diamagnetic nature of the complex that gives simple spectra (Table 2 and Figures S3a-S3g in
the SI). In this case, no keto-enol equilibrium is possible due to the deprotonation of the
ligand in the complex and the observed chemical shifts are comparable to those of the free
Buacac ligand showing for example the protons of the position [2] at 1.35-1.37, [3] at 2.30,
and [5] at 2.19 ppm. The corresponding Buacac 1H-NMR shifts are respectively 1.14-1.40,
2.20 and 2.11 ppm (enol form). In the case of the paramagnetic (S = ½, doublet)
ruthenium(III) complexes 1 and 2 a noticeable displacement and broadening of the 1H-NMR
peaks was however observed, especially significant for the H nuclei close to the metal center,
in line with what has been observed before in similar paramagnetic compounds,58-63 and
indicating non-innocent behavior of the ligand. Thus, for example, the protons of the position
[3] are shifted to ca. 29 ppm, and the peak corresponding to the methyl group in the position
[5] appears at -9.85 ppm for 1 and at -9.80 ppm for 2 (Table 2 and Figures S3h-S3i in the SI)
agreeing reasonably well with available calculated data for Ru(acac)3.62-63 Moreover, some of
the protons that are equivalent for the ligands become inequivalent for 1 and 2. For example,
the multiplet observed for the H nuclei in the position [2] at 1.14-1.40 ppm (4H) for Buacac
and 1.25 ppm (12H) for Oacac becomes a set of three singlets at 1.82 (2H), 0.14 (1H) and
17 and -1.15 (1H) ppm for 2. Similarly, the aforementioned two protons of the CH2 peak in the
position [3] become inequivalent giving rise to two singlets at 29.48 (1H) and 28.93 (1H)
ppm for 1 and at 29.29 (1H) and 28.99 (1H) for 2. Finally, although NMR spectra of
high-spin (S = 3/2, quartet) Cr(acac)3 complex have been assigned,61 the ones for the
corresponding acac derivatives Cr(III) systems 3 and 4 were found to be too broad to be
reliably interpreted.
Table 2. 1H-NMR chemical shifts (in ppm) measured in CD2Cl2 solution for the Buacac and Oacac ligands and the corresponding Ru(III) and Co(III) complexes.a
1
H
Buacac Oacac Ru(Buacac)3
1
Ru(Oacac)3
2
Co(Buacac)3
5 keto form enol form keto form enol form
[1] 0.88 (t, 3H) 0.93 (t, 3H) 0.86 (t, 3H) 0.87 (t, 3H) 1.75 (s, 3H) 0.91 (s, 3H) 0.93 (t, 3H) [2] 1.14-1.40 (m, 4H) 1.25 (m, 12H) 1.82 (s, 2H) -0.14 (s, 1H) -1.10 (s, 1H) 1.84 (s, 2H) 1.72 (s, 2H) 1.34 (s, 6H) -0.29 (s, 1H) -1.15 (s, 1H) 1.35-1.37 (m, 4H) [3] 1.76-1.83 (m, 2H) 2.20 (m, 2H) 1.74-1.81 (m, 2H) 2.16-2.21 (m, 2H) 29.48 (s, 1H) 28.93 (s, 1H) 29.29 (s, 1H) 28.99 (s, 1H) 2.30 (t, 2H) [4] 3.60 (t, 1H) 3.58 (t, 1H) [5] 2.14 (s, 6H) 2.11 (s, 6H) 2.13 (s, 6H) 2.10 (s, 6H) -9.85(s, 6H) -9.80 (s, 6H) 2.19 (s, 6H) [6] 16.69 (s, 1H) 16.69 (s, 1H) a
The atoms numbering is depicted in Figure 2. See also Figures S2a-S2m and S3a-S3m in
18 The IR spectra of the complexes 1-5 in KBr (Figures S4a-S4e, SI) exhibit up to four
different
ν
(C–H) aliphatic peaks in the range of 2960-2848 cm-1. Furthermore, they present abroad band ascribed to the
ν
(C=O) andν
(C=C) modes of the coordinated β-diketonate ligandat ca. 1540 cm-1 for 1 and 2 and at ca. 1565 cm-1 for 3-5.
Electrochemistry
Electrochemical studies via cyclic voltammetry (CV) measurements were performed on the
solutions of 1-5 in dichloromethane (DCM) at room temperature (r.t.) using
tetrabutylammonium hexafluorophosphate (TBAPF6, 0.1 M) as supporting electrolyte. The
cyclic voltammogram of 2, very close to 1, presented in Figure 4 and Figure S6a in the SI,
revealed the presence of one chemically and electrochemically quasi-reversible reduction
(∆Ep = 170 mV) at E° = -1.10 V vs the saturated calomel electrode (SCE), or -1.56 V vs
Fc/Fc+,64 and one chemically and electrochemically reversible oxidation (∆Ep = 70 mV) at
E1° = +0.72 V (see Table 3), or +0.26 V vs Fc/Fc+. These two waves correspond to
one-electron redox processes. It is noteworthy that the redox processes of 2 take place at similar
potentials as for Ru(acac)3.65 For 3, 4 and 5, only one wave has been observed in the available
window with DCM in our experimental setup, i.e. between -2 and +2 V (see Figures S6b to
S6d in the SI and Table 3). In both cases, the single wave corresponds to a chemically and
electrochemically reversible oxidation process. We note in passing that for Cr(acac)3 a
chemically and electrochemically irreversible CrIII/CrIV oxidation has been also recently
19
Figure 4. Cyclic voltammogram of 2 (DCM, 0.1 M TBAPF6, r.t.) vs SCE at a scan rate of 0.1 V/s.
Table 3. Electrochemical data of complexes 1-5.a
System E1/2 (∆Ep) [V] MII/MIII E1/2 (∆Ep) [V] MIII/MIV 1 2 3 4 5 -1.11 (0.17) -1.10 (0.17) - - - 0.70 (0.09) 0.72 (0.07) 1.18 (0.11) 1.19 (0.08) 1.29 (0.07) a
Measurements in DCM, 0.1 M TBAPF6 at r.t. Potentials vs SCE, 0.1 V/s. -6,00E-07 -4,00E-07 -2,00E-07 0,00E+00 2,00E-07 4,00E-07 6,00E-07 -1,5 -1 -0,5 0 0,5 1
Ru(Oacac)
3E / V
i
/
A
X-ray studies
Figure 5. Crystal structure
probability.
of 1 (top) and 5 (bottom) with thermal ellipsoids at
20 (bottom) with thermal ellipsoids at 50%
21 Crystals of 1 and 5 suitable for single crystal X-ray diffraction were obtained by slow
evaporation of a concentrated solution in hexane and a mixture of
cyclohexane/dichloromethane (50/50), respectively. The same procedure was attempted for
2-4 using hexane and other organic solvents, however unsuccessfully. Crystal structure and
refinement data for 1 and 5 are given in Table 1 and selected bond distances and angles are
listed in Tables S5a-S5d in the SI. The representative views are shown in Figure 5. Both 1
and 5 crystallize in the P-1 space group. The metal center is coordinated to six oxygen atoms
of three chelate Buacac ligands in an octahedral arrangement. The Ru-O distances for 1 are in
the range of 1.978(1)-2.013(2) Å, consistently with values reported in the literature for the
same type of compounds.27,60,67 Similarly, the Co-O distances for 5 are in the range of
1.870(2)-1.882(2) Å in good agreement with values reported in the literature for similar
compounds.40,68 For both compounds, unusual atomic displacement parameters were
observed on one of the butyl chains of the Buacac ligand. When looking at the packing of the
molecules within the crystal, it appears that a large void is accessible to this chain, leading to
larger vibration of the chain, thus explaining the large anisotropic displacement parameters
observed. The two other butyl chains of the molecule do not show such degree of freedom
due to the presence of intermolecular short contacts or hydrogen bonds with neighboring
atoms, as shown in Figures S5e and S5f in the SI.
Electronic circular dichroism (ECD) measurements
The chiroptical properties, especially electronic and vibrational circular dichroism, of
tris-(β-diketonato) transition metal complexes of general formula M(acac)3 with M including Ru,
Co, Cr, Ir have been extensively studied since they represent a class of chiral D3-symmetric
systems with a rigid helical structure and
∆
/Λ
stereoisomerism, enabling unambiguous22 The ECD spectra of
∆
-Λ
enantiomeric pairs of 1-5 were thus measured in DCM atconcentrations between 1-3·10-3 M. The resulting mirror-image spectra of
∆
-/Λ
-1-5 aredisplayed in Figure 6. As it can be seen, the Ru(III) complexes Ru(Buacac)3 (1) and
Ru(Oacac)3 (2) display very similar ECD envelopes that closely resemble that of Ru(acac)3
previously reported by Sato et al.33 Such similarity can also be observed for Cr(III) systems
3, 4 and Cr(acac)3.33 This indicates that the metal-(acac)3 core is predominantly responsible for the observed spectral features. Utilizing the observed resemblance of ECD for Ru and Cr
complexes studied here and for Ru(acac)3 and Cr(acac)3 of established absolute
configuration, the
∆
/Λ
AC can be assigned to 1 and 2 having positive / negative ECDabsorption bands at 280 and 450 nm, and to 3 and 4 having a positive / negative ECD
intensity at 300 nm. Likewise, a comparison of the ECD spectrum of Co(III) complex 5 with
the ones of Co(acac)3 enantiomers reported in the literature33 enabled to assign the
∆
configuration for complex 5 having a negative CD absorption band at 280 nm (see Figure 6).
The ECD spectra of M(Meacac)3 (M = Ru, Cr, Co) complexes as 1-5 models were then
calculated with time-dependent DFT (TDDFT) supporting the aforementioned AC
23
Figure 6. Experimental ECD spectra of
∆
-/Λ
-1,∆
-/Λ
-2,∆
-/Λ
-3,∆
-/Λ
-4, and∆
-/Λ
-5 enantiomeric pairs in DCM.Spectroelectrochemical behavior and redox chiroptical switching
We then investigated the capacity of these novel tris(β-diketonato) Ru(III), Cr(III), and
Co(III) complexes to act as redox-triggered chiral switches. Chiroptical switches are
multifunctional materials that may be useful for a variety of applications such as in molecular
electronics, optical displays, or for telecommunication purposes.70-74 Accordingly, in this
section, we report on the spectroelectrochemical behavior of 1-5 complexes with 2 and 4
chosen as representatives of Ru- and Cr-based systems due to their larger mass quantity
available and / or higher stability. The experimental results presented have been analyzed and
rationalized with the help of time-dependent DFT (TDDFT) response calculations for a series
-60 -40 -20 0 20 40 60 250 300 350 400 450 500 550 600 λ / nm ∆ ε / M -1 c m -1 ∆-1 Λ-1 -40 -30 -20 -10 0 10 20 30 40 250 300 350 400 450 500 550 600 λ / nm ∆ ε / M -1 c m -1 ∆-2 Λ-2 -60 -40 -20 0 20 40 60 250 300 350 400 450 500 550 600 650 λ / nm ∆ ε / M -1 c m -1 -40 -20 0 20 40 60 250 300 350 400 450 500 550 600 650 λ / nm ∆ ε / M -1 c m -1 ∆-3 Λ-3 ∆-4 Λ-4 -150 -100 -50 0 50 100 150 230 330 430 530 630 ∆ ε / M -1 c m -1 λ / nm ∆-5 O O O O O O Co n-Bu n-Bu n-Bu Λ-5
24 of
Λ
-M(Meacac)3 (M = Ru, Cr, Co; Meacac = 3-methylpentane-2,4-dione) species usingB3LYP/TZVP with continuum solvent model for DCM at structures optimized at the same
level of theory (see the SI for a full set of calculated data).75-78,79
The one-electron oxidation and reduction of 2 into 2Ox (RuIII/RuIV) and 2Red (RuIII/RuII),
respectively, were monitored by UV-vis/NIR spectroscopy in a transparent thin-layer
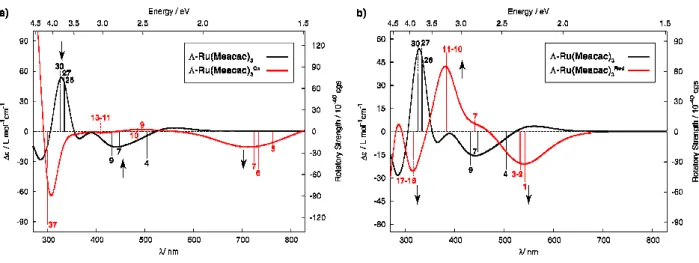
electrochemical (OTTLE) cell. As presented in Figure 7a, the one-electron oxidation of 2 at
1.2 V vs Fc/Fc+ revealed a slight decrease in intensity of the UV-vis band at 375 nm and the
appearance of a broad low-energy absorption band centered at ~750 nm, while the bands at
270 and 550 nm remained unchanged. Upon one-electron reduction of 2 at -1.5 V vs Fc/Fc+
(Figure 7b), again a slight decrease in the absorption band at 375 nm was observed with a
negligible change of high-energy band (270 nm). Furthermore, the intensity of the band at
550 nm significantly increased. For both redox processes, 2 → 2Ox and 2 → 2Red, full
25
Figure 7. Electrochemical evolution of the experimental UV-vis/NIR spectra of Ru complex 2 upon oxidation (a) and reduction (b). Experimental ECD spectra of enantiopure
Λ
-2 and of its oxidizedΛ
-2Ox (c) and reducedΛ
-2Red (d) species. Insets: Reversible ECD500 nm (e) andECD460 nm (f) switching processes.
Having established that 2 undergoes reversible oxidation and reduction processes, the next
step towards electrochemical chiroptical switches was to investigate whether these redox
processes impact its chiroptical properties. As seen in Figure 7c, one-electron oxidation
Λ
-2→
Λ
-2Ox indeed leads to strong modifications of the ECD spectrum in dichloroethane (DCE,0.2 M TBAPF6). Namely, i) the negative ECD-active band at 280 nm (
∆ε
= -36 M-1 cm-1)disappeared and a slight positive intensity appeared at 290 nm (+4 M-1 cm-1), ii) the
positive-positive intensity pattern at 330 (+6) and 367 nm (+20 M-1 cm-1) was transformed to a
blue-a) b) c) d) e) f) 2 2Ox 2 2Red Λ-2 Λ-2Ox Λ-2 Λ-2Red
26 shifted negative-positive one at 315 (-22) and 350 nm (+9 M-1 cm-1), iii) the negative band at
460 nm (-20 M-1 cm-1) was blue-shifted to 432 with simultaneous decrease in its intensity
(-12), and iv) a new broad negative ECD-active band (ranging from 570 to 850 nm with
∆ε
=-9M-1 cm-1 at 680 nm) was observed. Exploiting these differences, along with the reversibility
of the oxidation process, allows us to obtain an electrochemical chiral switch. Indeed,
stepping potentials between 0 and +1.2 V of a DCE solution of
Λ
-2 in an electrochemical cellleads to a reversible modulation of the ECD signals at 500 nm (Figure 7e) with more than 12
successive oxidation / reduction steps performed.
Similarly, upon one-electron reduction
Λ
-2 →Λ
-2Red, the ECD spectrum (DCE, 0.2 MTBAPF6) was strongly modified (Figure 7d). Indeed, i) the negative ECD-active band at 280
nm (
∆ε
= -36 M-1 cm-1) was split into two bands of enhanced negative (282 nm, -50 M-1 cm-1
) and positive intensity (305 nm, +31 M-1 cm-1), ii) the positive-positive intensity pattern at
330 (+6) and 367 nm (+20 M-1 cm-1) was converted to a negative-positive one at 320 (-6) and
383 nm (+12 M-1 cm-1), iii) the negative band at 460 nm (-20 M-1 cm-1) was replaced by a
broad positive intensity at 447 (+3) and 532 nm (+7 M-1 cm-1), and iv) a new broad negative
ECD-active band (ranging from 555 to 810 nm with
∆ε
= -20 M-1 cm-1 at 620 nm) appeared.Here again, exploiting the strong differences, along with the reversibility of the reduction
process, results in an electrochemical chiral switch. As shown in Figure 7f, stepping
potentials between -1.5 and 0 V of a DCE solution of
Λ
-2 in an electrochemical cell leads to areversible (more than 12 steps) modulation of the ECD signals at 460 nm. Remarkably, the
redox chiroptical switching of Ru(Oacac)3 complex can be performed both in oxidation and
in reduction, thus giving access to three different stable states.
To gain deeper insight into experimentally observed spectral features and their
modifications upon one-electron oxidation and reduction of 2, TDDFT UV-vis and ECD
reduced form. Theory reproduce
satisfactory manner (see Figure
them to the changes in the electron
processes.
Figure 8. Simulated (TDDFT B3LYP/TZVP, DCE continuum solvent model) ECD spectra
of Λ-Ru(Meacac)3 and its oxidized
(b). No spectral shift has been applied. Calculated excitation energies and rotatory strengths
indicated as ‘stick’ spectra. Numbered excitations correspond to those analyzed in detail (see
SI for a full assignment). Arrows indicate changes in the spe
reduced form. Theory reproduces the general experimental trends for 2,
satisfactory manner (see Figure 8 and Figure S7d in the SI) and therefore
them to the changes in the electronic structure of the complex occurring upon
Simulated (TDDFT B3LYP/TZVP, DCE continuum solvent model) ECD spectra
and its oxidized Λ-Ru(Meacac)3Ox (a) and reduced form
shift has been applied. Calculated excitation energies and rotatory strengths
indicated as ‘stick’ spectra. Numbered excitations correspond to those analyzed in detail (see
Arrows indicate changes in the spectrum due to the redox
27 , 2Ox, and 2Red in a
therefore enables us to link
ic structure of the complex occurring upon the redox
Simulated (TDDFT B3LYP/TZVP, DCE continuum solvent model) ECD spectra
a) and reduced form Λ-Ru(Meacac)3Red
shift has been applied. Calculated excitation energies and rotatory strengths
indicated as ‘stick’ spectra. Numbered excitations correspond to those analyzed in detail (see
28
Figure 9. (Left): B3LYP/TZVP MO energy levels (separately for α-spin (spin up) and β-spin (spin down) orbitals) for Ru(Meacac)3. (Right): Isosurfaces (0.05 au) of selected frontier
MOs. In parentheses the corresponding orbital energies ε, in eV, are listed. In the right top
corner, the isosurface (0.003 au) of the electron spin density ∆
ρ
is shown.The orbital energies and isosurfaces of frontier molecular orbitals (MOs) computed for the
neutral Ru(III)(Meacac)3 species are presented in Figure 9 and Figures S7j in the SI. The
system adopts a low-spin d5 configuration in line with a strong ligand-field splitting typically
observed for 4d complexes. The five highest-energy occupied MOs (98-100α and 98-99β)
may be classified as metal-ligand out-of-phase combinations of Ru dπ (formally t2g metal d
orbitals of local π symmetry with respect to the metal-oxygen bonds, i.e. dxy, dyz, dxz) with
Meacac π orbitals, in the following referred to as dπ due to the dominant metal character. In
crystal field theory, these would be the occupied non-bonding metal 4d orbitals; in the DFT
calculations there are corresponding in-phase combinations at lower energy, dominantly
ligand-centered. The metal-ligand mixing is especially pronounced for the (unpaired) singly
occupied MO (SOMO, 99α), whose opposite-spin partner orbital (100β) is the lowest-energy
unoccupied MO representing an ‘electron hole’ in the β-spin density. Note that the
numbering is based on the orbital energy, low to high. 99α and 100α are nearly degenerate.
The visual comparison of the isosurface plots establishes the pairs of equivalent MOs in the
α- and β-spin MO sets. The term ‘SOMO’ means that there is no matching occupied orbital
in the opposite spin MO set. The metal-ligand orbital mixing reflects dative Ru-Meacac
bonding of both Meacac → Ru σ-and π-donation (vide infra) and Ru → Meacac
π-back-donation. As expected, the calculated plot of the electron spin density resembles the density
of the SOMO α-spin dπ and clearly shows that the unpaired charge density is not only
See also Figure S7u in the SI. This
(mostly from oxygen π-lone-pairs) into the empty
Figure 10. (Left): B3LYP/TZVP MO energy levels (separately for
spin (spin down) orbitals) for Ru(Meacac)
frontier MOs. In parentheses the corresponding
right top corner, the isosurface
Oxidation of the neutral Ru(III)(Meacac)
triplet d4 electronic configuration and two unoccupied
Accordingly, there are two α
picture is generally the same for Ru(Meacac)
the SI), a high energetic stabilization of metal
case of β-spin ‘electron hole’
based metal-ligand antibonding combinations in Ru(Meacac)
can be considered as consequences of the metal
S7u in the SI. This confirms a slight donation of the ligand
pairs) into the empty β-spin Ru dπ.
(Left): B3LYP/TZVP MO energy levels (separately for α-spin (spin up) and
spin (spin down) orbitals) for Ru(Meacac)3Ox. (Right): Isosurfaces (0.05 au) of selected
frontier MOs. In parentheses the corresponding orbital energies ε, in eV, are listed. In the
isosurface (0.003 au) of the electron spin density ∆
ρ
is shown.Ru(III)(Meacac)3 yields cationic Ru(IV)(Meacac)
electronic configuration and two unoccupied β-spin Ru dπ orbitals (99
α-spin SOMOs (99-100α, see Figure 10). Although the
ly the same for Ru(Meacac)3 and Ru(Meacac)3Ox (see also
the SI), a high energetic stabilization of metal-centered orbitals (especially pronounced in the
spin ‘electron hole’ dπ MOs) and a decrease in the metal character of occupied
ligand antibonding combinations in Ru(Meacac)3Ox can be noted. These changes
can be considered as consequences of the metal-centered oxidation that leads to a decrease in
29 a slight donation of the ligand β-spin π-density
spin (spin up) and
β-. (Right): Isosurfaces (0β-.05 au) of selected
, in eV, are listed. In the
is shown.
yields cationic Ru(IV)(Meacac)3Ox with a
spin-orbitals (99-100β).
). Although the orbital
(see also Figures S7k in
centered orbitals (especially pronounced in the
MOs) and a decrease in the metal character of occupied dπ
-can be noted. These changes
30 the electron repulsion within the d shell and to an increase in the β-spin π-acceptor ability of
the Ru ion. The latter is nicely illustrated by the plot of electron spin density. The β-spin
π-donation from Meacac to the empty β-spin Ru(IV) dπ, enhanced by the oxidation, results in
the more pronounced excess of α-spin π-density in the ligand (see also Figure S7u in the SI).
On the contrary, reduction of the neutral Ru(III)(Meacac)3 to the anionic Ru(II)(Meacac)3Red
gives a closed-shell d6 configuration (see Figures S7v and S7l in the SI), a pronounced
destabilization of the occupied dπ-based MOs, and an increase in their non-bonding character
due to the elimination of the Meacac → Ru(II) π-donation channel.
The analysis of selected dominant excitations of Λ-Ru(Meacac)3, Λ-Ru(Meacac)3Ox, and
Λ-Ru(Meacac)3Red in terms of individual MO pairs (see the SI for the full set of data) shows
that the aforementioned differences in the electronic structure of these species are reflected in
the corresponding electronic spectra. For example, the new broad negative ECD band
appearing around 700 nm upon oxidation of the Ru(III) complex is assigned as
predominantly π-π* ligand-to-metal charge-transfer (LM CT) from the β-occupied
metal-ligand bonding MOs to the dπ β-‘electron holes’ (excitations nos. 5-7, Figure 8a). An
excitation with an analogous assignment can also be found for Ru(Meacac)3 but it is strongly
blue-shifted (no. 4, 505 nm) compared to Ru(Meacac)3Ox in line with the destabilization of
the unoccupied β-spin dπ. The decrease in the intensity of the negative ECD band at ca. 450
nm and modifications of the positive band around 350 nm observed experimentally upon
oxidation of 2 can be traced back mainly to changes in the character of the frontier MOs
rather than new transitions. As far as the one-electron reduction of 2 is concerned, the
differences in the spectra of 2 vs. 2Red can be linked, with the help of the calculations, to 1)
absence of contributions involving β-‘electron hole’ dπ orbitals, 2) the Ru dπ orbitals
31 increased electron repulsion in the d shell. In combination, these changes enable low-energy
ML CT transitions (e.g. excitations nos. 1-3, Figure 8b).
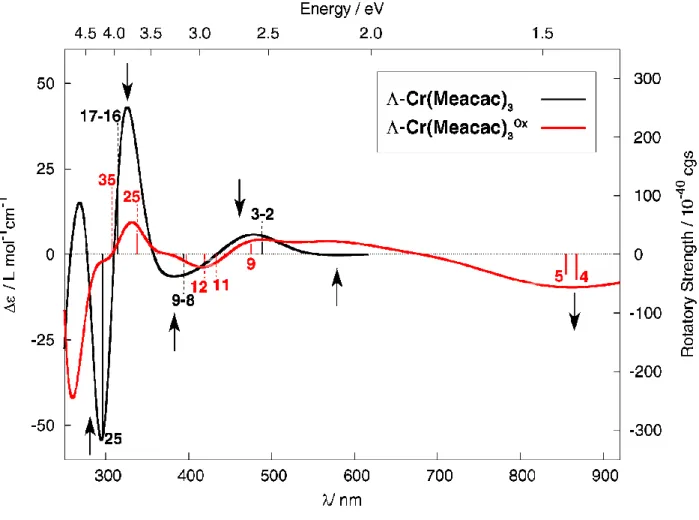
The one-electron oxidation of 4 into 4Ox (CrIII/CrIV) was also followed by UV-vis/NIR
spectroscopy in an OTTLE cell (DCE, 0.2 M TBAPF6, at 1.5 V vs Fc/Fc+). The
measurements showed a slight decrease in intensity of the high-energy bands at 271 and 356
nm and the appearance of three new broad absorption bands centered at around 475, 805, and
1100 nm (see Figure 11a). As for Ru complex 2, full reversibility was observed upon several
oxidation / reduction cycles. The
Λ
-4 →Λ
-4Ox redox process was then examined by ECDspectroscopy. As shown in Figure 11b, the ECD spectra of
Λ
-4 andΛ
-4Ox in DCE revealedgenerally the same spectral envelopes. However, upon oxidation all ECD-active bands
underwent a strong decrease in intensity, and a new broad negative ECD-active band centered
at ~ 850 nm (
∆ε
= -10 M-1 cm-1) appeared. Stepping potentials between 0 and +1.5 V of aDCE solution of
Λ
-4 in an OTTLE cell leads to a reversible modulation of the ECD signals at840 nm (Figure 11c) with more than 12 successive oxidation / reduction steps performed
which confirms electrochemical chiroptical switching of 4.
a) b) c) 4 4Ox Λ -4 Λ-4Ox 840 nm
32
Figure 11. (a) Electrochemical evolution of the experimental UV-vis/NIR spectra of Cr
complex 4 upon oxidation. (b) Experimental ECD spectra of enantiopure
Λ
-4 and of itsoxidized
Λ
-4Ox species. Inset (c): Reversible ECD840 nm switching process.In the calculations, the model Cr(Meacac)3 complex adopts a spin-quartet d3 electronic
configuration with three unpaired α-spin SOMOs that represent metal-ligand out-of-phase
combinations of predominantly Cr dπ with Meacac π orbitals. The three corresponding empty
β-spin MOs display metal-ligand π-character. Accordingly, the calculated electron spin
density resembles a sum of the densities of the three SOMOs, resulting in an isosurface with
a cubic shape (see Figures S7w1 and S7u in the SI). With three β-spin ‘electron holes’ one
might expect pronounced β-spin Meacac → metal π-donation. Interestingly, there is no
indication that such a mechanism takes place to any significant degree in Cr(Meacac)3. An
intuitive explanation is that a ligand-to-metal β-spin density donation would disrupt a
half-filled dπ shell configuration at the metal center. This is consistent with the small metal d
contributions in the oxygen π-lone-pairs calculated previously for the parent Cr(acac)3
complex.63 Oxidation of the neutral Cr(III) system leads to a cationic Cr(Meacac)3Ox species
with a spin-triplet d2 configuration with one of the metal dπ orbitals in the α-spin set now
being formally unoccupied (see Figures S7w2 and S7u in the SI). However, in the cationic
complex a pronounced α-spin Meacac → metal π-donation partially restores the half-filled dπ
shell at Cr. In turn, this donation leaves a sizable excess of β-spin density at the ligands, as
seen in the plot of the corresponding electron spin density. The corresponding unoccupied
α-spin MO representing the ‘electron hole’ has large contributions from the ligands (Figure
S7w2). As for Ru(Meacac)3Ox, an energetic stabilization of unoccupied α- and β-spin Cr dπ
The simulated UV-vis and ECD spectr
and Figure S7d in the SI) show overall similar
ones for 4 and 4Ox. The ECD spectrum for
TDDFT calculations, and therefore we forego a detailed discussion
ECD band observed around 850 nm upon oxidation of the Cr(III) system
from the α-occupied metal-ligand
oxidation (excitations nos. 4
observed in the remaining spectral regions
the character of the frontier MOs due to
Figure 12. Simulated (TDDFT B3LYP/TZVP, DCE continuum solvent model) ECD spectra
of Λ-Cr(Meacac)3 and its oxidized form
Calculated excitation energies and rotatory strengths indicated as ‘stick’ spectra. Numbered vis and ECD spectra of Λ-Cr(Meacac)3 and Λ-Cr(Meacac)
show overall similar features as the corresponding experimental
he ECD spectrum for Cr(acac)3 has been assigned in ref. 78 based on
TDDFT calculations, and therefore we forego a detailed discussion. The new broad negative
around 850 nm upon oxidation of the Cr(III) system involves
ligand-centered MOs to the dπ ‘α-electron hole’
(excitations nos. 4-5, Figure 12). The differences in the spectra of
observed in the remaining spectral regions can be primarily traced back to large changes in
the character of the frontier MOs due to the one-electron oxidation process.
Simulated (TDDFT B3LYP/TZVP, DCE continuum solvent model) ECD spectra
and its oxidized form Λ-Cr(Meacac)3Ox. No spectral shift has been applied.
Calculated excitation energies and rotatory strengths indicated as ‘stick’ spectra. Numbered
33 Cr(Meacac)3Ox (Figure 12
the corresponding experimental
has been assigned in ref. 78 based on
new broad negative
involves transitions
electron hole’ created upon
s in the spectra of 4 vs. 4Ox
can be primarily traced back to large changes in
electron oxidation process.
Simulated (TDDFT B3LYP/TZVP, DCE continuum solvent model) ECD spectra
. No spectral shift has been applied.
34 excitations correspond to those analyzed in detail (see SI for a full assignment). Arrows
indicate changes in the spectrum due to the redox process.
Finally, the electrochemical switching activity of the Co complex 5 was examined.
Unfortunately, in this case no efficient and reversible processes were observed due to the low
stability of the neutral complex which seems to decompose upon oxidation by ligand
decomplexation. The experimental findings may be rationalized by the calculated electronic
structure of the oxidized Co(IV)(Meacac)3 species. The neutral Co(III) complex has a
low-spin closed-shell d6 configuration (see Figure S7x1 in the SI). One-electron oxidation leads to
a doublet species, but with a ligand-centered spin density. This means that the oxidation does
not occur at the metal center, or, if the oxidation initially creates a Co(IV) complex with a
β-spin ‘electron hole’ at the metal, the acac ligand immediately donates β-β-spin density to the
metal, restoring a filled set of dπ orbitals at Co and leaving an excess of α-spin π-density in
the ligand system (Figures S7x2 and S7u, SI). The assignment of calculated ECD spectrum of
Co(Meacac)3 generally follows the one reported for Co(acac)377-78 and is therefore not
discussed here in detail. The interested reader is referred to the SI.
Conclusions
Five new chiral tris(β-diketonato) complexes of ruthenium(III), chromium(III), and
cobalt(III) have been synthesized and characterized by a varied set of techniques. They have
been optically resolved into pure enantiomers using preparative supercritical fluid
chromatography. ECD measurements have allowed the absolute configurations assignment.
Spectroelectrochemical UV-vis and ECD studies have demonstrated that Ru and Cr
35 first-principles calculations have reproduced experimentally observed spectral features of 1-5
and their modifications upon redox processes in a satisfactory manner. The analysis of the
results of the calculations shows that the changes in the electronic state of a given complex
explain the observed spectral changes upon oxidation and reduction, rather than structural
changes.
Acknowledgements
This work was supported by the COMOCHOL project within the “Emergence 2013” program
from ‘Projects Initiatives d’excellence idex UNITI’ under convention UT: 2014-590 and by
the CNRS (Chirafun network). The enantiopurification scale-up was carried out on Prep80Q
which is an equipment of the Institut de Chimie de Toulouse (ICT). The chiral analysis was
performed on UPC² (Waters) equipment which is a part of the Integrated Screening Platform
of Toulouse (PICT, IBISA). We acknowledge Dr. Michel Mitov for fruitful discussions on
liquid crystal physics. M.S.-H. is grateful for financial support from the Ministry of Science
and Higher Education in Poland (‘Outstanding Young Scientist’ scholarship and young
researchers’ T-subsidy). J.A. acknowledges the National Science Foundation (CHE 1560881
and 1265833) for financial support and the Center for Computational Research (CCR) at the
University at Buffalo for computational resources.
Supporting Information Available
X-ray crystallographic data for complexes 1 and 5 in CIF format. S1. Supercritical fluid
chromatography (SFC) files; S2. NMR spectra of the ligands; S3. NMR spectra of the
complexes; S4. Infrared spectra of the complexes; S5. Crystallographic data; S6. Cyclic
36
References
(1) Amouri, H., Gruselle, M. Chirality in Transition Metal Chemistry, Wiley-VCH, 2008. (2) Sierra, T. Chirality at the Nanoscale, Nanoparticles, Surfaces, Materials and more; Amabilino, D. (eds.), Wiley-VCH, 2009. 115-189.
(3) Drake, A. F., Gottarelli, G., Spada, G. P. The twisting power of some chiral tris-(pentane-2,4-dionato)metal(III) complexes in nematic liquid-crystals. Chem. Phys. Lett. 1984,
110, 630-633.
(4) Hoshino, N., Matsuoka, Y., Okamoto, K., Yamagishi, A. Delta- Ru(acac)(2)L (L = a mesogenic derivative of bpy) as a novel chiral dopant for nematic liquid crystals with large helical twisting power. J. Amer. Chem. Soc. 2003, 125, 1718-1719.
(5) Yoshida, J., Watanabe, G., Kakizawa, K., Kawabata, Y., Yuge, H. Tris(beta-diketonato) Ru(III) Complexes as Chiral Dopants for Nematic Liquid Crystals: the Effect of the Molecular Structure on the Helical Twisting Power. Inorg. Chem. 2013, 52, 11042-11050. (6) Anzai, N., Kurihara, H., Sone, M., Furukawa, H., Watanabe, T., Horie, K., Kumar, S. Light-induced formation of curved needle texture by circularly polarized light irradiation on a discotic liquid crystal containing a racemic chromium complex. Liquid Crystals 2006, 33, 671-679.
(7) Anzai, N., Machida, S., Horie, K. Chirooptical control of liquid crystalline textures containing chromium complex by irradiation of circular polarized light. Chem. Lett. 2001, 888-889.
(8) Anzai, N., Machida, S., Horie, K. Light-induced control of textures and cholesteric pitch in liquid crystals containing chromium complexes, by means of circular and linear polarized light. Liquid Crystals 2003, 30, 359-366.
(9) Sato, H., Yamagishi, A. Application of Delta- and Lambda-Isomerism of Octahedral Metal Complexes for Inducing Chiral Nematic Phases. Int. J. Mol. Sci. 2009, 10, 4559-4574. (10) Sato, H., Yamagishi, A. Application of the Delta Lambda isomerism of octahedral metal complexes as a chiral source in photochemistry. J. Photochem. Photobiol. C:
Photochem. Rev. 2007, 8, 67-84.
(11) Sato, H., Sato, F., Yamagishi, A. Rewritable optical memory in liquid crystals containing photo-epimerizing Cr(III) complexes. Chem. Comm. 2013, 49, 4773-4775.
(12) Mitov, M. Cholesteric Liquid Crystals with a Broad Light Reflection Band. Adv.
Mater. 2012, 24, 6260-6276.
(13) Das, A., Ghosh, P., Plebst, S., Schwederski, B., Mobin, S. M., Kaim, W., Lahiri, G. K. Ancillary Ligand Control of Electronic Structure in o-Benzoquinonediimine-Ruthenium Complex Redox Series: Structures, Electron Paramagnetic Resonance (EPR), and Ultraviolet-Visible-Near-Infrared (UV-vis-NIR) Spectroelectrochemistry. Inorg. Chem. 2015, 54, 3376-3386.
(14) Das, D., Sarkar, B., Kumbhakar, D., Mondal, T. K., Mobin, S. M., Fiedler, J., Urbanos, F. A., Jimenez-Aparicio, R., Kaim, W., Lahiri, G. K. Bis(acetylacetonato)ruthenium Complexes of Noninnocent 1,2-Dioxolene Ligands: Qualitatively Different Bonding in Relation to Monoimino and Diimino Analogues. Chem. Eur. J. 2011, 17, 11030-11040. (15) Grupp, A., Bubrin, M., Ehret, F., Zeng, Q., Hartl, F., Kvapilova, H., Zalis, S., Kaim, W. Ru-II(alpha-diimine) or Ru-III(alpha-diimine(center dot-))? Structural, Spectroscopic, and Theoretical Evidence for the Stabilization of a Prominent Metal-to-Ligand Charge-Transfer Excited-State Configuration in the Ground State. Eur. J. Inorg. Chem. 2014, 2014, 110-119. (16) Mandal, A., Grupp, A., Schwederski, B., Kaim, W., Lahiri, G. K. Varying Electronic Structures of Diosmium Complexes from Noninnocently Behaving Anthraquinone-Derived Bis-chelate Ligands. Inorg. Chem. 2015, 54, 7936-7944.