HAL Id: hal-03186803
https://hal.uca.fr/hal-03186803
Preprint submitted on 31 Mar 2021
HAL is a multi-disciplinary open access archive for the deposit and dissemination of sci-entific research documents, whether they are pub-lished or not. The documents may come from teaching and research institutions in France or abroad, or from public or private research centers.
L’archive ouverte pluridisciplinaire HAL, est destinée au dépôt et à la diffusion de documents scientifiques de niveau recherche, publiés ou non, émanant des établissements d’enseignement et de recherche français ou étrangers, des laboratoires publics ou privés.
M Goujon, Hajare El Hadri, Raphael Paris
To cite this version:
M Goujon, Hajare El Hadri, Raphael Paris. A database of the economic impacts of historical volcanic eruptions. 2021. �hal-03186803�
SÉRIE ÉTUDES ET DOCUMENTS
A database of the economic impacts of historical volcanic eruptions
Hajare El Hadri
Michaël Goujon
Raphaël Paris
Études et Documents n° 14
March 2021
To cite this document:
El Hadri H., Goujon M., Paris R. (2021) “A database of the economic impacts of historical volcanic eruptions ”, Études et Documents, n°14, CERDI.
CERDI POLE TERTIAIRE 26 AVENUE LÉON BLUM F-63000 CLERMONT FERRAND TEL.+33473177400 FAX +33473177428 http://cerdi.uca.fr/
2
The authors
Hajare El Hadri
Post-doctoral researcher, Université Clermont Auvergne, CNRS, CERDI, F‐63000 Clermont‐ Ferrand, France
Email address: hajare.el_hadri@uca.fr
Michaël Goujon
Associate professor, Université Clermont Auvergne, CNRS, CERDI, F‐63000 Clermont‐Ferrand, France
Email address: michael.goujon@uca.fr
Raphaël Paris
Researcher, Université Clermont Auvergne, CNRS, IRD, OPGC, Laboratoire Magmas et Volcans, F‐63000 Clermont‐Ferrand, France
Email address: raphael.paris@uca.fr
Corresponding authors: Michaël Goujon et Raphaël Paris
This work was supported by the program ‘‘Investissements d’Avenir’’ (16-IDEX-0001 CAP 20-25) operated by the French National Research Agency (ANR). Michaël Goujon gratefully acknowledges the support from the LABEX IDGM+ (ANR-10-LABX-14-01) and Raphaël Paris the support from the LABEX Clervolc (ANR-10-LABX-0006)
Études et Documents are available online at: https://cerdi.uca.fr/etudes-et-documents/
Director of Publication: Grégoire Rota-Graziosi Editor: Catherine Araujo-Bonjean
Publisher: Aurélie Goumy ISSN: 2114 - 7957
Disclaimer:
Études et Documents is a working papers series. Working Papers are not refereed, they constitute research
in progress. Responsibility for the contents and opinions expressed in the working papers rests solely with the authors. Comments and suggestions are welcome and should be addressed to the authors.
3
Abstract
History has shown that economic consequences of a volcanic eruption can be disastrous, and nowadays 800 million people in 86 different countries are living within 100 km of an active or a potentially active volcano. Eruptions can cause significant economic loss and damage directly (eruptive processes) or indirectly (associated non-eruptive processes like lahars, tsunamis, etc.), and through cascading effects (perturbations on transport, networks, etc.). Loss and damages can then be direct, indirect, tangible or intangible, short-term or long-term, also depending on the exposure and vulnerability of the economic activities. Existing database on historical eruptions do not provide, or too sparsely, information on these economic impacts. The aim of the project presented in this paper is to build a new database to increase our understanding in the field, to facilitate the identification of vulnerability and resilience factors to future events. We first selected a sample of 55 eruptions from 42 volcanoes located in 18 developing and developed countries, that occurred after the World War II. We documented a number of physical characteristics of these eruptions and volcanoes. Second, we identified the different damages and losses due to volcanic events through 37 qualitative and quantitative variables. We collected economic information and data on these variables, using a variety of sources (governmental and non-governmental agencies, academic institutions, volcanic observatories, press, etc.). This database will be accessible through a web interface and the community will be able to contribute to its development by recording information on the economic consequences of past and future events. A next step would consist in extrapolating the economic impacts for those historical eruptions with missing data and of those that are not included in our first sample.
Keywords
Database, Natural disaster, Economic damages, Volcanic eruptions, Information coverage
JEL Codes
A12, C82, Q54
Acknowledgments
The authors thank the participants to the December 2020 CERDI webinar for their useful comments on a first version of this work, while not being exhaustive, specifically Pascale Phelinas and Simone Bertoli. The associated web platform has been developed by Axel-Cleris Gailloty. Olivier Santoni took part in geographical data gathering and produced the maps. Although we paid the utmost importance to data quality and accuracy gathered in the database, for which we have informed data sources systematically, we cannot under any circumstances, guarantee the reliability of all data and be held liable for the use of the information provided through the database. The authors acknowledge the support received from the Agence Nationale de la Recherche of the French government through the program ‘‘Investissements d’Avenir’’ (16-IDEX-0001 CAP 20-25).
4
Introduction
The human toll is usually the most-cited statistic on the consequences of a natural disaster, both in the media and in scientific publications. Compared to this direct impact on people, the economic impact is harder to document (and to estimate) while the deadliest disasters are not necessarily the most detrimental ones to economic activities. In the existing statistics, the economic impact of a natural disaster is often reduced to an overall estimate of the direct cost with large uncertainties and inaccuracies.
According to the reinsurance company Munich Re’s estimates, floods, storms and tsunamis are particularly devastating, both humanely and economically (the direct costs are often higher than $10 billion per event, $210 billion for the 2011 Tohoku-oki earthquake and tsunami in Japan). In comparison, major volcanic eruptions of the last decades (1980-2010) have cost less than $1 billion each, with the exception of the 2011 Eyjafjallajökull eruption in Iceland (at least $1.7 billion) and the 1991-1993 Unzen eruption in Japan ($1.5 billion). However, this first-order comparison hides the fact that the economic impacts of volcanism are usually poorly documented and consequently probably under-estimated. Many eruptions are not very deadly
(<100 deaths)1, but significant damage can be caused on economic goods in densely populated
areas by direct (eruptive processes) or indirect hazards (non-eruptive processes linked to the activity of the volcano), and cascading effects (perturbations on transport, networks, etc.). According to Auker et al. (2013), volcanic risk affects about 800 million people living within 100 km of an active or potentially active volcano in 86 different countries. Since 1950, an average of 31 volcanoes have been in activity every year (Desai et al., 2015) and at any time at least 20 volcanoes are in eruption (Siebert et al., 2010).
A volcanic activity may be characterized by a wide range of physical processes, such as lava flow, pyroclastic flow (a hot mixture of gas and particles), ash fallout and ballistic projectiles (bombs), and the emission of toxic gases. In addition, other disasters like earthquake, tsunami or lahar (debris flow) may be associated with volcanic events (see Sigurdsson et al., 2015, for a detailed review on eruptive processes and volcanic hazards). The poor understanding of the human and economic impacts of an eruption is amplified by the fact that these impacts do not
1 Over the four last centuries, volcanism may have caused the deaths of 280,000 people, of which 163,000 are
due to the five most deadly eruptions, Unzen 1792, Tambora 1815, Krakatau 1883, Mount Pelée 1902, Nevado del Ruiz 1986 (Auker et al., 2013).
5
depend on the physical characteristics of the eruption only, but also on the exposition or vulnerability of the affected areas.
Existing databases on historical volcanism (GVP, NGDC, UNISDR, EMDAT...) do not include complete and relevant information on the economic impacts of eruptions. Moreover, there is no standard definition or methodology so far to estimate the economic impact of volcanic activity. Our aim is not only to put into perspective the different channels through which those disasters affect the economy, but also to create a new database to assess them. Therefore, this work is intended to fill the data gap, that would allow a better understanding of the economic impact of historical eruptions and a better prediction of the future ones. One of the final goals of the project is to produce estimates of the economic impact of eruptions in the World over the last decades, following an homogenous methodology. This requires gathering data on volcanoes, eruptions, the existing damage estimates, and the socio-economic characteristics of affected areas (in the short and long term). Ultimately, producing estimates of economic impacts requires exploring the statistical relationships between different types of data, from physical data on eruptions to socio-economic data.
The first stage of this work consisted in characterizing the existing situation by exploring the six best-known databases in the field, from the Smithsonian Institutional Global Volcanism Program, the National Geophysical Data Center, the EM-DAT, the Desinventar and from the reinsurance companies Swiss Re and Munich Re. While being key sources of information, none of them provide systematic information on economic damage, or even their primary sources of information.
Parallel to this work, we led a review of the literature with the aim to identify the various channels through which an eruption affects the economy. Volcanic risk differs from other natural disasters in terms of its space and time coverage and the diversity of its manifestations. This review allowed to define different criteria, both quantitative and qualitative, in order to capture the economic impact of volcanic activity.
We initiated a typology of existing methodologies for evaluating the impact of an eruption on the economy. Our perspective being to cover the evaluation of the overall economic impact of an eruption, at a macro or meso (subnational) level, we usually discard micro or community (household)-based techniques. While there exist a number of methodologies, all in all, very few studies are dedicated to volcanic risk, making their comparison and grouping quite difficult. The estimation of economic costs can be carried out ex ante on the basis of an eruptive scenario,
6
or after the disaster, both using observational and empirical data. Methodologies include damage matrices, vulnerability curves, vulnerability indicators, input-output tables, computable general equilibrium models or fieldworks..., Mobilizing these tools requires a significant amount of data, that are not available for a significant number of active volcanoes.
The third stage was devoted to the construction of our database that gathers both the physical characteristics of the eruptions and their economic consequences (damage or costs). In this first version of the database, we covered 55 post-WWII eruptions, from 42 volcanoes located in 18 developing and developed countries (see the list in Annex). These eruptions show a Volcanic Explosivity Index (VEI) equal to or higher than 5, but also of lower intensities (VEI between 1 and 4) but being representative of a particular eruptive style. An extensive review of various sources, institutions, government agencies, academic community, volcanic observatories, NGOs, press, and blogs, allowed the collection of quantitative data and qualitative information on direct damage to property, transport infrastructure (road, airport, port, railways), networks (electricity, water, telecommunications), agriculture (crops, equipment, livestock), forests, education and health infrastructure and economic activities. An attempt is also being made to gather information on indirect costs by gathering information on the evacuation of the population (duration and perimeter, number of displaced persons). Data sources has been systematically and precisely documented.
Since an important characteristics of volcanic activity is that a past eruption is likely to occur in the future, we hope that our database that keeps track of past eruptions would help to understand the impacts of future eruptions and eventually how to cope with. This is why in parallel to the construction of the database, we also gather information on the current human and economic geography surrounding the selected volcanoes. Further steps consist in making the database publicly accessible through a web interface, and allowing the community to contribute to its development by recording information on past and future events. Progressively it would make possible the extrapolation of the economic impacts of historical eruptions for which data are missing, and of some that are not included in our first sample.
The paper is structured as follows. Section 2 presents a brief overview of the complexity of the physical characteristics of an eruption and of its economic impacts. Section 2 recall the analysis on the link between the eruption hazard and the risk of losses and damages together with examples of evaluation. Section 3 reviews six well-known existing databases. Section 4 explains the different steps followed to build the new database. Section 5 presents our preliminary results and section 6 concludes and gives the main perspectives.
7
1. Overview of the diversity and complexity of the economic impacts of an
eruption
According to the reinsurance company Munich Re’s estimates, major volcanic eruptions over the last decades (1980-2010) have cost less than $1 billion each, with the exception of the 2011 Eyjafjallajökull eruption in Iceland (at least $1.7 billion) and the 1991-1993 Unzen eruption in Japan ($1.5 billion). However, these first-order statements hide the fact that the economic impact of volcanism is usually poorly documented and consequently under-estimated. Many
eruptions are not very deadly (<100 deaths)2, and indirect hazards associated with volcanic
events, such as lahars (mudflows) and tsunamis represent respectively 17% and 20% of the death toll of volcanism (Auker et al., 2013). However, significant damage can be caused on economic goods and activities in densely populated areas by direct (eruptive processes such as lava flow, pyroclastic flow, ash fallout and ballistic projectiles, and the emission of toxic gases) or indirect hazards (non-eruptive processes linked to the activity of the volcano, like earthquake, tsunami or lahar), and cascading effects (perturbations on transport, networks, etc.).
The duration of a volcanic eruption itself has an ambiguous impact compared to other natural disasters such as earthquakes, landslides, floods or storms. A brief and sudden eruption can generate very dramatic impacts, but an eruption lasting for several years may also have a long-term impact on human and economic activities (e.g. migration of the population from the south part of Montserrat Island since 1995, and from Lanzarote, Canary Islands, during the 1730-36 eruption). More than 500,000 people were displaced because of volcanic activity during the 1990s (Annen & Wagner, 2003). The almost-permanent eruption of Kilauea volcano in Hawaii since 1983 has important consequences on land management and real estate policies. Finally, major historical eruptions such as Laki 1783 (Iceland) or Tambora 1815 (Indonesia) had a regional or even global climatic and economic impact (Stothers, 1984; Oppenheimer, 2003; Thordarson & Self, 2003; Witham & Oppenheimer, 2004; Newhall et al., 2018).
A typology
The economic cost of a volcanic activity must be assessed through the different dimensions of its impacts. Many studies on the economic impact of disasters used the a typology
2 Over the four last centuries, volcanism may have caused the deaths of 280,000 people, of which 163,000 are
due to the five most deadly eruptions, Unzen 1792, Tambora 1815, Krakatau 1883, Mount Pelée 1902, Nevado del Ruiz 1986 (Auker et al., 2013).
8
based on the “direct” and “indirect” losses crossed with “market (tangible)” and “non-market (intangible)” losses (e.g. Pelling et al., 2002; Lindell and Prater, 2003; Rose, 2004; Hallegate and Przyluski, 2010; Ladds et al., 2017; Choumert-Nkolo et al., 2020).
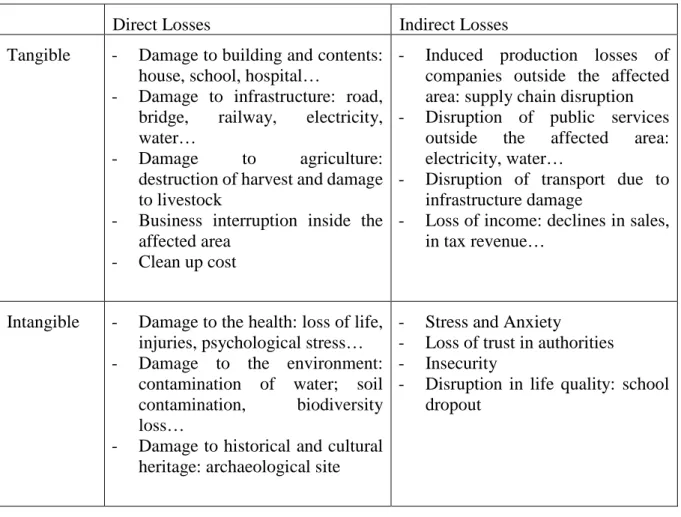
Direct losses are induced by the immediate destruction caused by the natural phenomenon. Direct tangible losses include all market traded goods and services for which a price exists. It covers damages to buildings, infrastructures, crops or manufactured items, etc. Damages on goods and services for which market and prices are not defined are then classified into non-market or intangible losses. Typical examples include damages to the environment (water quality, biodiversity and ecosystem) or to the historical and cultural assets or even health (trauma, psychological stress and loss of life). If the inventory of physical losses and their observed price are used to evaluate the direct market impact, there is no consensual methods to quantify the non-market intangible losses.
Indirect losses come from “secondary” effects of physical destructions. They include, for instance, the reduction in production due to the destruction of infrastructures or the loss of inputs. Indirect losses are less easily assessed than direct losses, because the spatial and time coverage is more complex. Contrasting with physical damage, indirect losses can last for days, months, or even years, and can spread over a much wider area. More economic sectors than the initially and directly hit may finally suffered from the disaster. As for direct losses, indirect losses may be tangible or not. Moreover, the distinction between direct and indirect losses due to the interruption of economic activities is sometimes difficult to make.
9
Table 2: The different dimensions of the economic impact of volcanic eruptions
Direct Losses Indirect Losses
Tangible - Damage to building and contents:
house, school, hospital…
- Damage to infrastructure: road, bridge, railway, electricity, water…
- Damage to agriculture: destruction of harvest and damage to livestock
- Business interruption inside the affected area
- Clean up cost
- Induced production losses of companies outside the affected area: supply chain disruption - Disruption of public services
outside the affected area: electricity, water…
- Disruption of transport due to infrastructure damage
- Loss of income: declines in sales, in tax revenue…
Intangible - Damage to the health: loss of life,
injuries, psychological stress… - Damage to the environment:
contamination of water; soil contamination, biodiversity loss…
- Damage to historical and cultural heritage: archaeological site
- Stress and Anxiety - Loss of trust in authorities - Insecurity
- Disruption in life quality: school dropout
Source: authors
2. Analytical framework and evaluation
Compared to other natural disasters, relatively few works have focused on the economic impacts of volcanic activity (McDonald et al., 2017a, 2017b; Choumert-Nkolo et al., 2020). A first obvious explanation is that volcanic activity is a very complex and diverse phenomenon, as seen above. Second, the economic impacts of an eruption depend on both its physical characteristics and on the exposure and vulnerability of the economic activities to this eruption. All volcanic events do not systematically result in economic damage, even if the shock is frequent and/or of high intensity. Following the terminology of the United Nations Office for Disaster Risk Reduction (United Nations, 2009), a volcanic eruption is a natural hazard, that is "a natural process or phenomenon that may cause loss of life, injury or other health impacts, property damage, loss of livelihoods and services, social and economic disruption, or
10
environmental damage.". The hazard may translate into a natural disaster when it leads to “a serious disruption of the functioning of a community or a society at any scale due to hazardous events interacting with conditions of exposure, vulnerability and capacity, leading to one or more of the following: human, material, economic and environmental losses and impacts. The effect of the disaster can be immediate and localised but it is often widespread and could last for a long period of time” (UNDRR, 2017).
Human and economic exposure and vulnerability are key concepts in understanding the link between a natural hazard and a disaster. Exposure refers to the elements that is or would be impacted by the natural hazard, i.e. the environment, people, buildings, infrastructure and economic activities; and vulnerability is defined by “the characteristics and circumstances of a community, system or asset that make it susceptible to the damaging effects of a hazard”
(United Nations, 2009). Vulnerability encompasses various physical, social, economic, and
environmental factors (from the quality of buildings to communities’ preparedness) that can change across countries and over time.
Risk is often seen as a combination of three components, hazard, exposure and vulnerability3,
following this formula:
Risk= Hazard x Exposure x Vulnerability
As a combination of the probability of an event and its negative consequences, it measures the “potential losses” induced by a hazard, being function of the exposure and the vulnerability of a specific place and period. The same hazard that would realize at two different periods is then unlikely to generate the same economic costs.
Human and economic geography evolves over time even in the absence of environmental changes or shocks (exposure and vulnerability have an exogenous part). But an eruption is also likely to have an impact on the human and economic geography surrounding the volcano (exposure and vulnerability are partly endogenous vis-à-vis the hazard). Then, the impact of the same eruption is very unlikely to be the same over time. While the population living within 100 kms of Holocene volcanoes (less than 10,000 years old) is estimated at 566 million in 1975, it increased to 1,054 million in 2015 (Freire et al., 2019). In this context, public and transport infrastructure as well as urban areas may expand to meet population demand, leading to an
3 In some definitions, vulnerability is a broader concept that can include exposure. In some others, structural or physical vulnerability would refer to physical elements that would be independent from the current political responses (prevention, adaptation).
11
increase in exposure. It is easy to understand that the impact on the economy will be greater if the forest cover has disappeared and has been ceded to human settlements. On the contrary, a past eruption may lead to desertification or the evacuation and the permanent displacement of victims, leading a future similar eruption to be less damaging. This is why the assessment of the economic impact of an eruption require the collection of data and information on the three elements of hazard, exposure and vulnerability.
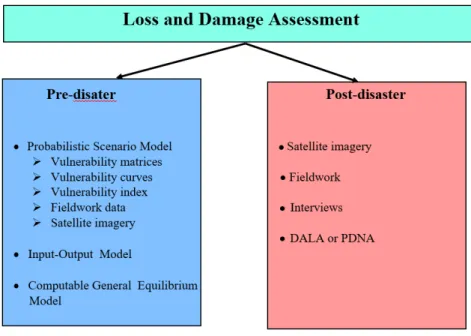
The use of simulation models has emerged as a valuable method to assess damage through different eruptive scenarios in a pre-disaster situation (see Poljanšek, et al., 2017, for more detail in assessment methodologies). The identification of elements that are exposed to different volcanic hazards (e.g. buildings, roads), and the determination of their vulnerability typically constitute the different phases of the assessment (Simmons et al., 2017). Fieldwork data or satellite imagery are precious tools to record the elements at risk (Corbane et al., 2017). Then, different approaches exist to define vulnerabilities. Damage matrices are based on experts’ judgements and estimates of past damage (Papathoma-Köhle et al., 2017). This qualitative method is based on the simple assumption that a hazard of similar intensity leads to the same level of damage for the given element at risk. Vulnerability curves or functions also relate the magnitude of the hazard to likely damage (See Blong et al, 2017, for ash fall to damage on buildings , and Jenkins et al, 2014). This quantitative procedure is based on different techniques, empirical, feedback, analytical and/or hybrid, and allows the estimation of the monetary cost. However, this approach is information-intensive while information is often lacking. To overcome this problem, vulnerability indices are developed to encompass the different factors of vulnerability but these approaches have focused on the physical damages to buildings only (e.g. Promonis et al., 1999, on a future eruption of Furnas Volcano in the Azores).
The impacts of eruptions on infrastructures are now more covered in studies on volcanic hazard. As an example, Deligne et al. (2017) analysed how an eruption in Auckland Volcanic Field (New Zealand) would affect buildings, roads, and telecommunication, electricity and water infrastructures. Zuccaro et al. (2019) also discussed the potential damages on roads and buildings due to an eruption of the Vesuvius volcano. However, these works only consider the direct impact of an eruptive scenario.
Input-output models allow to quantify direct and indirect impacts, but they are rarely employed
in the literature on volcanic activity (Mc Donald et al., 2017b; Yu et al., 2016).Input-output
models assess how the shock propagates in the economy, through the connection between the economic sectors. These linear models have some limitations. First, they are based on
12
simplifying hypotheses of relative prices rigidity, without any possibility of substitution in goods and services production and consumption. Then, an eruption would lead to a reduction in the supply of specific goods and services, but the consumer would not be able to switch to substitutes, which is not realistic, even in the short term. Besides, factors of production (capital and labour) are infinitely available, which does not reflect disaster reality (Rose, 2004). Finally, these hypotheses lead to overestimate the economic damage or costs by overestimating vulnerability (or underestimating resilience or the capacity of absorption of the shock).
The computable general equilibrium (CGE) model is regarded as an alternative for the assessment of indirect costs of a shock (Hallegatte, 2015). This non-linear model offers a better representation of the economy by modelling supply effect, flexible relative prices and the substitution mechanism. However, CGE model is usually considered as too flexible (underestimating various frictions), leading to overestimate resilience and underestimate the damage associated with volcanism (Rose and Liao, 2005). As far as we know, only Mc Donald et al. (2017a) used this model to assess the potential damage of an eruption of Mount Taranaki in New Zealand.
The estimation of damage can be ex post, in the aftermath of volcanic event. For instance, the Damage and Loss Assessment (DaLA) methodology, originally implemented by the United Nation’s Economic Commission for Latin America and the Caribbean (ECLAC) in 1972, was integrated into the project Post Disaster Needs Assessment of the World Bank in 2008. It records and aggregate the damage (partially or totally destroyed assets) and the loss (flows of goods and services negatively impacted by the disaster) for each sector, to generate the total effect of the disaster. The direct damages of the disaster are measured in physical units (e.g. number of collapsed buildings, km of damaged road…), and then expressed in monetary terms, using the pre-disaster asset’s prices. The losses occurring until the full economic recovery are expressed in current values. This methodology used primary data from the field or from government agencies. Generally, the assessment is carried out only a few weeks after the disaster in order to identify the needs of the population and to organize the reconstruction phase. This methodology was used for example for the eruption of Fuego, in Guatemala, in 2018 (World Bank, 2019).
In conclusion, there exist different approaches to evaluate the economic impact of volcanic activities (Figure 1), but their application is still limited (Table 1).
13
Figure1 : Different tools for loss and damage assessment
Notes: DALA: Damage and Loss Assessment; PDNA: Post Disaster Needs Assessment. Sources: Authors
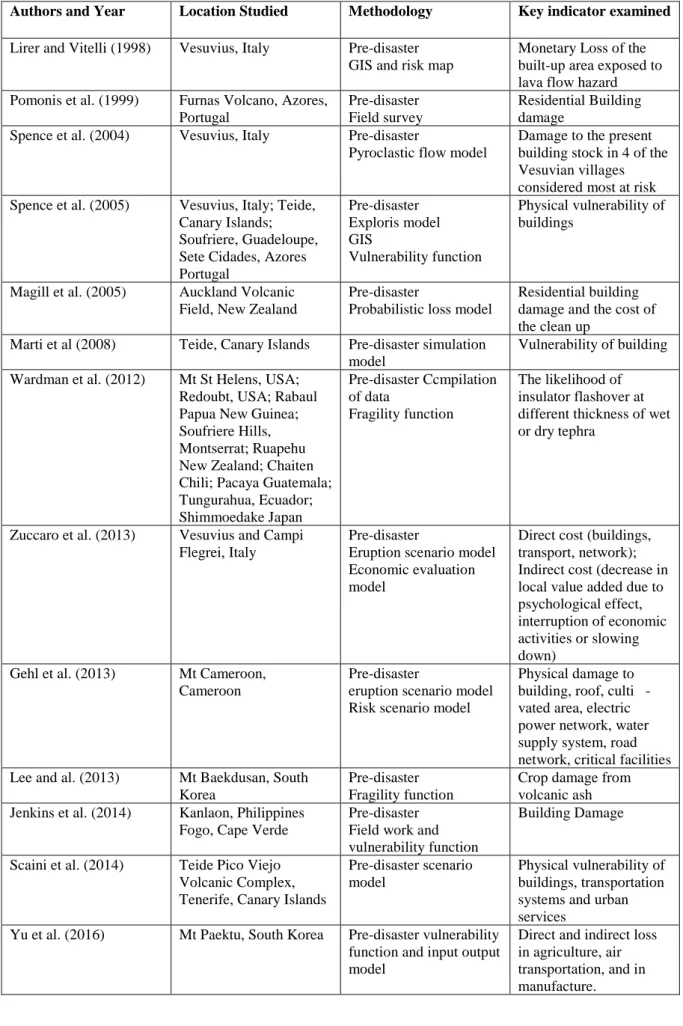
Table 1 in the appendix gathers as exhaustively as possible papers on the economic impacts of an eruption. It provides an overview of methodologies employed in these studies, specifying the studied volcano(es) or event(s) and the key indicator used.
3. Review of the existing databases
We selected 6 well-known international databases that cover volcanic disasters, which would provide a general framework for our own database and be sources of relevant and homogenous information.
The Smithsonian Institution's Global Volcanism Program (GVP)4 provides probably the most
famous database in the field, reporting physical data on eruptions around the World over the past 10,000 years. Nevertheless, it offers no information on the economic impact of these eruptions.
The National Centers for Environmental Information (NCEI), formerly National Geophysical
Data Center (NGDC)5 of the US National Oceanic and Atmospheric Administration provides
4http://volcano.si.edu
14
a list of eruptions, from 4360 BC, that meet at least one of the following criteria: the eruption has a Volcanic Explosivity Index (VEI) of 6 or larger, or it caused fatalities, a damage of $1 million or more (when documented), or it caused a tsunami or was associated with a major earthquake. Four fields of the database are related to the economic impact: the economic cost (in millions of dollars) and its level (4 categories from "limited", of less than $ 1 million, to "extreme" impact, of more than $ 25 million, when the economic cost is known; categorization uses qualitative information otherwise), the number of destroyed houses and its level (4 categories from “none” to “very many”). However, out of 835 recorded eruptions, a rough estimate of the economic cost is reported for only 18 eruptions, the impact level for 224 eruptions, the number of destroyed houses for only 34 eruptions and the scale of damage for 109 eruptions. Furthermore, the database does not detail the methodology used, the cost components that are included in the damage calculations.
The Emergency Database (EM-DAT)6 of the University of Louvain (Belgium) aims at covering
any types of disasters that have occurred since 1900. To be included in this dataset an event should fulfil one of these criteria: the death of at least 10 people and/or, the injury of at least 100 people and/or the declaration of the state of emergency and/or, the call for international aid. The EM-DAT registers 249 volcanic events but a damage estimate is provided only for 35 of these events (14%). This coverage is biased towards recent events (more than two thirds of the eruptions with an estimated cost occurred after the World War II) and high income countries (23% of the eruptions that occurred in a high-income country are accompanied by a damage estimate, against only 8% of the eruptions that occurred in low income countries). This estimate of the damage does not follow a standard methodology but would include estimates of the direct costs (the losses due to the physical impacts, such as the destruction of infrastructures, buildings, crops, etc.) and of the indirect costs (the losses occurring in the aftermath of shock, but not directly linked to the eruption, as for example the loss of production caused by the
disruptions of water or electricity supplies, etc.).7 Moreover, the EM-DAT suffers from some
inconsistencies. For instance, according to Aucker et al. (2013), 6 events were registered twice in the database. It is also possible to currently observed discrepancies regarding the number of killed people: for example, the eruption of Purace, Colombia in 1949, killed 1000 people according to the EM-DAT while only 17 students were killed during the ascent of the mount
6https://www.emdat.be/emdat_db/
7 6 of the eruptions in our database are not covered by the EM-DAT: Semeru (1981); El Chichon (2 eruptions in 1982); Soufriere Hills (3 eruptions in 1997, 1999, and 2003).
15
according to Oppenheim (1950). Besides, the database suffers from imprecisions. While three volcanoes were in activity in Indonesia in 1976 (Merapi, Semeru, and Karangetang), the EM-DAT records only one disaster, without indicating the volcano name. In September 1999, two volcanic eruptions in Ecuador (from Guagua Pichincha and Tunguruhua volcanoes) were merged as a single event without any possibility to dissociate their respective human and economic impacts. Moreover, the sources of data are not mentioned systematically without possibility for the user to properly check consistency. Sources that are reported are heterogeneous, coming from governmental and non-governmental agencies, insurance companies, research institutes, press, etc... For instance, for the Rabaul eruption, Papua New Guinea, in 1994, EM-DAT reports an estimated cost of $ 110 million, half as high as $ 210 million reported by Blong and McKee (1995). Other works pointed out deficiencies and measurement errors in EM-DAT that are recalled in Choumert-Nkolo et al (2020).
The United Nations Office for Disaster Risk Reduction (UNISDR) has managed the
Desinventar database on natural disasters since the 1990s8. Desinventar initially focused on
small and medium impact disasters in Latin America. Currently, the spatial coverage remains limited, with only 83 countries differently covered over time. Damage estimate includes only direct costs but data fields on physical damages, like the destruction of houses, road or agricultural surfaces, are rarely filled. For instance, in the case of Indonesia, Desinventar registers 171 eruptions that occurred between 1815 and 2018, but an estimate of the economic cost is available for only 1 eruption and physical damage are mentioned for only 20 of them.
Insurance and reinsurance companies such as Munich Re9 and Swiss Re10 maintain databases
on disasters, but they are not made publicly available and their historical coverage is limited (while their methodology is briefly explained). For example, Swiss Re database records volcanic activities that occurred since 1970 and only for volcanic eruptions recording at least 20 fatalities, at least 50 injuries, at least 2000 people made homeless, or that induced an estimated loss of at least US$ 103.5 million for the 2018 reporting year (Swiss Ré, 2019). Moreover, coverage is obviously biased towards high-income countries that are characterized by a deep market of insurance, while, according to the NGDC database record, 62% of volcanic eruptions have occurred in developing countries between 1900 and 2018.
8http://www.desinventar.net
9https://natcatservice.munichre.com
16 Intermediary conclusions
The review of the literature and existing international databases shows that:
(i) exhaustive lists of eruptions accompanied with physical data exist;
(ii) loss and damage estimates are provided only for a small number of eruptions (with
a selection bias toward recent eruptions occurring in developed countries);
(iii) when provided, damage estimates are not based on a homogenous methodology,
without any possibility to engage a comparative exercise;
(iv) primary data sources are not systematically documented, without any possibility to
triangulate the information;
(v)
these international databases show very few relationship or collaboration with eachother.
Our aim is then to build a new database that would allow to provide information on the economic impacts of a selection of eruptions, being as exhaustive as possible avoiding selection bias. Tracking data sources is also one or our concern. Given that resources devoted to this project are limited, a selection of eruptions is necessary for this first version of the database.
4. The new database’s methodology
The methodology we follow to build our database then follows these different steps:
(i) Select volcanic eruptions that can be covered by a first version of the database (under
constraint of resources devoted to the project), according to selection criteria
(ii) Collect data on (a limited number of) the most relevant physical characteristics of
the selected eruptions
(iii) Collect quantitative and qualitative data on the identified economic impacts (37
items), with systematic primary data tracking
(iv) Collect data on the current geographical and economic characteristics of the areas
surrounding the concerned volcanoes.
Step 1 Selecting a sample of eruptions
Because of the large number of historical eruptions and the limited resources to build this new database, we have selected a first sample of eruptions that occurred after World War II, since
17
they are more likely to be documented (first by the international databases). We also focused on eruptions that are more likely to have had significant impacts on economic activities, with the following selection criteria:
• Eruption with a Volcanic Explosivity Index (VEI: Newhall & Self, 1982)11 of 5 or
higher or;
• Eruption with a VEI from 1 to 4, and
for which the cost is fully documented (in EM-DAT or NCEI databases), and/or
of a particular eruption type (e.g. CO2 degassing at Lake Nyos in 1986;
Jökulhlaup from the Grimsvötn caldera in 1996), and/or
associated with a heavy human toll12.
A total of 55 eruptions that meet these criteria were selected, from 42 volcanoes situated in 18 developing and developed countries (See Figure 2, and list in Annex). The eruptions not selected in our database are among the events that had a limited impact on economy. As an example, Sarychev volcano (Kuril Islands, Russia) experienced a VEI 4 eruption in 1946, but there are only 148 inhabitants living within a radius of 100 km around. Damage can thus be considered as minimal. Such an eruption could certainly disrupt air transport, as did the 2009 eruption of Sarychev, but in 1946 aviation was not very developed.
11 While using VEI could be debated, other proxies of magnitude (corresponding to the mass of material
erupted) and intensity (mass eruption rate) are not documented in the NCEI, GVP or EM-DAT databases.
12 The number of death or total affected people is above the median of the distribution of all events registered
18
Figure 2: Locations of the selected volcanoes and eruptions
19 Step 2 Collecting physical data on eruptions
The economic consequences of a volcanic eruption depend on the physical characteristics of the hazard(s). As a first approach, we rely on the type of the eruption, requiring a classification of the eruptions. Here we have distinguished 10 types of volcanic eruption, following the classifications of Mercalli (1907) and Walker (1973). More background information on each type of eruption and associated hazards can be found in Sigurdsson et al. (2015).
1. The Hawaiian type (named from Hawaï volcanoes, Pacific Ocean, USA) is characterised by effusive eruptions producing lava that gushes out in the form of a fountain and flow for hundreds of meters to tens of kilometres. This eruption does not give rise to major explosions (rare explosions are observed in the case of crater collapses: Piton de la Fournaise 2007, Kilauea 2018). Although the volume of lava can exceed a cubic kilometre, the VEI typically ranges between 0 and 1.
2. The Strombolian type (from Stromboli volcano, Italy) corresponds to an intermediate between explosive and effusive dynamics, producing both lava flows and pyroclasts (bombs, lapilli, and ash) at a limited extent around the volcano (VEI 1-2, with rare Vulcanian paroxysms at VEI 3; see below).
3. The Plinian type corresponds to explosions of great intensity (VEI between 4 and 8) characterised by the high fragmentation of viscous magma and a large dispersion forming a volcanic plume that can reach an altitude of more than 30 km. This eruptive column may later collapse to form pyroclastic flows that can travel up to tens of kilometres around the volcano. In some cases, Plinian eruptions lead to the destruction of the summit of the volcano, thus forming a caldera. The term “subplinian” is sometimes used to refer to Plinian eruptions with a dispersion of pyroclasts lower than 500 km², whereas eruptions with a VEI of 7 or 8 are often named ultra-plinian.
4. The Vulcanian type (from Vulcano, Italy) is characterised by similar dispersion (VEI 2-4) but greater magma fragmentation compared to the subplinian type. Magmas involved in Vulcanian eruptions are more viscous than those of Hawaian and Strombolian eruptions, and gas retention increases the pressure in the conduit. Vulcanian eruptions initially occur as a series of discrete, canon-like explosions that are short-lived (few minutes to hours). Once the conduit is opened, the subsequent dynamics are less explosive or even effusive (rare lava flows). The ash plume is commonly between 5 and 10 km high.
20
5. Pelean eruptions (from Mount Pelée in Martinique Island, Lesser Antilles, and its 1902-1905 eruption) are characterised by the formation of viscous lava domes and spines in the summit area of the volcano. When the pressure becomes too high and / or the slope too steep, the dome explodes and collapses, thus producing a volcanic plume and pyroclastic flows on the flanks of the volcano.
6. Surtseyan eruptions (from Surtsey Island, formed in 1963 south of Iceland) refer to underwater phreatomagmatic eruptions at shallow depths, including sub-lacustrine eruptions. When lava meets water, violent explosions arise in the form of cypressoid jets piercing the water surface. VEI of Surtseyan eruptions ranges between 2 and 3. As volcanic activity persists, an island eventually emerges, magma-water interactions are less influent, and eruptive style becomes Hawaiian, Strombolian or Vulcanian, depending on the nature of the magma.
7. Sub-glacial eruptions are another type of phreatomagmatic eruptions. At the contact with magma, the ice cap melts and might form a water reservoir below the glacier and eventually a lake at the surface. Large volumes of water can be suddenly released, thus forming a debris flow (named jökulhlaup in Iceland: e.g. Grimsvötn 1996) which finally represents the main hazard of such eruptions.
8. Many volcanoes are located in deep-sea environment, where the pressure, which increases with water depth, has a clear influence on gas release and eruptive processes such as lava fountaining at the vent and lava flow emplacement. Although the resulting eruptive style is mostly effusive, submarine eruptions should be distinguished from other effusive types of eruptions (e.g. Hawaiian, Strombolian). In the case of viscous magmas, explosive eruptions can occur at depths greater than 2000 m.
9. A phreatic explosion is produced when magma finds grounds water on its way to the surface, causing an almost-instantaneous evaporation of water to steam. The eruption is called phreatic (and not phreatomagmatic) when there is no fresh magma emitted by the explosion.
10. A limnic eruption (e.g. Lake Nyos, Cameroon, 1986) is characterised by a sudden gas release from a volcanic lake. In the case of meromictic lakes, which are stratified in
different water layers that do not mix each other, dissolved volcanic gas (mostly CO2)
may accumulate in the lower water layers. Once the lake is saturated in gas, it becomes unstable and events such as earthquakes or magma rising beneath the lake may disrupt the structure of the lake and trigger a limnic eruption.
21
Different types of eruptions may alternate during the life of a volcano, and even during a single eruption (e.g. phreatomagmatic turning to strombolian). Thus, this kind of information is included into the database.
Together with the type, we documented the date of the eruption, its beginning and its end. This information is drawn mainly from the NCEI and EM-DAT databases, or the GVP database for some end dates that missed in the NCEI and EM-DAT databases, following triangulation and correction when necessary.
Besides, we have documented for each eruption the volume of volcanic products emitted (e.g. volume of pyroclasts such as ash in the case of explosive eruptions, volume of lava flows in the case of effusive eruptions), as the damages on the economy are very sensitive to the intensity of the disasters. In terms of physical processes, we have recorded if the volcanic activity was characterized by ash fall, pyroclastic flows, lava flows and/or emission of gas. Additionally, we have mentioned if the volcanic event produced secondary hazard such as lahars and tsunamis. Those data come from the GVP database but also from specialized and academic institutions.
Moreover, we have completed the database by including sulphur dioxide (SO2) measurements
(volume and altitude of SO2 plume) from GVP database, and specialized or academic
institutions. When available, we informed about the existence and provide web links to maps showing the spatial distribution of lava flows, lahars, and ash fall deposit of the eruption, but also the local hazard maps drawn by government agencies or volcanic observatories.
Step 3 Collecting damage and loss data
For this first version of the database, we defined 37 types of cost or damages. We paid a particular attention to the sources of information, that are systematically documented in our database for every fields. Sources of information are diverse: institutions, governmental and non-governmental agencies, academic institutions, volcanic observatories and press. In the triangulation exercise, preference is usually given to international databases since we can expect a standardized or homogeneous piece of information on various eruptions, then local databases and finally media (press, newspapers). Information searches were carried out in several languages such as English, Indonesian, Spanish, Japanese or French... generally speaking, the difficulty to collect data is function of the eruption before to be function of the type of cost or damages.
22
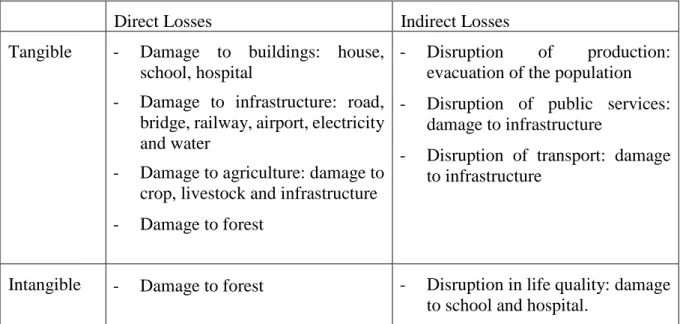
The following table summarizes the different items gathered. In the first version of our database, they are mainly direct cost or the loss directly due to the physical impact of the eruption (tangible direct losses).
Table 4: Losses covered by the new database
Direct Losses Indirect Losses
Tangible - Damage to buildings: house,
school, hospital
- Damage to infrastructure: road, bridge, railway, airport, electricity and water
- Damage to agriculture: damage to crop, livestock and infrastructure - Damage to forest
- Disruption of production: evacuation of the population - Disruption of public services:
damage to infrastructure
- Disruption of transport: damage to infrastructure
Intangible - Damage to forest - Disruption in life quality: damage
to school and hospital. Source: Authors
Damage to buildings
The number of buildings partially or totally damaged (by lava flows, tephra fallout, etc.). When available, more precise information is given for public service infrastructures, like schools and hospitals, because their degradation may have a long-term negative impact on the human and economic development beyond the direct and material costs. The sources of information are diverse and scattered, and are mainly institutional or academic works. Damage to infrastructure
Damages to infrastructure may obviously have impacts on economic activities and they are
usually covered by publicly available information.Here again, different sources of data and
information are mobilised, from the volcanic community and academia as well as from government agencies, institutions and the press. Different infrastructures may suffer from the volcanic activities, from the eruptive processes (lava flows, pyroclastic flows, ash falls etc.) to indirect processes (lahars, tsunamis). We collected first:
23
- The number of affected roads, and when available the portion damaged (in km) and the category of the road deteriorated.
- The physical loss for railway networks in term of lines (in kms) and infrastructures (railway station). However these data are relatively scarce.
- The number of affected bridges and their names or locations when available. - Airports and air traffic are also frequently affected by volcanic eruptions. Buildings,
runways, and aircrafts may be threatened by eruptions and volcanic ash clouds may alter the flying conditions and eventually lead to interruption of air traffic. We then included first the information on airport closure, its duration, and the number of damaged aircraft when available.
Furthermore, volcanic activities may hit other infrastructures such as the electrical grid, the water and telecommunication networks. We added in the database these physical damages, principally if they have suffered from the volcanic activity or not, and in scarce case we reported the material destroyed when the information was available.
Damage to agriculture
Agriculture and forests are of critical importance for poor communities in developing countries and are particularly vulnerable to natural disasters in general and so to volcanic eruptions. An agricultural land may be buried by lava flows, ash fallout deposits, or lahars deposits. The equipment such as irrigation systems may also be damaged by the disaster. Similarly, farmers may lose their crop or their livestock since animals may die by asphyxiation. Therefore, specific fields for damage to agriculture were added to the database:
- the surface of damaged agricultural land in hectare, - crop lost (in hectare)
- the number of planted trees destroyed, - the number of cattle killed,
- the equipment losses,
- the surface of forest damaged in hectare.
The two latest items are less informed than the others due to data scarcity. When available, more information has been added on the type of crops, livestock, and if the eruption occurred during the growing season or not. This information may approximate the level of agriculture
24
damage.Data are still very dispersed and comes from academic work, government agencies,
institutions, the volcanic community and to a lesser extent from the press. Damage to other economic activities
When available, diverse qualitative and quantitative information on economic sectors that have suffered from the eruption, typically tourism, trade and transport, are added. This is also the case for other estimates of economic costs when available, or whether cities or specific activities (tourism, industry plants) have been hit, and more general information when relevant. These data are mainly obtained from government agencies and institutions, but may also be derived from academic research.
Physical damages are detailed in our database that would allow to assess direct and indirect losses. We also added the existing monetary valuation(s) of direct losses when available. Indirect damages to economic activities
Indirect tangible damages are typically more difficult to assess. We selected qualitative and quantitative information on population evacuation firstly to proxy those indirect damages. When an evacuation occurred, we complemented the database with its duration, the number of displaced people and the evacuation perimeter. These data come mainly from the Office for the Coordination of Humanitarian Affairs (United Nations).
In parallel to the construction of the database, we collected data on the current geographical and economic characteristics of areas surrounding selected volcanoes.13
As explained above, human and economic geography evolves over time even in the absence of environmental changes or shocks, but it is likely to be dramatically affected by an eruption. So do the community efforts to cope with natural hazard. Exposure and vulnerability are changing, and the same hazard cannot have the same economic impact over time. Information about the economic impacts of past eruptions are not sufficient to extrapolate the potential impact of the same hazard that would occur now. It is then important to collect data on the current geographical and economic characteristics of the exposed areas surrounding the volcanoes to assess the risks or the potential losses of future eruptions.
13 We greatly acknowledge the assistance from Olivier Santoni (Ferdi-Cerdi) in the collection of these
25
We collected data on the soil occupation around the volcano, from Modis land cover products (MCD12Q1), a global map that registered 17 categories of soil, from land usages (cropland, urban and built up) to the vegetation coverage, from 2001 to 2017. We selected the share of every category on the land in the radius around the volcano of 10 kms (a close area potentially affected by all the physical manifestations of an eruption, being lava flow, lahars, pyroclastic flows, ash fall... ) and 50 kms (a wider area more likely to be affected by ash and in rare exception by pyroclastic flows).
We also collected data on infrastructure such as airport, port, hydroelectric dam and hospital
within 10 kms and 50 kms around the volcano. They come respectively from Ourairports14, the
World Port Index15, and the Global Database of Power Plants16.
5.
Preliminary results
The database gathers information on the 55 selected eruptions (see the list in Annex) and on their human and economic impacts, generating an excel sheet with 55 lines (for the 55 eruptions) and 54 columns (17 columns for the identification, location and physical characteristics and human toll of the eruption, and 37 columns for the economic impacts). At the current state of data collection (January 2021), approximately 67% of the cells are filled, with 94% for the identification and physical characteristics cells and 54% for the economic data cells respectively (specifically, monetary estimates, as opposed to qualitative information on damages, are poorly informed).
Focusing our efforts on a limited number of eruptions allowed a wider data coverage. 78 % of the 55 eruptions selected in our database are covered with a damage variable for buildings, compared to 18% in the NCEI database. On the sample of the 25 eruptions that are covered by both our database and Desinventar, the number of damaged houses is documented for 17 eruptions in our database, against only 3 in Desinventar. 45 % of our selected eruptions are informed with damages to hospitals, versus none in Desinventar.
On the sample of the 47 eruptions that are covered by both EMDAT and our database, we increase marginally the information on the total value of economic damages from 23 to 30
14 https://ourairports.com/
15 https://msi.nga.mil/Publications/WPI
26
eruptions. In our database, only 12 eruptions have no monetary assessment whatever the category of damage.
As illustrated by Figure 3, data availability for economic impacts varies greatly for the 55 selected eruptions, from 22% to 92% (filled cells). Data availability is beyond 50% for 29 eruptions, and beyond 75% for 9 eruptions. At this stage, it doesn’t seem obvious that data availability would depend greatly on location or on the date of the eruption.
Figure 3: Percentage of available data per eruption
Source: Authors
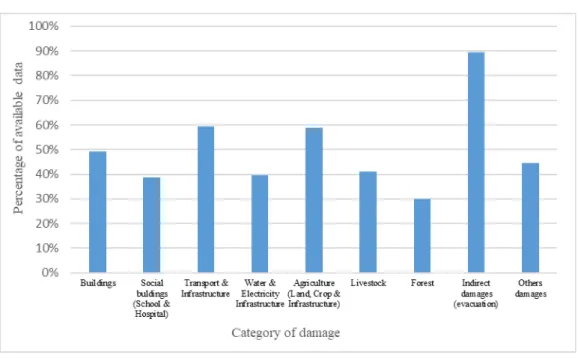
In contrast, data availability depends on the type of damages. For instance, information on forest damage is filled for only 30% of the eruptions, against 49% for damage to buildings (Figure 4).
0% 10% 20% 30% 40% 50% 60% 70% 80% 90% 100% L am in gt on ( 1951) C am igu in ( 1951) A gu n g ( 1963) T aal ( 1965) K el u t ( 1966) A w u ( 1966) M ayon ( 1968) A re n al ( 1968) Iya ( 1969) V es tm an n ae yj ar ( 1973) N yi ragon go ( 1977) U su ( 1977) D ie n g V ol c C om p le x ( 1979) S t H el en s ( 1980) S em er u ( 1981/ 3) S em er u ( 1981/ 5) E L c h ic h on ( 1982/ 3) E L c h ic h on ( 1982/ 4) E L c h ic h on ( 1982/ 5) G al u n ggu n g ( 1982) C ol o u n a u n a ( 1983) M ayon ( 1984) N evad o d e l R u iz ( 1985) O k u V ol c F ie ld ( 1986) K el u t ( 1990) U n ze n ( 1991) P in at u b o ( 1991) H u d son C e rr o ( 1991) L ok on -E m p u n g ( 1991) C er ro N e gr o ( 1992) M ayon ( 1993) R ab au l ( 1994) G ri m svot n ( 1996) S ou fr ie re H il ls ( 1997/ 6) S ou fr ie re H il ls ( 1997/ 8) S ou fr ie re H il ls ( 1999) G u agu a P ic h in ch a ( 1999) T u n gu ru h u a ( 1999) E tn a ( 2001) N yi ragon go ( 2002) R eve n tad or (2002) S ou fr ie re H il ls ( 2003) T e n gge r C al d er a (2004) M an am ( 2004) M an am ( 2005) T u n gu ru h u a ( 2006) M ayon ( 2006) E yj af jal laj ok u ll ( 2010) B u lu san ( 2011) P u ye h u e ( 2011) S in ab u n g ( 2013) F ogo ( 2014) K il au e a ( 2018) F u e go ( 2018) K rak at at au ( 2018) P er cen tag e o f av ai lab le d at a Volcanic activities
27
Figure 4: Percentage of available data per category of damage
Source: Authors
The result of data collection reveals the existence of biases (while it would not be systematically significant because of the use of a small sample of eruptions).
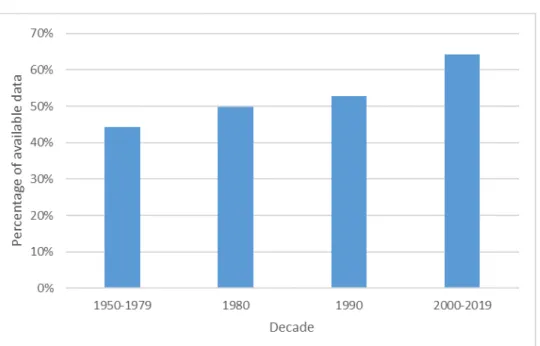
First, a time bias can be observed since the oldest eruptions are relatively less documented than the recent ones. In the 1950s-1970’s, 44% of economic impacts data are filled in our database, against 64% in the decades 2000s- 2010s.
28
Figure 5: Percentage of available data per decade
Source: Authors. Notes: numbers of eruptions by periods are 13 in 1950-1979, 11 in 80’s, 14 in 90’s and 17 in 2000-2019.
Second, data availability suffers from a spatial bias since developed countries are better covered than developing countries. 65% of the information is available for the 8 eruptions occurring in the 4 concerned developed countries (Iceland, Italy, Japan, USA), against 52% for the 47 eruptions occurring in the 14 concerned developing countries (Cameroon, Cape Verde, Chile, Colombia, Congo DR, Ecuador, Indonesia, Guatemala, Montserrat, Mexico, Nicaragua, Papua New Guinea, Philippines). It would be explained by more public resources devoted to information and media coverage, and higher efforts from insurance companies devoted to the analysis of the impacts of natural disasters in the former.
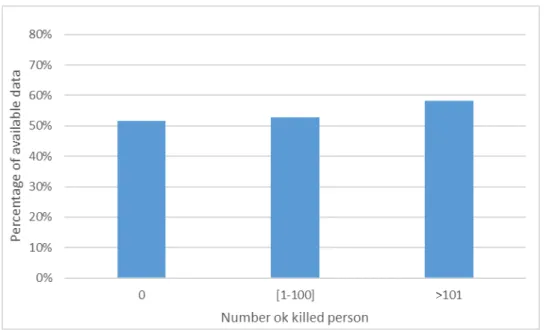
Third, the deadliest events are better covered by information and data, probably because they attract more attention. Thus, for the 22 eruptions with no fatalities, approximately 52% of the data are available, against approximately 58% for 14 eruptions that killed more than 100 persons.
29
Figure 7: Percentage of available data per category of number of killed persons
Source: Authors. Notes: 22 eruptions with no fatalities, 19 with less than 100 and 14 with more than 100 victims.
Fourth, while less clear, the larger the current population located around a volcano (within a 5-km radius), the wider the data coverage (Figure 8). The relatively good coverage of the [0-100] population category would reveal that for eruptions from isolated volcanoes, while they would attract less attention, economic damages are low and less complex to assess and inform.
Figure 8: Percentage of available data per category of Population within 5 km
30
Fifth, more active volcanoes are also better covered, revealing greater efforts of monitoring. From our sample of 42 volcanoes, the level of data availability is 49% for the 18 that did not erupt in the 50-year period before the recorded eruption, against 56% for the others.
In contrast, the severity of the eruption doesn’t seem to be a determinant (anymore, while it should have been the case it the 1950s-80s): data availability is similar for the eruptions with a VEI of 5 or higher than for the others (respectively 51% and 53%)
Data availability is probably the result of different biases, of which the relative contribution can
be revealed by a simple linear regression of data availabilityi,the percent of the filled cells for
economic data for the eruption i , on the following determinants:
• yeari,the year of the recorded eruption i.
• deathi, the number of killed people (in a first exploration, we also tested the number of
injured people, but that is highly correlated with deathi, and less correlated with data
availability than deathi).
• pop5kmi, the current number of inhabitants within a 5-km radius of the volcano (in
thousand).
• developingi , a dummy that equals to 1 if the concerned country belongs to low, low
middle or upper middle income category according to the World Bank classification.
• VEIi, the Volcanic Explosivity Index or Severityi, a dummy that equals to 1 if the
Volcanic Explosivity Index of the eruption is greater than 4.
• Low frequencyi a dummy that equals to 1 if the volcano didn’t erupt in the 50-year period
before the recorded eruption.
31
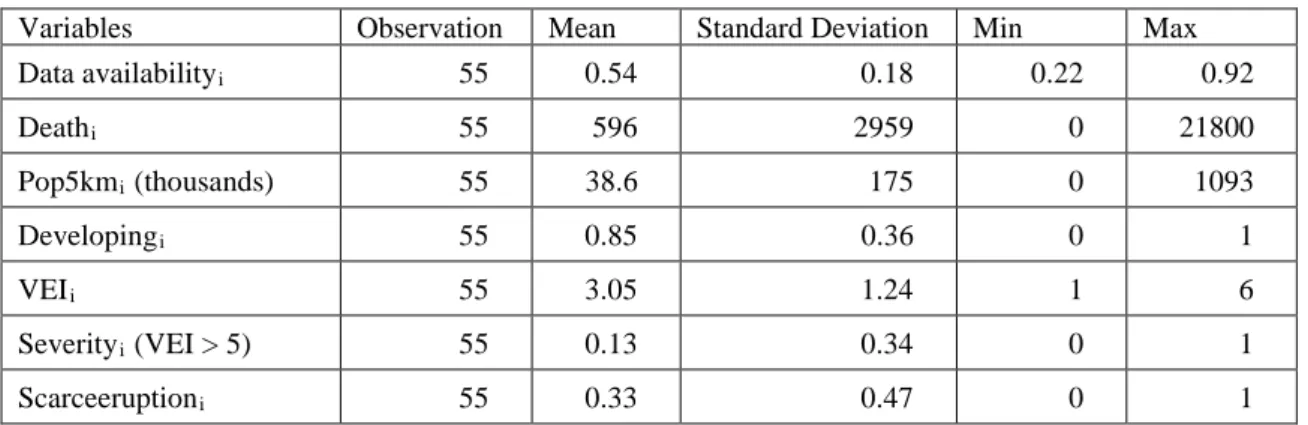
Table 5: Descriptive statistics
Variables Observation Mean Standard Deviation Min Max
Data availabilityi 55 0.54 0.18 0.22 0.92 Deathi 55 596 2959 0 21800 Pop5kmi (thousands) 55 38.6 175 0 1093 Developingi 55 0.85 0.36 0 1 VEIi 55 3.05 1.24 1 6 Severityi (VEI > 5) 55 0.13 0.34 0 1 Scarceeruptioni 55 0.33 0.47 0 1
Table 6: Correlation Matrix Data availabilityi
Yeari Deathi Pop5kmi Developingi VEIi Severityi
Yeari 0.444 Deathi 0.293 -0.115 Pop5kmi 0.122 -0.194 -0.017 Developingi -0.258 -0.079 0.081 0.087 VEIi -0.296 -0.377 0.028 -0.141 0.186 Severityi -0.051 -0.191 -0.032 -0.079 0.003 0.650 Scarceeruptioni -0.192 -0.304 -0.034 0.048 -0.151 0.379 0.431
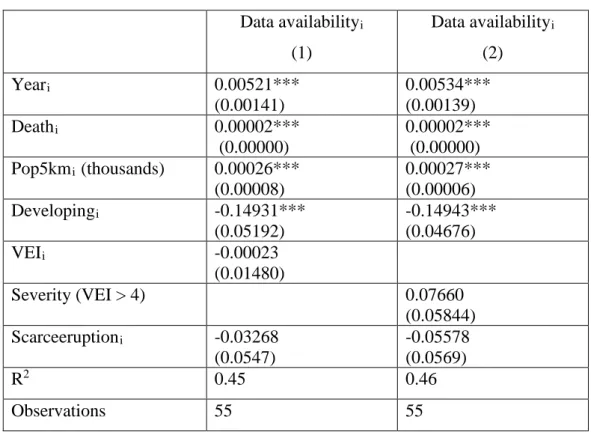
Regression results reported in Table 7 show that most of all factors significantly contribute to explain data availability (but that data availability is also explained by other factors since only 45% of the variability in data availability is explained by the regression).
32
Table 7: Data availability and its correlates
Data availabilityi (1) Data availabilityi (2) Yeari 0.00521*** (0.00141) 0.00534*** (0.00139) Deathi 0.00002*** (0.00000) 0.00002*** (0.00000) Pop5kmi (thousands) 0.00026*** (0.00008) 0.00027*** (0.00006) Developingi -0.14931*** (0.05192) -0.14943*** (0.04676) VEIi -0.00023 (0.01480) Severity (VEI > 4) 0.07660 (0.05844) Scarceeruptioni -0.03268 (0.0547) -0.05578 (0.0569) R2 0.45 0.46 Observations 55 55
Note: Robust standard errors are in parentheses, with *** 1%, ** 5%and * 10% levels.
Conditional to our eruption sample and the set of explanatory variables (and only 45% of the variability in data availability is explained by the regression), our results show that every decade adds 5 percentage points of data availability, and 1000 deaths 2 percentage points. Data availability is reduced by 15 percentage points when the eruption occurred in developing countries compared to the ones that occurred in developed countries. Intensity and frequency
variables, on however, does not contribute to data availability17.
6. Conclusion
After a review of the existing databases, we build a new database on the economic consequences of 55 eruptions that occurred since the World War II, from 42 volcanoes located in 18 developing and developed countries. Eruptions that show a diversity of physical characteristics have very diverse economic impacts that also depend on the exposure and vulnerability of the
17 This last result contrasts with preliminary results on a smaller sample of eruptions (size = 43) that we used in
a first stage of the project. However, overall results do not change significantly and the R2 has increased with
33
human and economic activities. Our database thus gathers, for every eruption, 17 items on physical characteristics, and 37 items on the economic impacts, from direct losses to more indirect damages, mixing quantitative data and qualitative information. Since it is an observed shortcoming of the existing databases, we take a great attention in tracking sources of data and information we use to fill these items. Our sources of information include international
databases, government agencies, NGOs, academic papers and the media18.
In the current version of the database, with 55 selected eruptions, while being an improvement compared to existing databases, only 54% of data for the economic items are filled. We show that data and information availability is biased towards more recent eruptions, occurring in developed countries and associated with a significant human toll. This is why we will build a tool allowing interested specialist to help completing the database along with making the database available to the public though a web interface.
In order to initiate a work consisting in predicting the economic impacts of future eruptions, we gather information and data on the current human and economic geography surrounding the 42 selected volcanoes, on 25 items from the soil occupation to infrastructures.
Further steps also include an attempt to use this set of data and information to attempt the modelling of the links between the physical characteristics of an eruption, the vulnerability and the impacts on economic activities. This would allow to get a tool for generating and imputing missing data for the selected eruptions and other ones, and to predict the impacts of future eruptions. These new database would then be integrated into the Global Volcano Model project, and allow collaboration with NGDC, UNISDR and GFDRR of the World Bank, or insurance companies.
18 Although we paid the utmost importance to data quality and accuracy gathered in the database, for which we
have informed data sources systematically, we cannot under any circumstances, guarantee the reliability of all data and in no case we can be held liable for the use of the information provided through the database.