HAL Id: hal-00923258
https://hal.archives-ouvertes.fr/hal-00923258
Submitted on 2 Jan 2014HAL is a multi-disciplinary open access archive for the deposit and dissemination of sci-entific research documents, whether they are pub-lished or not. The documents may come from
L’archive ouverte pluridisciplinaire HAL, est destinée au dépôt et à la diffusion de documents scientifiques de niveau recherche, publiés ou non, émanant des établissements d’enseignement et de
To cite this version:
S. Sun, Jean-Denis Mathias, Evelyne Toussaint, Michel Grediac. Hygromechanical characteriza-tion of sunflower stems. Industrial Crops and Products, Elsevier, 2013, 46, p. 50 - p. 59. �10.1016/j.indcrop.2013.01.009�. �hal-00923258�
Hygromechanical characterization of sunflower stems
S. SUNa,b , J. D. MATHIASc , E. TOUSSAINTa,b,∗
, M. GREDIACa,b
a Institut Pascal, Clermont Universit´e, Universit´e Blaise Pascal, BP 10448,
F-63000 Clermont-Ferrand, France
b CNRS, UMR 6602, Institut Pascal,
63177 Aubi`ere Cedex, France
c IRSTEA, Laboratoire d’Ing´enierie pour les Syst`emes Complexes,
Campus des C´ezeaux, 24 avenue des Landais - BP 50085, 63172 Aubi`ere Cedex, France
Abstract
This study concerns the determination of hygromechanical properties of sun- flower stems. Mechanical tests were carried out on specimens of sunflower bark and pith. Particular attention was paid to the influence on the mechan-
ical properties of (i) specimen location along the stem and (ii) moisture con- tent of specimens. For this purpose, specimens were taken from the bottom,
middle, and top of the stems. The influence of humidity on the mechanical properties was studied by testing specimens conditioned at three different relative humidities: 0% RH, 33% RH and 75% RH. Moisture diffusion co- efficients of bark and pith were deduced assuming Fick’s law to predict the variation in moisture content of the specimens during the mechanical test. The Young’s modulus of the bark was found to be higher than that of the pith, whereas the moisture diffusion coefficient of the bark was lower than that of the pith. Mechanical and hygroscopic properties of specimens depended on their location along the stem. In order to explain these characteristics,
∗
corresponding author. Tel.: +33 473288073; fax:+33 473288027, Email addresses: [email protected] (S. SUN),
morphological observations has been done on the specimen of each
location. It was found that both the bark and the pith are denser
at the higher locations, and the ratio of rigid tissus in the bark is
greater at the higher locations.
Keywords: Sunflower stems, Mechanical properties, Moisture diffusion
coefficients, Morphologies, Specimen location, Moisture content
1. Introduction
Green industry is important both economically and environmentally. Re- search on the development of new bio-sourced materials has thus been at-
tracting more and more attention. During the last decades, bio-composites reinforced by plant fibers such as wood, flax, hemp, jute and sisal have been rapidly developed for various industrial applications such as structural com- ponents for the automotive and building industries (Mohanty et al., 2005). Compared with conventional synthetic fibers, natural fibers offer some ad- vantages including cheapness, low density and biodegradability, but their mechanical properties are generally inferior.
Besides industrial crop activity solely devoted to fiber production, another potential source of natural fiber supply is agricultural by-products, especially for industrial applications in which required mechanical performance is not too high. Against a rapid expansion of natural fiber-based composites, new composites reinforced with agriculture by-product fibers offer a potentially effective way to ease disparities in natural fiber supply and demand. The
cellulose content of most agricultural by-product fibers is generally lower than that of traditional natural fibers such as wood, flax, hemp, jute or sisal. Cellulose content directly influences mechanical properties. This drawback can, however, be offset by cheapness in many industrial applications. Some studies on the use of agricultural by-products as composite reinforcement are reported in the literature. They concern corn stalk, and wheat, rice or corn straw (Ardanuy et al., 2011; Ashori and Nourbakhsh, 2010; Nourbakhsh and Ashori, 2010; Panthapulakkal et al., 2006; Wang and Sun, 2002; White and Ansell, 1983; Yang et al., 2003). These studies clearly show that such by- products offer a relevant, promising solution for some composite applications. The even trade-off between cheapness, mechanical properties, abundance and availability of these agricultural by-products makes it possible to use them in industrial applications. Aside from these advantages, using agricultural by-products can also improve the agriculture-based economy and create new market opportunities.
This study concerns the characterization of hygromechanical properties of sunflower stems, an abundant agricultural by-product. These stems are generally shredded during flower harvesting and used as natural fertilizer. In Europe, sunflower is cultivated for the edible oil extracted from its grains: it
is one of the three main sources of edible oil along with rapeseed and olive. This plant is thus widely cultivated. In 2010, the harvested area in Europe as 3.68E+06 ha, 16% of the total harvested area in the world (FAOSTAT Statistical Database). The flower itself is clearly the most useful part of
the plant; there is no significant industrial use of the stems shredded after
flower harvesting. These stems may, however, exhibit favorable mechanical
properties (of the bark) and good heat insulation properties (of the pith).
Hence this by-product could find use in bio-sourced composite materials.
The aim of this study was to investigate the mechanical properties of the
bark and pith of sunflower stems. Our purpose was to collect information
that would be useful for designing bio-composite panels suitable for building
insulation (see DEMETHER Project). Such panels must feature both useful
heat insulation properties and mechanical properties sufficient to ensure safe
handling, transport and assembly. As the reinforcement of the compos-
ite, the properties of the bark and pith affect the properties of the
panels. It is clear that the pith of the stem possesses better insu-
lation properties, while the bark has better mechanical properties.
So these mechanical information concerning on the pith and bark
are indispensable for predicting and modeling the panels in term
of balancing the heat insulation properties versus the mechanical
properties.
In what follows, the specimens, tests and testing procedures are first
described. Results obtained with hygroscopic and mechanical tests performed
on bark and pith of sunflower stems are then presented and discussed, with
special emphasis on the influence of the moisture and sampling zones on the
2. Material and methods
2.1. Specimens, locations and preparation
2.1.1. Introduction
The sunflower species used for this study was LG5474, grown in Perrier,
France, in 2010. A separate mechanical characterization was justified by the
fact that the appearance of the bark and pith, and their hygromechanical
properties, were very different. Specimens used in this study were extracted
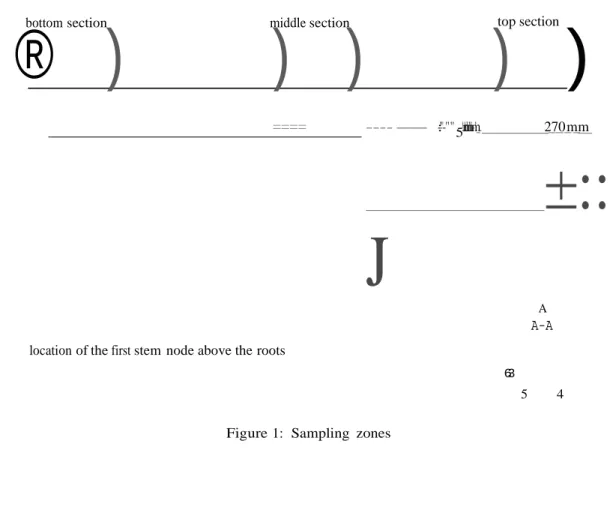
from portions of stems of length 765 mm. For all the stems from which
specimens were cut, the bottom section was chosen at the level of the first
node above the roots. The location of this first node did not significantly
change from one stem to another. Three sampling zones were chosen to
investigate the effect of specimen location on hygromechanical properties.
The first sampling zone was located at the bottom of each stem, the second
at the middle and the third at the top (see Figure 1). These short portions
of stem were then used to cut either bark or pith specimens, but not both at
the same time, because cutting bark specimens damages pith and vice versa.
2.1.2. Bark specimens
For bark specimens, the short portions of stems were divided lengthwise into six parts (see cross section A-A in Figure 1). Bark specimens extracted from the same angular location were noted with the same number (from 1 to 6). The geometry of the specimens was the same for the mechanical and for the hygroscopic tests (see Figure 2) as regards dimensions and inner and
outer surfaces of the bark specimens. To obtain nearly plane specimens and to remove some pith residues, the inner face of the bark was lightly polished with sandpaper. The outer face was not polished, because some stiff fibers (sclerenchyma) are located around the stems; polishing the outer surface would have damaged them, thereby influencing the mechanical properties. These fibers and other stem components are clearly visible in Figure 3, where a typical cross section of sunflower stem is depicted.
For the hygroscopic tests, six specimens cut from two stems were tested for each of the three sections (bottom, middle and top). Three non-adjacent specimens were chosen from each section, for example specimens 1, 3, 5 (see Figure 1). Only three specimens were chosen per section and per stem (and not the whole set of six), because preparing the specimens was time- consuming and intricate. The number of specimens was therefore limited. All these specimens then underwent two different absorption/desorption tests: the specimens were first dried in an oven (see description below) and then exposed to two different levels of relative humidity (33% RH and 75% RH). The same specimens were used for both types of tests. They were dried between each test.
For the mechanical tests, six specimens were prepared for each of the three sections of five different stems. For each section, two of these six specimens located along the same diagonal (for instance 1-4, 2-5 or 3-6) were selected, thus giving each time a set of ten specimens (2 specimens × 5 stems). Three sets of ten specimens were thus obtained for each section location (bottom,
middle and top). Each of these sets was then conditioned at the different values of relative humidity: 0% RH (oven dried), 33% RH, 75% RH as described in Section 2.2.2 below.
2.1.3. Pith specimens
The pith specimens were obtained simply by removing the bark from each short portion of stem. Some typical pith specimens are presented in Figure 4(a). These pith specimens were nearly cylindrical in shape, with a diameter ranging from 15 mm to 25 mm, depending on the stems and on the level where they were cut (see Figure 4(b)). It was surprised to find that the greatest diameter was obtained at the middle of each stem, not at the bottom. On average, the diameter of the pith specimens obtained at the middle of the stem was 1.20 times the value of that obtained at the bottom, and 1.02 times the value of that at the top.
For the hygroscopic tests, five stems were tested and three specimens were extracted from each stem (one at each level), giving a total amount of five specimens per location. These three sets of five specimens (one for each section) underwent the same absorption/desorption tests as the bark specimens.
For the mechanical tests, a procedure similar to the above was followed. Fifteen stems were tested and three cylindrical specimens were extracted from each stem. Compression tests were performed, as explained below. To avoid buckling, it was decided to split each specimen into two different parts
for each level, thus giving 2 × 15 = 30 specimens at each level. The a/l ratio (see Figure 4(b)) ranged from 1 to 2, depending on the specimens. The same RH conditioning procedures as those used for the bark were applied. As the same three different values of RH as for the bark specimens were chosen (see further details in Section 2.2.2 below), 10 specimens were tested at each RH and at each level.
2.2. Hygroscopic tests
2.2.1. Introduction
Hygroscopic tests were performed to determine the moisture diffusion coefficient of both the bark and the pith. The first reason was that the me- chanical tests were performed with specimens conditioned before mechanical testing with various values of RH. Because the testing machine used was not equipped with a conditioning chamber, specimens were first extracted from conditioning chambers where the desired RH values were adjusted (the con- ditioning procedure is explained below). They were then placed in the grips of the testing machine and the tests were finally performed at room tempera- ture and RH. This meant that a certain time elapsed before each mechanical test began, during which the moisture content within the specimens could change. Knowing the moisture diffusion coefficient enabled one to predict the actual moisture content when the test began, thus making it possible to check whether it changed negligibly or not. Assessing the moisture diffusion coefficient was also justified by the fact that it affects the overall insulation
properties of panels reinforced with shredded sunflower stems.
2.2.2. Experimental method
The specimens were first dried in an oven for 48 hours at 60 ◦
C (0% RH). A desiccant (phosphorus pentoxide) was placed in the oven before- hand. The specimens were then placed in two types of conditioning chamber (one for each desired value of RH). These chambers were in fact polymer jars in which saturated aqueous salt solutions were placed. The RH depends on the nature of the salt (see Table 1). These salt solutions were chosen so that the RH was equal to 8%, 33% or 75%. The 8% RH is the value closest to 0% RH that can be obtained with salt solutions, and so was used for the desorption test that followed the absorption test. The moisture diffusion co- efficients were determined using suitable relationships involving the mass of the specimen vs. time and its geometry. The specimens were regularly ex- tracted from the jars and the mass was measured vs. time using a KERNK & Sohn GmbH electronic balance (precision: 0.1 mg). The change in mass is in fact related solely to water uptake or loss. Since absorption and desorption tests were performed, both the absorption and desorption coefficients were deduced from the mass-time curves using suitable relationships depending on the geometry of the specimens. The procedure used to prepare the different solutions corresponding to different RH levels is given in (ISO483). The ab- sorption/desorption tests lasted at least three days to ensure that equilibrium was reached for the specimens. For each hygroscopic test, the experimental
M
moisture ratio Mt/Meq , where Mt is the water uptake/loss measured at time
t and Meq the water uptake/loss measured at equilibrium, were computed
for all the recorded data. From these measurements it is then possible to de- termine the moisture diffusion coefficients. Because two different geometries were used (rectangular parallelepipeds for the bark specimens, cylinders for the pith specimens), two separate diffusion models were employed.
2.2.3. Identification of moisture diffusion coefficients
Fick’s second law was used here to model the diffusion process and de- termine the moisture diffusion coefficients from experimental measurements. This law can be simplified by taking into account the geometry of the spec- imens. It is assumed that specimens were plane sheets for bark specimens and cylinders for pith specimens. For a plane sheet (bark specimens) with sides parallel to the coordinate axes, Fick’s second law only considers the diffusion through the thickness of the plane sheet. It is expressed as follows (Crank, 1975):
∂C (z, t)
∂t = −D
∂2C (z, t)
∂z2 (1)
where C represents the concentration of diffusing substance, D the moisture diffusion coefficient and z the through-thickness direction. In the current case, each homogeneous specimen of bark was considered as a plane sheet of thickness L. Depending on the value of Mt
= ( Mt [ n n ∑ −
of Fick’s second law are as follows (Park, 1986): Mt Meq 4 √ Dt L π Meq � 0.5) 2 (2) ln(1 − Mt ) = ln 8 π Dt − ( Mt ;? 0.5) Meq π2 L2 Meq
Specimens of pith were considered as finite cylinders of length 2l and radius
a. For this geometry, Equation 1 is (Crank, 1975):
∂C 1 { ∂ ( = rD ∂C ) + ∂ ( D ∂C ) + ∂ ( ∂C )} rD (3) ∂t r ∂r ∂r ∂θ r ∂θ ∂z ∂z
The approximate solution for Fick’s second law becomes (Young and Whitaker, 1971): Mt Meq 8 = 1− π2 ∞ ∑ n=1 4 a2α2 exp[−Dα 2 t] ][ ∞ n=0 1 (2n + 1)2 1 ] exp[ D(2n+1)2t( )2 ] l (4) where αn is the nth positive root of J0 (aαn ) and J0 the Bessel function of
zero order.
The moisture diffusion coefficient was determined in each case by mini- mizing a cost function defined by the squared difference between experimental and theoretical values of moisture ratios. The Matlab software (MATLAB version R2009b) was used for this purpose.
2.3. Observations of the bark specimen morphology
Microscopic observations of bark specimens were performed on specimens for the three locations (bottom, middle, top) to correlate the moisture dif- fusion coefficients with the specimen sampling location. The experimental procedure is described below.
First, a section was separated from the stem to obtain a 1 × 1 cm2 spec-
imen. These specimens were then saturated with water, immersed, and kept in three different PEG (polyethylene glycol electrolyte) solution concentra- tions (30%, 60% and 100%) for 24 hours. A specimen of 20 µm thickness was cut using a LEICA RM2255 automatic rotary microtome. This specimen was then stained with the double staining method using safranin and astra blue (safranin indicates the presence of lignin and astra blue that of cellulose). After staining, the samples were dried using Joseph paper, a filter paper also used in chemistry for cleaning and drying. They were then mounted on a cover-slip with a EUKITT fast-drying mounting medium. Finally, pictures of cross sections were obtained using a ZEISS light microscope (magnification:
×4).
2.4. Mechanical tests
The mechanical tests were carried out at room temperature and RH. The influence of moisture content and specimen locations on the mechanical properties was studied. Mechanical properties were deduced by processing the stress-strain curves obtained from the mechanical tests.
Tensile tests were performed on specimens of bark with a DEBEN MI- CROTEST testing machine equipped with a 2 KN load cell. The cross- head speed was equal to 2 mm/min. The specimen clamping length was 30 mm. The longitudinal mechanical properties (Young’s modulus and tensile strength) were deduced from these tests.
As the dimensions of the pith specimens were not suited to the DEBEN MICROTEST testing machine, compression tests were carried out with an INSTRON 5543 testing machine equipped with a 500 N load cell. The cross- head speed was 5 mm/min. The longitudinal mechanical properties (Young’s modulus and compressive yield strength) were deduced from these tests.
3. Results and discussion
3.1. Hygroscopic results
3.1.1. Bark specimens
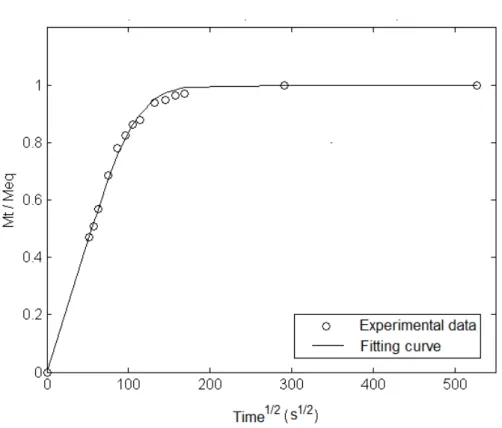
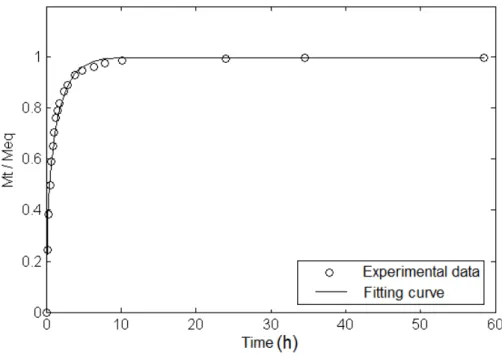
The moisture diffusion coefficients were determined using experimental data and Fick’s second law. A typical best-fitting curve is plotted in Figure 5. The same specimens were used for all the hygroscopic tests (see Section 2.1.2).
Influence of the location of the specimens along the stems
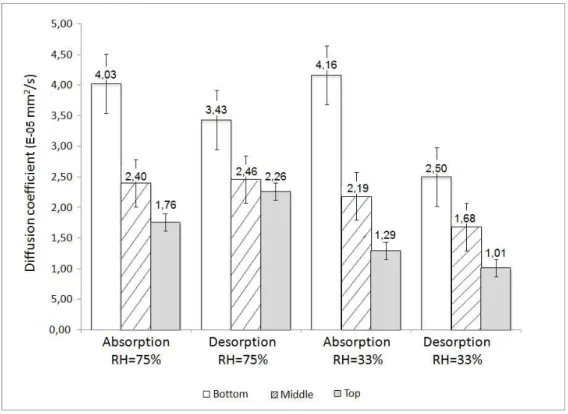
T h e
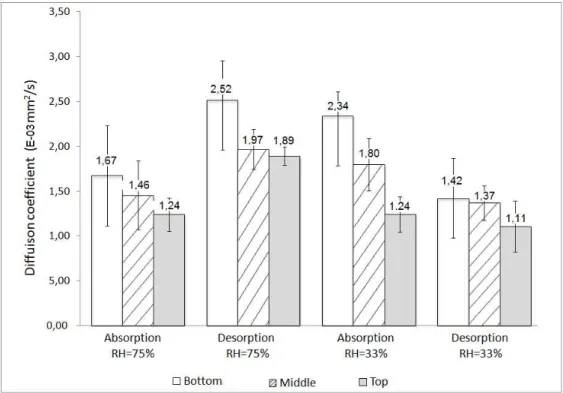
moisture diffusion coefficients of bark specimens are shown in Figure 6 for the three locations, the two conditioning RH (33% and 75%), and the absorption/desorption tests. Each bar in the figure presents the mean value of six specimens obtained from the same height location. The specimen height
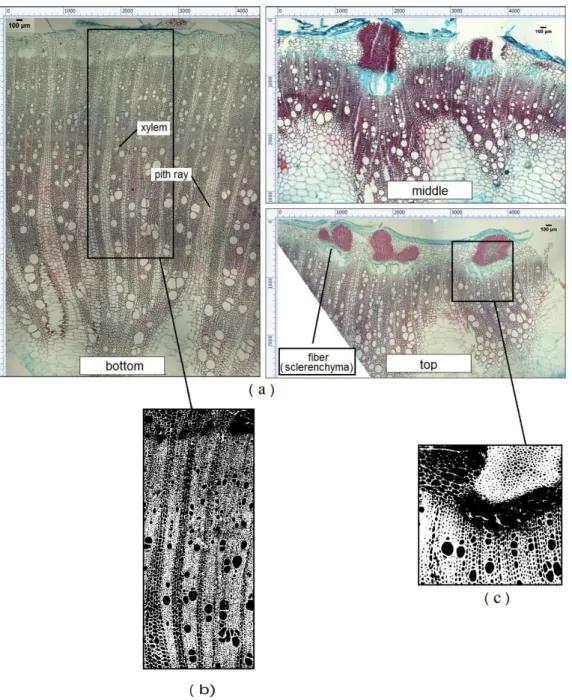
location influences the value of the moisture diffusion coefficient. This value decreases according to the height of the stem: the mean moisture diffusion coefficient (of all the specimens tested in this study) at the bottom of the stem is 2.4 times the value of the moisture diffusion coefficient at the top, and 1.6 times the value of the moisture diffusion coefficient at the middle. This significant difference may be linked to the microscopic structure of the bark. Microscopic morphological observations were performed on the bark extracted at the bottom, middle and top of the stem to find out more about this effect (see Figure 7 (a)).
The microscopic images show that the bark can be considered as a porous medium. The microscopic pores are due to the cell cavities, which are sur- rounded and separated by cell walls. The moisture transport mechanism in the bark is directly linked to these cell cavities, as described and explained for other materials such as wood (Time, 1998). Like the moisture diffusion process in wood (Time, 1998), moisture diffusion in bark is governed by two mechanisms: vapor diffusion through the cell cavities and bound water diffusion through the cell walls. Also, in wood materials (Time, 1998) the moisture diffusion coefficient of cell cavities is much greater than the mois- ture diffusion coefficient of cell walls. It can therefore be considered that the porosity of bark specimens influences the macroscopic diffusion coefficient obtained from the hygroscopic tests. In this case, the increase in porosity or the decrease in cell wall content of specimens may have caused the increase in the moisture diffusion coefficient of specimens. To highlight the influence
of the microscopic porosity on the moisture diffusion coefficient, a porosity analysis was performed.
The porosity (pore fractions and pore sizes) was analyzed using both bottom- and top-sampled microscopic images. The porosity ratios were cal- culated using the ImageJ image processing software (ImageJ-1.440). A rep- resentative part of the microscopic bark structure in each image was chosen for the porosity analysis (see rectangles in Figure 7(a)). The dimensions of these representative parts were chosen according to the dimensions of the bark specimens tested. They also depend on their locations. Binarized fig- ures are presented in Figures 7(b)(c). The pore area fractions were calculated for different size ranges. The results are given in Table 2. They show that bark specimens located at the bottom of the stem have a higher porosity than bark specimens located at the top. This finding can certainly explain the decrease in moisture diffusion coefficient from the bottom to the top of the stem. The value of the moisture diffusion coefficient could be influenced by the nature of the cell walls. The nature of the cell walls is now analyzed. The nature of the cell walls may also influence the value of the moisture diffusion coefficient. The inner part of the bark is mainly composed of xylem and fewer sclerenchyma and parenchyma (pith ray) cells (see Figure 7). The cell walls of xylem and sclerenchyma are most likely to decrease moisture diffusion through the thickness of the bark specimens. This is because their cell walls contain lignin, marked red by safrin in Figure 7. Lignin makes the cell wall hydrophobic (Ek et al., 2009). This could also be demonstrated
by the basic function of xylem, which is to transport water along the stem. Hence cell walls should be able to prevent the water passing through to achieve water transport along the stem (see the circular holes in Figure 7). The presence of parenchyma, xylem and sclerenchyma depends on location along the stem (see Figure 7(a) ):
- for the bottom, middle and top sections, it is observed that the pith ray (parenchyma tissue) extends and forms a channel between the pith and the cortex of the stem. Compared with the cell walls of xylem and sclerenchyma, parenchyma cell walls tend to increase the value of the moisture diffusion coefficient. The presence of parenchyma tissue is very significant in the bark at the bottom of the stems and is less significant at the top. The significant presence of parenchyma cells may help to increase the value of the moisture diffusion coefficient at the bottom of the stem;
- sclerenchyma and xylem were observed at the middle and top sections of the stem. These types of cell may therefore help to lower the value of the moisture diffusion coefficient. This result was confirmed by the results of an exploratory study during which the cellulose and lignin contents were measured. The specimens cut at the bottom and top of five stems, which underwent tensile tests, were first powdered and mixed for each of the two levels. Both resulting powders then under- went chemical analysis to measure the cellulose and lignin contents.
h e r T
The results obtained: 36% and 60% cellulose; 22% and 28% lignin at the bottom and the top, respectively, agree with the difference in mois- ture diffusion coefficients found between these two levels, as moisture diffusion coefficient is related to lignin content, as stated in (Ek et al., 2009);
- the percentage of sclerenchyma per unit volume increases from the mid- dle to the top sections of the stem. As stated above, lignin makes the cell wall hydrophobic (Ek et al., 2009), so one can suppose that the scle- renchyma is more hydrophobic than xylem because its concentration of lignin is higher; see the red color in Figure 7. Since the minimum thickness of the specimens decreases from the bottom to the top, the percentage of sclerenchyma per unit volume increases and so may result in a decrease in the moisture diffusion coefficient.
In sum, porosity and presence of cells directly influence the value of the moisture diffusion coefficient along the stem.
3.1.2. Pith specimens
The moisture diffusion coefficients were identified from the experimental moisture ratio curves, similarly to the bark. A typical fitting curve is plotted in Figure 8. The moisture diffusion coefficient decreases along the stem (see Figure 9), whatever the RH and in both absorption and desorption tests. Taking into consideration the results obtained for all the specimens in this study, the mean moisture diffusion coefficient at the bottom of the stem is
2.2 times that at the top, and 1.2 times that at the middle.
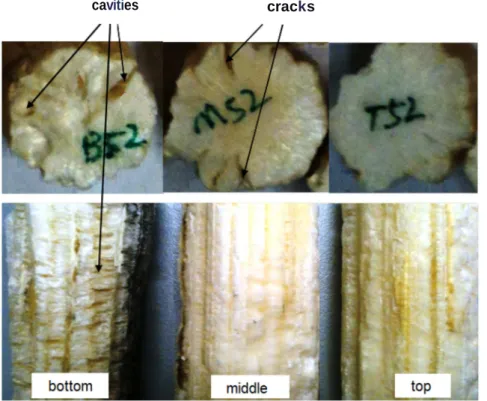
For the pith, vapor diffusion through the cell cavities and bound water diffusion through the cell walls are the main diffusion mechanisms, as for the bark. This finding can be explained by the porosity of the specimens, which depends on location. Figure 10 shows that the bottom-sampled piths have many large cavities. Middle-sampled pith has no cavities but some wide cracks at the edge. No defect is observed for the top-sampled pith. Overall, it can be concluded that the porosity of the pith decreased vs. the specimen location along the stem. Hence one reason for the decrease in moisture diffusion coefficient of the pith is the decrease in porosity along the stem.
3.1.3. Influence of relative humidities and absorption/desorption tests on dif-
fusion coefficients
For both bark and pith, specimens sampled from the same location ex- hibited different diffusion coefficients for all the tests (absorption/desorption, 75% RH/33% RH). These variations could have been caused by various un- controlled factors that may have influenced the experiments: room temper- ature and humidity, moisture concentration of specimens and air velocity around the specimens, which may favor or impede water exchanges between specimens and the outside. However, these factors are not taken into account in the diffusion equations used to determine the diffusion coefficient. Using other experimental equipments can overcome these problems, for example an humidity and temperature controlled oven within a
balance.
3.1.4. Moisture change during specimen mounting in the testing machine
Because the specimens tested with the micro-tensile machine were condi- tioned before testing under a prescribed moisture content in a chamber, the possibility arose of the moisture content within the specimens significantly changing during specimen mounting, thus leading to bias. However, taking a specimen from the chamber and mounting it in the testing machine did not take more than about one minute, and the tests themselves did not last more than one minute for both bark and pith specimens. The moisture diffusion coefficients identified in Sections 3.1.1 and 3.1.2 showed that the moisture content did not significantly evolve during this time period in either type of specimen, so no bias due to this effect could have occurred.
3.2. Mechanical test
3.2.1. Bark specimens
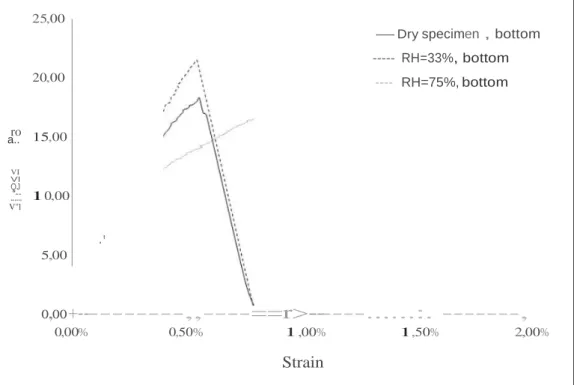
Figure 11 presents typical stress-strain curves obtained at several RH. The stress first evolves at a fairly linear rate. An apparent softening is visible before final failure. Young’s modulus and tensile strength were deduced from the curves. These properties were obtained from a set of 90 specimens cut from five different stems, giving ten specimens at each level and each RH (0%, 33% and 75%). Young’s modulus is calculated in each case by fitting the linear part of the curve to a straight line. The tensile strength is the maximum value reached on each curve. It must be noticed that failure often
occurred near the grips and not at the center of the gauge section. This is presumably due to some local fiber failures that occurred near the grips where the specimens were fixed, and which initiated cracks, causing the specimens to fail. It was found that the mean value of the ultimate elongations of bark specimens on the three RH are: 1.05%(±0.34%) at the bottom, 0.76%(±0.2%) at the middle and 0.62%(±0.15%) at the top. And those values do not vary significantly with the different RH. The influence of both the moisture content and the location of the specimens along the stems on the Young’s modulus and the ultimate strength is discussed below.
Influence of the moisture content
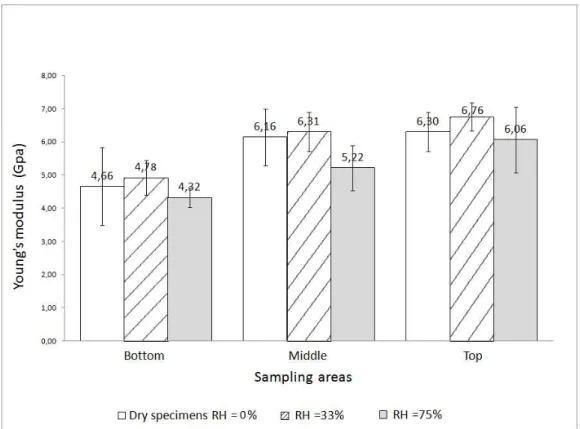
Results presented in Figures 12 and 13 show that the moisture content influences the mechanical properties of bark for all three height locations and all three conditioning RH: 0%, 33% and 75%. Each bar in the two figures represents the mean value of 10 specimens. Specimens conditioned at 33% RH exhibit the highest Young’s modulus. Whatever the height locations of the specimens, this modulus decreases when RH increases from 33% to 75%. This is consistent with results found on various species of wood (Gerhards, 1982). This decrease in elastic modulus was due to the softening of the fiber cell walls. Water in the amorphous region of fiber reduces the interaction forces between molecules, thus facilitating molecular slippage under external effort (Li, 2006). However, results found with dry specimens did not confirm this trend. Even so, one can observe that even though the Young’s modulus
obtained for dry specimens is of the same order of magnitude as that ob- tained at 33% RH, the standard deviation in this case is significant. Hence the conclusion concerning the evolution of Young’s modulus with RH is un- reliable. Further studies with more experimental data and statistic analysis will be done in order to fix this problem.
Similar trends are found for tensile strength: the highest value was found for the specimens conditioned at 33% RH. However, it must be emphasized that the changes in average values are small, and the scatter is significant. Hence it can be reasonably asserted that the moisture content has no real influence on the strength values found.
Influence of the locations of the specimens along the stems
The influence of the location of the specimen along the stems on Young’s modulus seems more clearcut, as it can be observed in Figure 12 that this quantity increases as the location of the specimens along the stem gose from bottom to top. This is probably due to two main effects:
- the porosity decreases along the stem, as discussed in Section 3.1.1 above (see Table 2), and so the Young’s modulus understandably in- creases in step;
- a morphological evolution of the bark is also observed along the stem (see Figure 7). In this figure, it can be observed that:
1. sclerenchyma and xylem fibers contained in bark increase from the bottom to the middle and top section of the stem. As described
in Section 3.1.1, sclerenchyma and xylem fibers contain lignin. Lignin lends stiffness to the cell walls, and so makes the fiber relatively rigid (Ek et al., 2009). The sclerenchyma fibers seems to contain more lignin (see red color in Figure 7) and thus may be stiffer than xylem fibers. This result is also confirmed by the results of the chemical analysis stated in Section 3.1.1, in which the cellulose and lignin contents were found to be greater at the top of stems;
2. the percentage per unit volume of sclerenchyma increases from the middle to the top of the stem. Even though there is no significant increase in amounts of sclerenchyma and xylem fibers from the middle to the top in Figure 7, Young’s modulus increases from the middle to the top. This is because the thickness of the bark (about that of the specimen tested) decreases at the same time, so the percentage per unit volume of sclerenchyma increases, and therefore so does the Young’s modulus.
The variation trends for the tensile strength in Figure 13 is not as clear as that of the Young’s modulus. The strength variation trend from bottom to top are different for each RH. A possible reason is the fact that some fibers were broken inside or close to the grips, causing early failure that did not reflect the real strength value. Changing the shape of the specimens or bonding tabs at the ends would probably limit this negative effect, but this was not readily possible here because of the curvature of the external surface of the stems, and therefore of the bark
specimens. As explained above, it was decided not to polish this external surface to avoid failure or damage of sclerenchyma located at this position.
3.2.2. Pith specimens
Figure 14 shows typical stress-strain curves obtained at several RH levels. The stress evolves first in a fairly linear way. An apparent softening is then visible after the linear part. The curve tends to level off before the end of the test. Young’s modulus and compressive yield strength are deduced from these curves. The Young’s modulus is calculated in each case by fitting the linear part of the curve to a straight line. The yield strength is obtained with an offset strain equal to 0.2%. It was found that the mean value of the ultimate elongations of pith specimens on the three RH are:
2.7%(±0.75%) at the bottom, 2.78%(±0.93%) at the middle and 2.67%(±1%) at the top. Those values do not vary significantly with the different RH at the bottom location, but at the middle location, it decreases 10% and 16% respectively when the RH changes from
0% to 33% and from 33% to 75%. And at the top location it decreases 18% and 15% respectively when the RH changes from 0% to 33% and from 33% to 75%. The influence of both the moisture content and the location of the specimens along the stems on the Young’s modulus and the compressive yield strength is discussed below.
Influence of the moisture content
modulus (see Figure 15), where each bar in the figure represents the mean value of ten specimens. There is a slight decrease in elastic modulus when the conditioning RH decreases from 33% to 0%. A significant decrease in Young’s modulus is observed when the RH for the conditioning increases from 33% to 75%. Like for the bark, this is due to the cell wall softening.
Similar trends are found for the yield compressive strength: the highest mean value is found for the specimens conditioned at 33% RH (see Figure 16, each bar in the figure presents a mean value of ten specimens). The differences between 0% RH and 33% RH are not obvious taking into account the wide scatter. However, the yield strength at 75% RH is obviously the smallest.
Influence of the specimen location
Figure 15 and 16 show that the Young’s modulus and compressive yield strength of pith increase with the specimen location along the stem. The pith is made of only one type of cell: parenchyma. The mechanical properties of the parenchyma cell should not exhibit significant variation along the stem. Therefore, the influence of the specimen location must be mainly due to the decrease in the specimen porosity along the stem, as described in Section 3.1.2.
3.2.3. Characterization of moisture content variation during mechanical test
The specimen moisture content variations during the specimens instal- lation were estimated from the experimental moisture diffusion coefficient
found in Section 3.1.1 and 3.1.2. The time required for specimen mounting was estimated to be about 60 s. Moisture content variations were also deter- mined by measuring the specimen weight before and after testing. Results for bark and pith are shown in Table 3 and 4. It can be observed that the moisture variations estimated by these two methods are close. These vari- ations are not significant, and do not influence the mechanical properties presented in Sections 3.2.1 and 3.2.2.
4. Conclusion
Mechanical properties of sunflower stems were determined for different moisture contents and specimen locations. The results were analyzed accord- ing to the microstructure and chemical composition along the stem. Bark and pith exhibited different mechanical and hygroscopic properties: the Young’s modulus of the bark is much greater than that of the pith, whereas the mois- ture diffusion coefficient of the pith is much greater than that of the bark. The specimen moisture contents influence the mechanical properties of both bark and pith: the Young’s modulus and the strength are highest for 33% RH and lowest for 75% RH. These properties are mainly due to cell composition and cell morphology: bark is composed of sclerenchyma, parenchyma and xylem; pith is composed only of parenchyma. In addition, the morphological structures and porosity of both bark and pith change along the stem, cor- responding to changes in both mechanical and hygroscopic properties: the Young’s modulus and strength of bark and pith increased with the specimen
location along the stem (going up), while the value of the moisture diffusion coefficient decreased.
5. Acknowledgments
The authors thank the French National Research Agency (ANR), C´er´eales Vall´ee and ViaM´eca for financial support (ANR-10-ECOT-004 grant) and Pierre Conchon (INRA) for help in the microstructure observation.
References
Ardanuy, M., Antunes, M., Velasco, J., 2011. Vegetable fibres from agricultural residues as thermo-mechanical reinforcement in recycled polypropylene-based green foams. Waste Management .
Ashori, A., Nourbakhsh, A., 2010. Bio-based composites from waste agricul- tural residues. Waste Management 30, 680–684.
Crank, J., 1975. The mathematics of diffusion. 2nd. Ed., Clarendon Press, Oxford .
DEMETHER, . Demether (anr-10-ecot-004 grant): D´eveloppement de mat´eriaux biosourc´es issus de sous-produits de l’agriculture pour l’isolation thermique des bˆatiments existants. http://demether.cemagref.fr/. Last accessed mar,2012.
Ek, M., Gellerstedt, G., Henriksson, G., 2009. Wood Chemistry and Wood biotechnology. volume 1. De Gruyter.
FAOSTAT, . Fao statistics division 2010: Europe sunflower seed area har- vested. http://faostat.fao.org/DesktopDefault.aspx?PageID=567. Last accessed mar,2012.
Gerhards, C., 1982. Effect of moisture content and temperature on the me- chanical properties of wood: An analysis of immediate effects. Wood and Fiber Science 14, 4–36.
ImageJ-1.440, . Area measurements and particle counting. http://rsbweb. nih.gov/ij/. Last accessed feb,2012.
ISO483, . Plastiques - Petites enceintes de conditionnement et d’essai util- isant des solutions aqueuses pour maintenir l’humidit´e relative `a une valeur constante. NF EN ISO 483 Janvier 2006.
Li, D., 2006. Materials Science of Fiber. China Textile & Apparel Press. MATLAB, . The language of technical computing. http://www.mathworks.
com/products/matlab/. Last accessed mar,2012.
Mohanty, A., Misra, M., Drzal, L., 2005. Natural fibers, biopolymers, and biocomposites. CRC.
Nourbakhsh, A., Ashori, A., 2010. Wood plastic composites from agro-waste materials: Analysis of mechanical properties. Bioresource technology 101, 2525–2528.
2 Panthapulakkal, S., Zereshkian, A., Sain, M., 2006. Preparation and char-
acterization of wheat straw fibers for reinforcing application in injection molded thermoplastic composites. Bioresource technology 97, 265–272. Park, G., 1986. Transport principles-solution, diffusion and permeation in
polymer membranes. Synthetic membranes–science, engineering, and ap- plications 181, 57–107.
Tiftickjian, J., . A sunflower stem with its vascular bundles in a sin- gle ring. http://www.doctortee.com/dsu/tiftickjian/plant- anat/ stem.html. Last accessed feb,2012.
Time, B., 1998. Hygroscopic moisture, transport in wood. Norwegian Univ. of Science and Technology.
Wang, D., Sun, X., 2002. Low density particleboard from wheat straw and corn pith. Industrial Crops and Products 15, 43–50.
White, N., Ansell, M., 1983. Straw-reinforced polyester composites. Journal of Materials Science 18, 1549–1556.
Yang, H., Kim, D., Kim, H., 2003. Rice straw-wood particle composite for sound absorbing wooden construction materials. Bioresource Technology 86, 117–121.
Young, J., Whitaker, T., 1971. Evaluation of the diffusion equation for describing thin-layer drying of peanuts in the hull. Transactions of the ASAE 14, 309–312.
®
)
) )
)
)
r--t>A
bottom section middle section top section
d ====
270m:m
---- -- -:-'"-'--"" 5!m..m!J"m-'_. 2_7_0_m_m
±::
J
location of the first stem node above the roots
Figure 1: Sampling zones
A
A-A
63
inside
outside
/
r---
-
-
-
-
-
---
- -
:'·L:1.2- 3mm1,.. ..//7- 10mm
55 -60mm
(a) Picture of a specimen (b) Dimensions of the bark specimens
(a) Picture (b) Micrography (Tiftickjian)
(a) Pith at different locations (b) Dimensions of pith specimens Figure 4: Pith specimen
( b)
Figure 7: (a) : Micrography of various cross sections of bark sampled from different loca-
cavities cracks
cross
section
a... 25,00
20,00
ro 15,00
-Dry specimen , bottom
--- RH=33%, bottom ---- RH=75%, bottom VI VI QJ ."..-..-. V"l 10,00 ·' 5,00 o,oo+---,,----==r>---...:. ---, 0,00% 0,50% 1,00% 1,50% 2,00% Strain
c c '-45,00 re 40,00 c. .s:::: 35,00 30 97 1iD 30,00 Q) 25 43 26 75 +" Vl 25,00 _E:! Vl 20,00 Q) +" Q) + re" 15,00 E .:= 10,00 ::J 5,00 26 52 27 91 0,00 Bottom Middle Sampling areas Top D Dry specimens RH = 0 % (21 RH =33% 0 RH =75% Figure 13: Tensile strengt h of bark
"
.'
4,00 N 3,50 0w
3,00 .s::. bD c:: 2,50 Q ....). +" "' 2,00 Q) > Q) 1,50 >1
3.04 Q " ....'.· c. 1,00 E 0,50 0 u 0,00 Bottom Middle Sa mpling areas Topo Dry specimens RH = o % IL:l RH =33% 0 RH =75%
Saturated aqueous RH (%) at different temperatures salt solutions 20 ◦ C 25 ◦ C 30 ◦ C 35 ◦ C Potassium hydroxide 9 8 7 7 Magnesium chloride hexahydrate 33 33 32 32
Sodium chloride 75 75 75 75
Area range of pore Pore area fraction (µm2) Bottom Top 0-500 13.0 12.7 500-1500 8.1 3.9 >1500 37.5 36.2 Total 58.5 52.9
Specimen conditioning RH Moisture content at equilibrium state Moisture co Using Daverage ntent variation Experimental 75% 12.94 -0.88 -1.14 33% 4.83 -0.23 -0.23 0% 0 0.54 0.51
Specimen conditioning RH Moisture content at equilibrium state Moisture co Using Daverage ntent variation Experimental 75% 15.86 -1.67 -2.63 33% 6.53 -0.69 -0.31 0% 0 1.18 1.28