HAL Id: hal-00295795
https://hal.archives-ouvertes.fr/hal-00295795
Submitted on 5 Dec 2005
HAL is a multi-disciplinary open access
archive for the deposit and dissemination of
sci-entific research documents, whether they are
pub-lished or not. The documents may come from
teaching and research institutions in France or
abroad, or from public or private research centers.
L’archive ouverte pluridisciplinaire HAL, est
destinée au dépôt et à la diffusion de documents
scientifiques de niveau recherche, publiés ou non,
émanant des établissements d’enseignement et de
recherche français ou étrangers, des laboratoires
publics ou privés.
and its precursors in a chemistry-climate model
R. M. Doherty, D. S. Stevenson, W. J. Collins, M. G. Sanderson
To cite this version:
R. M. Doherty, D. S. Stevenson, W. J. Collins, M. G. Sanderson. Influence of convective transport
on tropospheric ozone and its precursors in a chemistry-climate model. Atmospheric Chemistry and
Physics, European Geosciences Union, 2005, 5 (12), pp.3205-3218. �hal-00295795�
www.atmos-chem-phys.org/acp/5/3205/ SRef-ID: 1680-7324/acp/2005-5-3205 European Geosciences Union
Chemistry
and Physics
Influence of convective transport on tropospheric ozone and its
precursors in a chemistry-climate model
R. M. Doherty1, D. S. Stevenson1, W. J. Collins2, and M. G. Sanderson2
1Institute of Atmospheric and Environmental Science, University of Edinburgh, Edinburgh, UK 2Hadley Centre for Climate Prediction and Research, Met Office, Exeter, UK
Received: 1 April 2005 – Published in Atmos. Chem. Phys. Discuss.: 7 June 2005
Revised: 29 September 2005 – Accepted: 10 November 2005 – Published: 5 December 2005
Abstract. The impact of convection on tropospheric O3and
its precursors has been examined in a coupled chemistry-climate model. There are two ways that convection affects O3. First, convection affects O3by vertical mixing of O3 it-self. Convection lifts lower tropospheric air to regions where the O3 lifetime is longer, whilst mass-balance subsidence mixes O3-rich upper tropospheric (UT) air downwards to re-gions where the O3lifetime is shorter. This tends to decrease UT O3and the overall tropospheric column of O3. Secondly, convection affects O3 by vertical mixing of O3 precursors. This affects O3 chemical production and destruction. Con-vection transports isoprene and its degradation products to
the UT where they interact with lightning NOx to produce
PAN, at the expense of NOx. In our model, we find that con-vection reduces UT NOxthrough this mechanism; convective down-mixing also flattens our imposed profile of lightning
emissions, further reducing UT NOx. Over tropical land,
which has large lightning NOxemissions in the UT, we find convective lofting of NOxfrom surface sources appears rela-tively unimportant. Despite UT NOxdecreases, UT O3 pro-duction increases as a result of UT HOxincreases driven by isoprene oxidation chemistry. However, UT O3tends to de-crease, as the effect of convective overturning of O3 itself dominates over changes in O3chemistry. Convective trans-port also reduces UT O3in the mid-latitudes resulting in a
13% decrease in the global tropospheric O3burden. These
results contrast with an earlier study that uses a model of sim-ilar chemical complexity. Differences in convection schemes as well as chemistry schemes – in particular isoprene-driven changes are the most likely causes of such discrepancies. Further modelling studies are needed to constrain this un-certainty range.
Correspondence to: R. M. Doherty
(ruth@met.ed.ac.uk)
1 Introduction
The parameterisation of sub-grid scale convection is known to be a major uncertainty in both chemistry transport
mod-els (CTMs) and general circulation modmod-els (GCMs). A
substantial element of divergence amongst CTM simula-tions arises from differences in convection parameterisation schemes, which have a particularly large influence on the distributions of short-lived species such as NOx(NO+NO2), HOx(OH+HO2), and ozone (O3)(Prather and Jacob, 1997; Collins et al., 1999; Prather et al., 2001; Gauss et al., 2003; Lawrence and Rasch, 2005). Future emissions projections (e.g., Nakicenovic et al., 2000) indicate strong growth of O3precursor emissions in the tropics – how these are pro-cessed by convection will be an important determinant of fu-ture O3concentrations and the oxidising capacity of the at-mosphere. GCM simulations project future regional changes in the distribution of convection over many parts of the globe (Cubasch et al., 2001). On interannual timescales shifts in convection associated with the El Ni˜no Southern Oscillation modulate tropical tropsopheric chemistry variability (Ziemke and Chandra, 2003). Convection is therefore important in the context of understanding how climate variability and fu-ture climate change may affect tropospheric chemistry, via changes in both vertical mixing and the distribution of light-ning NOx(e.g., Stevenson et al., 2005a).
Since O3, its lifetime and its production efficiency per NOx molecule all typically increase with height, deep con-vection strongly affects O3and its precursors throughout the tropical tropospheric column (TTC), as shown in numerous measurement and modelling studies (e.g. Dickerson et al., 1987; Pickering et al., 1990, 1995). Considering O3in iso-lation, increased vertical mixing tends to lower TTC O3, as O3-poor air mixes upwards, to regions where its lifetime is longer, whilst O3-rich air mixes downwards through mass-balance subsidence, to regions where its lifetime is shorter (e.g., Lelieveld and Crutzen, 1994; Lawrence et al., 2003).
However, the effects of convection on O3 precursors also need to be considered. Where there are surface O3 precur-sor sources, especially short-lived ones such as NOx, iso-prene (C5H8)and other natural or anthropogenic hydrocar-bons, convection significantly increases these precursor con-centrations in the mid- and upper-troposphere (MT and UT) at the expense of lower troposphere (LT). Collins et al. (1999) and von Kuhlmann et al. (2004) identify convective uplifting of isoprene and its degradation products as a major source of tropical UT HOx. Lawrence et al. (2003) find that loft-ing of surface NOxis a significant driver of increases in O3 production over much of the tropospheric column. Light-ning in the tropics is a major NOxsource directly associated
with convection, with most NOx added to the UT
(Picker-ing et al., 1998). There are also potential interactions be-tween isoprene and lightning emissions (e.g., von Kuhlmann et al., 2004). An important isoprene degradation product is the peroxy acetyl radical (CH3COO2), which can affect NOx by promoting PAN formation over land areas where isoprene
and lightning NOx emissions are co-located. The net
im-pact of convective mixing is thus sensitive to the profile of O3and its precursors prior to convection, and is a complex balance between transport and a variety of chemical effects. Lawrence et al. (2003) found the effect of convective changes in precursor emissions on the tropospheric O3burden to be more important than the convective redistribution of O3.
In this paper, the role of convective mixing in determining the distribution of O3and its precursors is investigated using the STOCHEM-HadAM3 coupled chemistry-climate model. Section 2 describes the model and the experiments. Section 3 describes the distribution of convection and evaluates model results with observations. Then the influence of convection on O3, its precursors and on O3production and destruction is discussed for tropical land and ocean. Changes to the global O3budget related to convection are then outlined. Section 4 discusses the results of this paper compared to those from other studies, highlights model differences and uncertainties; Sect. 5 presents conclusions.
2 Model and experiments
The current version of STOCHEM-HadAM3 coupled CTM-GCM model has been described in detail in previous stud-ies (Sanderson et al., 2003a, b; Stevenson et al., 2004), so we present a limited description of relevant model processes here. HadAM3 (Pope et al., 2000) is the atmospheric com-ponent of the HadCM3 atmosphere-ocean general circulation model (GCM). HadAM3 was driven by prescribed monthly sea-surface temperatures (SSTs) for 1980–2002 and was run at standard resolution of 3.75◦longitude by 2.5◦latitude and 19 vertical levels. These levels are concentrated at the sur-face and extend to 10 hPa. Meteorological fields are passed to the CTM every 3 h.
STOCHEM is a Lagrangian tropospheric CTM, first de-scribed by Collins et al. (1997), with subsequent major up-dates to the chemistry (Collins et al., 1999), convection (Collins et al., 2002) and deposition schemes (Sanderson et al., 2003a). Its atmosphere is divided into 50 000 equal mass air parcels that are advected by HadAM3 winds. Air parcels are mapped onto a 5◦longitude by 5◦latitude hori-zontal grid with 9 equally spaced vertical levels, which
ex-tends from the surface to ∼100 hPa. Stratospheric O3
in-flux, calculated from a present-day stratospheric O3 climatol-ogy (Li and Shine, 1995), is distributed into the troposphere by HadAM3 vertical winds at 100 hPa as a flux term. This means that the stratospheric influx should not be affected by
convective mixing, since neither the 100 hPa winds or O3
climatology are changed; the small change in inferred O3
stratospheric influx (calculated as a residual term) in Table 1 (Sect. 3.4) reflects random differences in air parcel sampling of the atmosphere between model simulations. Stratospheric input of HNO3is modelled similarly assuming a fixed N: O3 ratio of 1:1000 (Murphy and Fahey, 1994). In this study, the chemical fields from STOCHEM are not fed back into the radiation scheme in HadAM3.
The convection scheme in HadAM3 is a bulk mass-flux scheme with an instability closure (Gregory et al., 1997) and is based on that of Tiedtke (1989). STOCHEM uses the Collins et al. (2002) Lagrangian convective mixing scheme. This mixing scheme uses the 3-D convective updraught mass fluxes generated from HadAM3 and represents rapid convec-tive updraughts, entrainment and detrainment of air parcels, and slower mass balance subsidence of larger regions of surrounding air. Although downdraughts are calculated in the GCM convection scheme, these are not implemented in the mixing scheme. Collins et al. (2002) compare simu-lated radon (222Rn) profiles against available measurements. These were summertime mid-latitude continental and coastal sites. The Lagrangian mixing scheme compares favourably with observations in the continental regions. In coastal re-gions, the model underestimates radon in the boundary layer but elsewhere shows good agreement. Tropical surface sim-ulations of222Rn were also evaluated, and similar results to those of earlier modelling studies were found – with222Rn underestimates in spring at Mauna Loa, and222Rn overesti-mates/underestimates in spring/summer at Bermuda. Further details can be found in Collins et al. (2002).
Generation of lightning NOx is linked to the convection scheme following Price et al. (1997). Convective precipita-tion from HadAM3 is used to identify lightning occurrence, and cloud height and thickness used to calculate the num-ber of flashes for marine and continental clouds. The global production of lightning NO is scaled to be roughly 7 Tg N/yr and global isoprene emissions are ∼575 Tg yr−1. The pro-files of Pickering et al. (1998) are used to vertically dis-tribute the lightning NOxemissions for three regimes: mid-latitude continental, tropical continental and tropical ma-rine; mid-latitude marine regions are treated like tropical
marine regions. For these three regimes most lightning NOx (55–75% depending on regime) is emitted in the UT above
8 km. The modelled global annual-average lightning NOx
spatial distribution is in fairly good agreement with the light-ning flash rate recently derived from satellite by Christian et al. (2003). Note that only a qualitative comparison is possi-ble since NO emissions are not directly proportional to the total number of flashes, as the cloud-to-ground and inter-cloud flashes produce different amounts of NOx. However, the global annual land to ocean ratio of lightning NOx emis-sions in our model is ∼30:1, whilst the land/ocean lightning flash rate derived by Christian et al. (2003) is 10:1. Since modelled and observed precipitation climatologies have high spatial agreement (not shown), this suggests that oceanic lightning NOx is underestimated by the Price et al. (1997) scheme. This was also found by Labrador et al. (2005). In our model set-up we use the Pickering et al. (1998) vertical profiles to distribute lightning NOxemissions in all simula-tions (even when convective mixing is switched off). Conse-quently, in the control experiment these distributed emissions are then also subject to convective mixing once they enter the model transport and mixing schemes.
Two experiments were performed for the period 1980– 2000: a “control” experiment with normal convective mixing of O3and its precursors, and a “convection off” experiment with no convective mixing of O3or its precursors, although convection in the climate model and lightning NOxemissions (see above) still occur. Water vapour concentrations also do not change between the two experiments.
Anthropogenic and natural emissions of global trace gases in both experiments are identical. Anthropogenic emissions come from the SRES A2 scenario (Naki´cenovi´c et al., 2000) for the present-day period. Note that emissions from all the different SRES scenarios are similar over this period. Nat-ural emissions are as given in Stevenson et al. (2004). For analysis, two different tropopause definitions were used: (i) a chemical tropopause defined using the 150 ppbv O3isopleth (the definition used by Prather et al. (2001); and (ii) a physi-cal tropopause based on the WMO definition and diagnosed in HadAM3. In both cases the same tropopause mask was used for the analysis of the control and convection off sim-ulations. For the chemical tropopause this involved masking
any grid boxes where monthly-mean O3 mixing ratios
ex-ceeded 150 ppbv in either of the two simulations.
3 Results
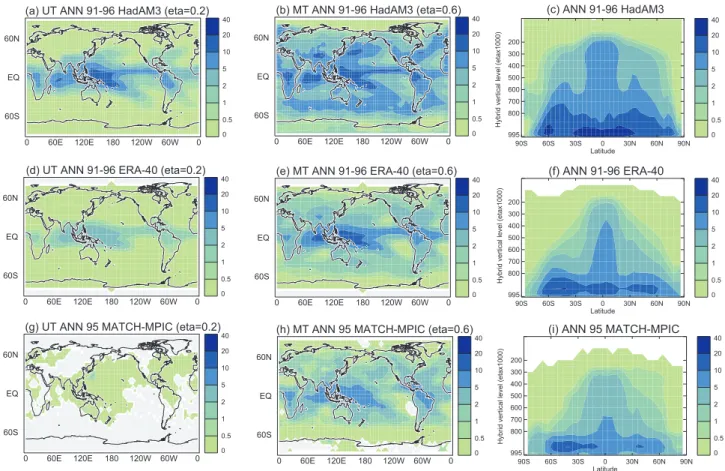
Figure 1a depicts annual-average convective updraught mass fluxes from HadAM3 for 1991–1996 (to be coincident with the ERA-40 renalayses period, see below). Deep convection in the inter-tropical convergence zone (ITCZ) and South Pa-cific Convergence Zone is clearly delineated (Figs. 1a, b). Substantial convection at ∼200 hPa (eta=0.2) can also be seen over SE Asia , southern N America, and E Siberia/Japan
(Fig. 1a). Convection that extends up to the MT is also de-picted in the tropics and in mid-latitudes, particularly over the southern oceans and northern continents, and is typically associated with frontal activity (Fig. 1b). The anomalies over the Himalayas are non-precipitating convection and appear to be a consequence of model orography. Convective updraught mass fluxes from ERA-40 reanalyses (“on-line” fluxes – see Sect. 4; Olivi´e et al., 2004) are displayed in Figs. 1d–f. Com-pared to ERA-40, HadAM3 has higher mass fluxes (by up to a factor of 2) and convection also generally reaches greater altitudes (Figs. 1c, f). It should be stressed that the distri-bution and strength of convection are poorly constrained by observations, and it is not obvious that ERA-40 values reflect the real atmosphere, although they perhaps represent our best current estimate.
3.1 Evaluation of modelled NOx, PAN and O3against
ob-servations
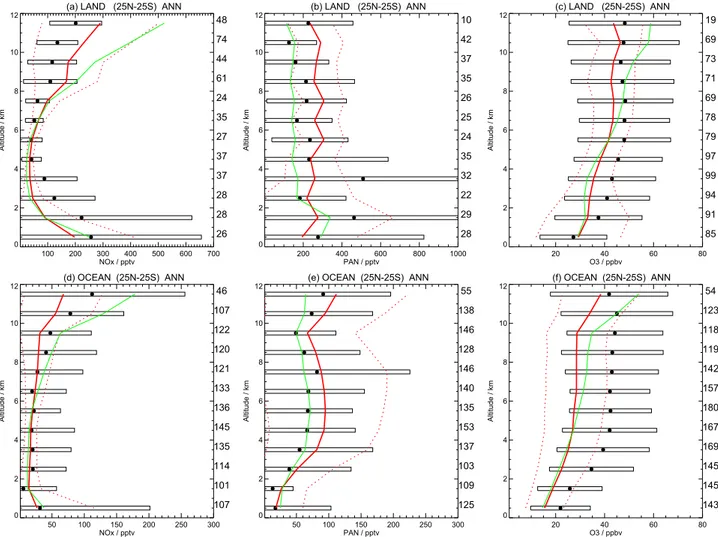
Several aircraft campaigns have measured atmospheric com-position, and these provide useful data to evaluate model simulations. Emmons et al. (2000) produced data compos-ites for several species, including NOx, PAN and O3– these have been updated to incorporate subsequent campaigns, and the data have been binned onto a 5◦×5◦×1 km grid (see http://gctm.acd.ucar.edu/data). Figure 2 plots annual mean profiles for the tropics over land and ocean. Each point in the vertical profile represents the mean of several grid boxes – in turn these represent the mean of several aircraft mea-surements. The numbers adjacent to the right-hand verti-cal axis indicate the number of grid boxes contributing to the mean. In addition, the standard deviation of the grid boxes is depicted by a box surrounding the mean value. It should be noted that these observed profiles sample only a small fraction of the atmosphere, both spatially and tempo-rally. Also plotted in Fig. 2 are model results, sampled in the same way as the mean observations for the control (solid red line) and convection off simulations (solid green line). The ±1 standard deviation for the control simulation is also de-picted (red dashed line). Annual-mean profiles for the mid-latitudes can be seen at http://www.met.ed.ac.uk/∼dstevens/ convection paper/midlatseval.pdf.
Figures 2a and d are for NOx, and show a “C”-shaped pro-file over land. Over tropical land, the model somewhat un-derestimates NOxin the LT, and overestimates NOx in the UT. This may be due to over-vigorous convection, or per-haps deficiencies in either the lightning NOxemission pro-files and/or our application of these in STOCHEM as dis-cussed in Sect. 2. In a parallel study, with perturbed lightning NOx emissions, we found that a reduction in global light-ning NO production from 7 to 3.5 Tg N/yr led to an under-estimate of tropical UT NOx, and a larger underestimate of mid-latitude MT NOx(see below). Over the oceans, the LT is better represented, but here UT NOxis underestimated. This may reflect an underestimate of lightning over the oceans
0 0.5 1 2 5 10 20 40 0 60E 120E 180 120W 60W 0 60S EQ 60N
(a) UT ANN 91-96 HadAM3 (eta=0.2)
0 0.5 1 2 5 10 20 40 0 60E 120E 180 120W 60W 0 60S EQ 60N
(b) MT ANN 91-96 HadAM3 (eta=0.6)
0 0.5 1 2 5 10 20 40 90S 60S 30S 0 30N 60N 90N Latitude 995 800 700 600 500 400 300 200 H yb rid v er tic al le ve l ( et ax 10 00 ) 0 0.5 1 2 5 10 20 40 0 60E 120E 180 120W 60W 0 60S EQ 60N
(d) UT ANN 91-96 ERA-40 (eta=0.2)
0 0.5 1 2 5 10 20 40 0 60E 120E 180 120W 60W 0 60S EQ 60N
(e) MT ANN 91-96 ERA-40 (eta=0.6)
0 0.5 1 2 5 10 20 40 (f) ANN 91-96 ERA-40 90S 60S 30S 0 30N 60N 90N Latitude 995 800 700 600 500 400 300 200 (c) ANN 91-96 HadAM3 0 0.5 1 2 5 10 20 40 0 60E 120E 180 120W 60W 0 60S EQ 60N
(g) UT ANN 95 MATCH-MPIC (eta=0.2)
0 0.5 1 2 5 10 20 40 0 60E 120E 180 120W 60W 0 60S EQ 60N
(h) MT ANN 95 MATCH-MPIC (eta=0.6)
0 0.5 1 2 5 10 20 40
(i) ANN 95 MATCH-MPIC
90S 60S 30S 0 30N 60N 90N Latitude 995 800 700 600 500 400 300 200 H yb rid v er tic al le ve l ( et ax 10 00 ) H yb rid v er tic al le ve l ( et ax 10 00 )
Fig. 1. Annual-average convective updraught mass fluxes (g/m2/s) in the UT (eta=0.2, ∼200 hPa), MT (eta=0.6∼600 hPa) and zonal-mean
vs. altitude fluxes derived from HadAM3 (1991–1996) (a–c), ERA-40 reanalayses (1991–1996) (d–f) and MATCH-MPIC (1995) (g–i).
compared to the land. As discussed in Sect. 2, the model’s interactive lightning scheme generates a land:ocean ratio in lightning NOxemissions that is rather more land-biased than recent satellite observations suggest. Nevertheless, model and observations are nearly always within a standard devi-ation of each other. The convection off profile (in green)
clearly shows the strong enhancement in tropical UT NOx
that occurs when convective mixing is switched off; this is partially due to the fact that the lightning NOxprofile is still applied in the convection off case, and there is less
down-mixing of this major UT NOx source. In the mid-latitudes
UT NOxis underestimated and LT NOxoverestimated,
par-ticularly over land (not shown). This could suggest too lit-tle convective mixing in mid-latitudes (although this would be surprising given that HadAM3 convective updraught mass fluxes are stronger than those derived from ERA-40
reanal-yses, as discussed in Sect. 3). Underestimates in UT NOx
may also arise because of PAN over-production (see below) or under-estimation of mid-latitude lightning NOxsources.
Figures 2b and e show PAN profiles, and again show gen-erally good agreement, although with a slight tendency for the model to overestimate PAN, particularly in the UT. This tendency for the model to overestimate PAN is more evident
in northern mid-latitudes (not shown), and may reflect over-production of the peroxy acetyl radical from higher hydrocar-bons. The convection off profile for the tropics clearly shows the major influence of convection on PAN in the model, al-most doubling its MT and UT concentrations over land, due to the vertical lofting of relatively short-lived hydrocarbons and their degradation products (in particular isoprene-related species). In turn, convection-enhanced PAN formation con-tributes to the reductions in UT NOx(Figs. 2a and d).
Finally, Figs. 2c and f show tropical O3 profiles. The
model typically underestimates O3throughout the profile, by around 5–10 ppbv over land and 10–15 ppbv over the ocean. A similar underestimate was also found for the same model (but with slightly different emissions) in the O3 evaluation against ozonesonde data performed in Stevenson et al. (2004) and Dentener et al. (2005). It seems likely that the O3 de-struction chemistry is rather too active in the model – in a recent model inter-comparison (Stevenson et al., 2005b), the STOCHEM model coupled to HadAM3 had the shortest tro-pospheric O3lifetime of all the models sampled. The ozone lifetime is mainly determined by the flux through the main O3sink (O(1D)+H2O). This reaction is also the main source of OH. The model’s methane lifetime (and hence tropical
(a) LAND (25N-25S) ANN 100 200 300 400 500 600 700 NOx / pptv 0 2 4 6 8 10 12 A lti tu de / km 26 28 28 37 37 27 35 24 61 44 74 48 (d) OCEAN (25N-25S) ANN 50 100 150 200 250 300 NOx / pptv 0 2 4 6 8 10 12 A lti tu de / km 107 101 114 135 145 136 133 121 120 122 107 46 (b) LAND (25N-25S) ANN 200 400 600 800 1000 PAN / pptv 0 2 4 6 8 10 12 A lti tu de / km 28 29 22 32 35 24 25 26 35 37 42 10
(e) OCEAN (25N-25S) ANN
50 100 150 200 250 300 PAN / pptv 0 2 4 6 8 10 12 A lti tu de / km 125 109 103 137 153 135 140 146 128 146 138 55 (c) LAND (25N-25S) ANN 20 40 60 80 O3 / ppbv 0 2 4 6 8 10 12 A lti tu de / km 85 91 94 99 97 79 78 69 71 73 69 19 (f) OCEAN (25N-25S) ANN 20 40 60 80 O3 / ppbv 0 2 4 6 8 10 12 A lti tu de / km 143 145 145 169 167 180 157 142 119 118 123 54
Fig. 2. NOx(a, b), PAN (c, d) and O3(e, f) simulated and observed profiles over tropical land and ocean. The points represent annual mean
tropical (25◦N–25◦S) profiles and are mean values of gridded aircraft measurements from the SASS database http://gctm.acd.ucar.edu/data (Emmons et al., 2000). The numbers adjacent to the right-hand vertical axis indicate the number of grid boxes contributing to the mean. The standard deviation is depicted by a box surrounding the mean value. The curves represent HadAM3-STOCHEM model mean values for the same spatial and temporal locations as the observations for the control (red) and convection off (green) simulations. The standard deviation for the control simulation is denoted by dashed lines.
OH) was found to be near the central estimate of Prather et al. (2001), and close to the model average in the same inter-comparison; this suggests that the OH source term is approximately correct. It may be that the second largest O3 sink (reaction with HO2)is overestimated by the model – this may tie in with the potentially over-active hydrocarbon chemistry suggested by the high PAN levels. At this stage, we do not fully understand the low O3bias in the tropics. In the mid-latitudes this bias is smaller and is confined to the LT and MT.
These model comparisons against observations indicate the model has some skill in simulating NOx, PAN and O3, but also has some significant biases. Nevertheless, the model is generally within ±1 standard deviation of observations, and represents a comparable model to others used for similar
studies to assess the influence of convective mixing upon O3 and its precursors.
3.2 Influence of convection over tropical land and ocean
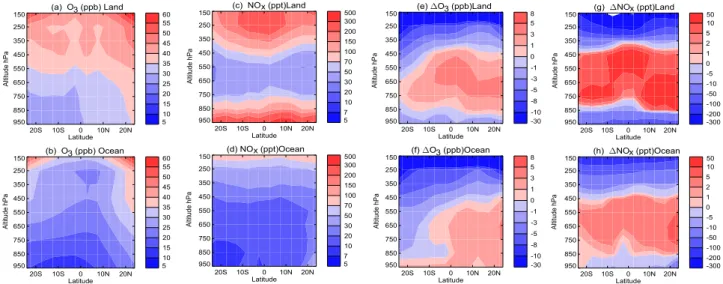
Figure 3 depicts annual zonal mean tropical O3 and NOx
concentrations for tropical land and ocean regions separately (Figs. 3a–d) for the control experiment (i.e. normal convec-tive mixing) and the impact of switching on convecconvec-tive mix-ing (Figs. 3e–h). Many of the features described below can be seen in the model profiles in Fig. 2. For simplicity we discuss Fig. 3 results alone below.
Both species are generally higher over land, where the main NOxsurface and UT lightning sources are located. The O3lifetime and production efficiency increase with height – these factors, in conjunction with the stratospheric source of
5 10 15 20 25 30 35 40 45 50 55 60 (a) O3 (ppb) Land 20S 10S 0 10N 20N Latitude 950 850 750 650 550 450 350 250 150 -30 -10 -8 -5 -3 -1 0 1 3 5 8 (e) DO3 (ppb)Land
20S 10S 0 10N 20N Latitude 950 850 750 650 550 450 350 250 150 5 7 10 20 30 50 70 100 150 200 300 500 (c) NOx (ppt)Land 20S 10S 0 10N 20N Latitude 950 850 750 650 550 450 350 250 150 -300 -200 -100 -50 -10 -5 0 1 2 5 10 50 (g) DNOx (ppt)Land 20S 10S 0 10N 20N Latitude 950 850 750 650 550 450 350 250 150 5 10 15 20 25 30 35 40 45 50 55 60 (b) O3 (ppb) Ocean 20S 10S 0 10N 20N Latitude 950 850 750 650 550 450 350 250 150 Al tit ud e hP a -30 -10 -8 -5 -3 -1 0 1 3 5 8 (f) DO3 (ppb)Ocean 20S 10S 0 10N 20N Latitude 950 850 750 650 550 450 350 250 150 5 7 10 20 30 50 70 100 150 200 300 500 (d) NOx (ppt)Ocean 20S 10S 0 10N 20N Latitude 950 850 750 650 550 450 350 250 150 -300 -200 -100 -50 -10 -5 0 1 2 5 10 50 (h) DNOx (ppt)Ocean 20S 10S 0 10N 20N Latitude 950 850 750 650 550 450 350 250 150 Al tit ud e hP a Al tit ud e hP a Al tit ud e hP a Al tit ud e hP a Al tit ud e hP a Al tit ud e hP a Al tit ud e hP a
Fig. 3. 20-year average tropical land and ocean O3(ppb) (a, b) and NOx(ppt) (c, d) for the control simulation and O3(e, f) and NOx(g, h)
differences control – convection off simulations.
O3– produce the O3 gradient from the surface (25–35 ppb over land, 10–25 ppb over oceans) to the UT (40–60 ppb over land, 30–55 ppb over oceans) (Figs. 3a–b). There are
comparable NOxmixing ratios in the LT and UT over land
(“C”-shaped profile – Fig. 3c; above 100 ppt in the LT and UT). Over the oceans UT NOxis also high (Fig. 3d). Based on the large land/ocean lightning ratio we assume that high values of UT NOxover the oceans arises from advection of UT land lightning NOxemissions (with a small contribution from lightning over the oceans, Sect. 2).
Both land and ocean regions show large decreases in UT O3(10–30 ppb) and NOx(up to 100–300 ppt over land; 50– 200 ppt over the ocean) due to convection (Figs. 3e–h). LT
O3and NOx also decrease over land regions (1–3 ppb and
10–100 ppt, respectively, Figs. 3e, g), but show divergent behaviour over the ocean, where O3 increases slightly (0– 3 ppb), whilst NOxdecreases slightly (5–10 ppt) (Figs. 3f, h). Conversely, MT O3and NOxgenerally increase over land (by 0–5 ppb and 2–50 ppt, Figs. 3e, g), and over the oceans north of 10◦S. Over the remote oceans, south of 10◦S, MT O3 de-creases (0–5 ppb) and MT NOxincreases slightly (0–5 ppt) (Figs. 3f, h).
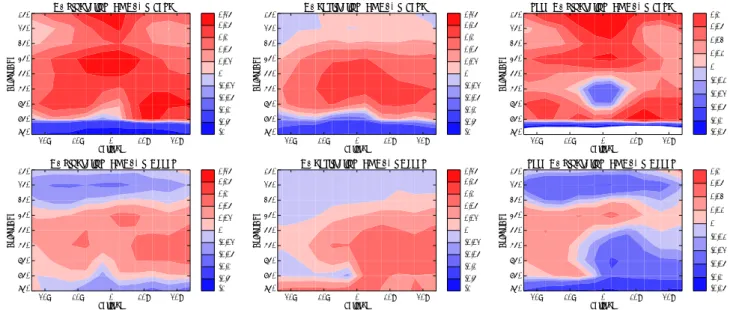
Figure 4 displays vertical changes in tropical O3 chem-ical production and destruction when convective mixing is
switched on. Since NO is the main species involved in O3
production, the changes in O3chemical production with con-vective mixing are generally similar to that of NOxchanges (compare Figs. 4a–b, 3g–h). However there are some
dif-ferences. In particular, UT O3 production increases over
land, whereas NOx decreases, and surface decreases are
large. O3 chemical destruction is primarily determined by water vapour concentrations and the O3vertical distribution (mainly through the H2O+O(1D) reaction). As water vapour concentrations do not change between experiments (Sect. 2),
the changes in O3 chemical destruction are similar to the
changes in O3 (compare Figs. 4c–d, 3e–f), although again
there are some differences. Net O3chemical production in-creases in the MT and UT, and dein-creases at the surface over land (Fig. 4e). Over the oceans, net O3production decreases at the surface and in the UT, and in the MT increases over remote regions but decreases elsewhere (Fig. 4f).
The effects of convection on NOxcan partly be understood in terms of a flattening of the tropical land “C”-shaped profile (Fig. 2a), and we assume advection of this effect of over the oceans (Figs. 2a, b, 3a, b). This partly occurs in our model
as UT NOx from lightning emissions is displaced to lower
altitudes, and surface NOxemissions are lifted to higher alti-tudes, which results in higher NOxconcentrations in the MT (Figs. 3g–h). However, the UT NOxdecreases over land are larger than NOxincreases in the MT by an order of magni-tude, suggesting that mixing of NOx is not the only factor influencing NOxconcentrations (Figs. 3g–h). As discussed in Sect. 1, convection also affects non-methane hydrocarbons (NMHCs) including isoprene, lifting these gases and their degradation products into the UT (Collins et al., 1999). Iso-prene has a very short lifetime (<1h; Seinfeld and Pandis, 1997), and is emitted in substantial quantities from tropical vegetation (Guenther et al., 1995; Sanderson et al., 2003b). The natural source of isoprene is much larger than the mainly anthropogenic sources of other NMHCs in the tropics. Here, the prevalence of isoprene, together with its short lifetime, means that its distribution is strongly affected by convection. Figure 5a shows that convection increases MT and UT iso-prene at the expense of surface; these changes are largest over equatorial land. Convective lifting of isoprene brings the peroxy acetyl radical (CH3COO2), an isoprene degradation product, into contact with lightning NOx. This leads to sig-nificant PAN formation in the cold UT over equatorial land
-1 -0.5 -0.1 -0.05 -0.02 0 0.02 0.05 0.1 0.15 0.25
DO3 production (Tg O3/yr) Land
20S 10S 0 10N 20N Latitude 950 850 750 650 550 450 350 250 150 H ei gh t H P a -1 -0.5 -0.1 -0.05 -0.02 0 0.02 0.05 0.1 0.15 0.25
DO3 destruction (Tg O3/yr) Land
20S 10S 0 10N 20N Latitude 950 850 750 650 550 450 350 250 150 H ei gh t H P a -0.15 -0.1 -0.05 -0.02 -0.01 0 0.01 0.03 0.05 0.1
net DO3 production (Tg O3/yr) Land
20S 10S 0 10N 20N Latitude 950 850 750 650 550 450 350 250 150 H ei gh t H P a -1 -0.5 -0.1 -0.05 -0.02 0 0.02 0.05 0.1 0.15 0.25
DO3 production (Tg O3/yr) Ocean
20S 10S 0 10N 20N Latitude 950 850 750 650 550 450 350 250 150 H ei gh t H P a -1 -0.5 -0.1 -0.05 -0.02 0 0.02 0.05 0.1 0.15 0.25 DO3 destruction (Tg O3/yr)Ocean 20S 10S 0 10N 20N Latitude 950 850 750 650 550 450 350 250 150 H ei gh t H P a -0.15 -0.1 -0.05 -0.02 -0.01 0 0.01 0.03 0.05 0.1
net DO3 production (Tg O3/yr) Ocean
20S 10S 0 10N 20N Latitude 950 850 750 650 550 450 350 250 150 H ei gh t H P a
Fig. 4. 20-year average tropical land and ocean O3production (a, b) , O3destruction (c, d) and net O3chemical production (e, f) (Tg O3)
control-convection off simulations.
-2.5 -1 -0.5 -0.1 -0.05 0 0.02 0.05 0.07 0.1 0.16 (a) DC5H8 (ppb) Land 20S 10S 0 10N 20N Latitude 950 850 750 650 550 450 350 250 150 -0.2 -0.1 -0.05 -0.02 -0.01 0 0.01 0.02 0.05 0.1 0.2 (c) DP AN (ppb) Land 20S 10S 0 10N 20N Latitude 950 850 750 650 550 450 350 250 150 -0.002 -0.0015 -0.001 -0.0005 -0.00025 0 0.0005 0.001 0.0015 0.0025 0.0035 (e) DHO2 (ppb) Land
20S 10S 0 10N 20N Latitude 950 850 750 650 550 450 350 250 150 H e ig h t H Pa -2.5 -1 -0.5 -0.1 -0.05 0 0.02 0.05 0.07 0.1 0.16 (b) DC5H8 (ppb) Ocean 20S 10S 0 10N 20N Latitude 950 850 750 650 550 450 350 250 150 A lti tu d e h P a -0.2 -0.1 -0.05 -0.02 -0.01 0 0.01 0.02 0.05 0.1 0.2 (d) DP AN (ppb) Ocean 20S 10S 0 10N 20N Latitude 950 850 750 650 550 450 350 250 150 -0.002 -0.0015 -0.001 -0.0005 -0.00025 0 0.0005 0.001 0.0015 0.0025 0.0035 (f) DHO2 (ppb) Ocean 20S 10S 0 10N 20N Latitude 950 850 750 650 550 450 350 250 150 H e ig h t H Pa A lti tu d e h P a A lti tu d e h P a A lti tu d e h P a
Fig. 5. 20-year average tropical land and ocean isoprene (a, b), PAN (c, d) and HO2(e, f) differences (ppb) control-convection off
simula-tions.
at the expense of NOx(Figs. 5c, 3g). We suspect the higher
UT PAN and lower UT NOxconcentrations over the oceans
result from these changes over land (Fig. 5d). In parallel sensitivity experiments with no lightning NOxemissions we find that the impact of convective mixing, in terms of tropi-cal PAN increases, is reduced by ∼50%. This indicates that convected isoprene is a significant source of PAN in the UT. PAN acts as a reservoir for NOx, and its breakdown to re-lease stored NOxis strongly temperature dependent – in the cold UT PAN is relatively stable and has a lifetime of the
or-der of months. Comparing changes in NOxand PAN in the
UT (350–150 hPa) we find UT NOxdecreases by 0.032 Tg N
(50% decrease) and a UT PAN increases by 0.028 Tg N (65% increase). In terms of N conservation we therefore expect that a substantial fraction of the NOx decrease arises from
the PAN increase. Thus the impact of convection on NOx
is through convective transport of NOxitself in combination
-8 -6 -4 -2 0 2 D TC O3 (DU) 0 20 40 60 80 100 U T -s u rf a ce O 3 ( p p b ) Land Ocean r=-0.7
Fig. 6. 20-year annual-average change in TTC O3(DU)
(control-convection off) vs. UT (350–150 hPa) – surface (950 hPa) O3(ppb)
(convection off experiment) for combined tropical land and ocean grid boxes.
For O3, as discussed above for NOx, upward transport of LT air over land and ocean displaces UT O3-rich air, which subsides downwards. Over land, similar to NOx, convection
moves O3 away from its source regions, raising MT
con-centrations. Therefore vertical mixing of the O3 profile it-self, as well as changes in the NOx distribution, cause the changes in the O3distribution over polluted land. However,
changes in UT NOx over land contrast with changes in UT
O3production over land. Despite a large reduction in UT
NOx(Fig. 3g) with convective mixing, UT O3production in-creases (Fig. 4a). The role of isoprene is again important here, as its oxidation generates peroxy radicals (HO2 and RO2), which are required for O3 production. O3 produc-tion in the tropical UT tends to fall due to the reducproduc-tion in UT NOx, but this effect is more than offset by an increase
in UT HO2 produced from isoprene (Figs. 5e, f). As HO2
also destroys O3, the HO2increases explain the small equa-torial land UT O3 destruction increases (Fig. 4c). Despite an overall increase in net chemical production in the UT, O3 decreases. This indicates that vertical transport of O3itself is more important than changes in chemistry in determining the outcome of convective mixing in the UT. Over the remote southern oceans, MT O3decreases and surface O3increases in contrast to NOxand O3production changes. This also im-plies that over remote tropical locations vertical transport of O3itself is more important than changes in NOxchemistry.
To summarise, convection therefore influences modelled O3distributions by a combination of vertical transport of O3, as well as by affecting the vertical distribution of its precur-sors, especially NOxand HO2and the resultant chemical pro-duction and destruction of O3. Vertical transport appears to be the dominant process in clean air, over the remote oceans in the MT and LT, and in polluted land regions in the UT.
Elsewhere both convective transport and chemistry changes contribute significantly to the overall impact of convection on the O3distribution. The impact of convective mixing is summarized in Table 2.
To assess the influence of vertical transport on the O3 dis-tribution the relationship between the O3gradient in the
con-vection off experiment and the change in TTC O3 due to
convection was examined for all grid boxes over the trop-ics (Fig. 6). A strong correlation was found (r=0.7). For each 10 ppb steepening in the O3gradient between the UT (350– 150 hPa) and surface (950 hPa), convection reduces TTC O3 by 1.5 DU (Fig. 6). The relationship is stronger if the change in UT O3alone is considered (r=0.9, not shown). This also suggests that vertical transport of O3plays a major role in the resultant O3distribution after convection, particularly in the UT.
3.3 Influence of convection in the extra-tropics
Deep convective mixing has a global effect on O3 distribu-tions (Fig. 7a). UT O3not only decreases in the tropics but also decreases by similar amounts in the mid-latitudes and polar regions (10–30 ppb).
Over the northern mid-latitudes (Fig. 1) some deep con-vection reaches the UT, especially over parts of the North American and Asian continents. Examination of the large-scale flow in HadAM3 suggests that the large tropical anoma-lies may also be transported latitudinally, and downward along the subtropical front in the northern mid-latitudes. Consequently, both latitudinal transport and convective mix-ing in the northern mid-latitudes are likely to contribute to the simulated UT O3 decreases. In the southern mid-latitudes, some deep convection also occurs over the southern oceans
(Fig. 1). We suspect this is the main cause of UT O3
de-creases in the southern hemisphere.
The slightly lower O3 stratospheric influx when convec-tive mixing is switched on (Table 1) may also contribute to lower extra-tropical UT O3. Convective mixing also influ-ences NOx distributions well outside the tropics (Fig. 7b). The changes are highly skewed towards the Northern Hemi-sphere reflecting the large surface NOxemissions in this
re-gion. Tropical UT NOx decreases (100–200 ppt) are
trans-ported latitudinally, which together with mid-latitude con-vection results in negative UT NOxanomalies extending to 45◦in the Northern Hemisphere.
In northern mid-latitudes, convection generally reduces surface O3 and NOx (except for O3 around 60◦N), which reflects enhanced venting of polluted continental NOx and O3-rich air by shallow convection (Figs. 7a, b). The increase of O3accompanied by a large decrease of NOx(100–200 ppt) around 60◦N is the titration effect which occurs over
North-Western Europe. This effect occurs under very high NOx
levels predominantly in winter (when there are low UV lev-els for NO2photolysis) whereby NO reacts with O3to form NO2. Thus with convective mixing, surface air low in O3
-30 -10 -8 -5 -3 -1 0 1 3 5 (a) DO3 (ppb) 90S 60S 30S 0 30N 60N 90N Latitude 950 850 750 650 550 450 350 250 150 A lt it u d e h P a -8 -5 -4 -3 -2 -1 0 1 2
0 30E 60E 90E 120E 150E 180 150W 120W 90W 60W 30W 0 90S 60S 30S E Q 30N 60N 90N (c) DTC O3 (DU) -200 -100 -50 -10 -5 0 1 2 5 10 20 50 (b) D NOx (ppb) 90S 60S 30S 0 30N 60N 90N Latitude 950 850 750 650 550 450 350 250 150 A lt it u d e h P a -200 -100 -50 -10 -5 0 1 2 5 10 20 50
0 30E 60E 90E 120E 150E 180 150W 120W 90W 60W 30W 0 90S 60S 30S E Q 30N 60N 90N (d) DC olumn-Average NOx (ppt)
Fig. 7. 20-year average global change in O3(ppb) (a) NOx(ppt) (b) TC O3(DU) (c) and column-average NOx (ppt) (d) for control –
convection off simulations.
and high in NOxis replaced by air with higher O3and lower NOxconcentrations. In the polar regions, large-scale subsi-dence of UT air, that is less rich in O3 due to hemispheric transport, results in lower surface O3. At northern polar lat-itudes LT NOxlevels are highest during winter months and the impact of convective mixing is largest. Shallow
convec-tion that lifts NOxupwards from the LT and MT, combined
with transport of the mid-latitudinal anomaly generates
neg-ative LT/MT NOx anomalies over the Arctic (Fig. 7b). In
the southern mid-latitudes as in the southern tropics, where precursor emissions are lesser, surface O3increases and NOx decreases slightly.
MT O3 increases in the northern mid-latitudes up to
around 40◦N, as in the northern tropics, but decreases else-where in the mid-latitudes and polar regions. We suspect that large scale subsidence of large UT anomalies dominates the vertical O3distribution (Fig. 7a). Convection produces
strong MT NOx increases (10–50 ppt) in the northern
latitudes at the expense of the surface (Fig. 7b). These mid-latitudinal MT NOxincreases appear to be transported to the remote troposphere.
In the column average, convective overturning leads to
tropospheric column (TC) O3decreases almost everywhere
(Fig. 7c). Decreases are largest (up to 8 DU) over the
clean southern ocean regions where surface O3
concentra-tions are lowest and therefore the effects of deep convection that reaches the UT are presumably greatest. Over
equato-rial land regions, where MT O3 increases are greatest, TC O3decreases are smallest (0–2 DU) and in small areas above strong NOxsource regions (e.g., SE Asia) TC O3 increases
slightly (0–1 DU). Tropospheric column-average NOx also
decreases (strongly) over tropical land regions (50–100 ppt, Fig. 7d) and outflow oceanic regions. The northern mid-latitudes show increases over land and Pacific regions with the largest changes (10–50 pptv, Fig. 7d) over western Eura-sia, reflecting upward mixing in convective regions.
As over tropical land, chemical O3production increases in the northern mid-latitudes in the MT and UT and de-creases strongly at the surface over both land and ocean to ∼45◦N, reflecting NOx changes (not shown). O3chemical destruction exhibits similar behaviour as in the tropics (not shown). It decreases at the surface over land and increases over oceans, and increases in the MT; UT changes are small. These changes weaken with higher latitude, reflecting the O3 distribution changes. Overall net chemical O3production in-creases in the MT and UT, with the largest changes between 30◦–45◦N, where there is some O3chemical production, but little destruction. Table 2 provides a summary of the impact of convective mixing over polluted regions between 30◦S– 45◦N and remote oceanic regions.
Table 1. 20-year average O3budget changes (control – convection off).
Budget term 20-year average 20-year average % change with 20-year average 20-year average % change with Lawrence Lelieveld
Tg (O3)/yr control convection off convective mixing control convection off convective mixing et al. (2003) and Crutzen (1994)
Mask=O3>150 ppb Mask=O3>150 ppb Mask=O3>150 ppb Mask=PT Mask=PT Mask=PT % change % change
O3chemical production 4712 (86) 4547 (108) +3.6 4709 (87) 4541 (108) +3.7 +16.7 +14
O3chemical destruction 4224 (84) 4097 (102) +3.0 4223 (84) 4096 (103) +3.0 +15.0 +22
O3net chemical production 489 (15) 450 (21) +8.6 487 (15) 446 (21) +9.1 +81.8 −25
O3dry deposition 881 (7) 851 (13) +3.5 881 (7) 851 (13) +3.5 +7.0 +15 O3stratospheric influx 392∗(15) 401∗(21) −2.2 395∗(15) 405∗(21) −2.6 −2.1 O3burden (Tg O3) 250 (3) 289 (6) −13.8 243 (3) 281 (6) −13.4 +11.9 −20 O3lifetime (days) 17.8 (0.2) 21.2 (0.4) −16.2 17.3 (0.2) 20.7 (0.4) −15.8 −2.5 NOxburden (Tg N) 0.153 (0.002) 0.194 (0.006) −27.5 0.151 (0.002) 0.192 (0.006) −21.2 +14 −30 Noxlifetime (days) 1.1+ 1.4+ −21.6 PAN burden (Tg N) 0.320 (0.006) 0.264 (0.007) +21.2 0.319 (0.006) 0.263 (0.007) +21.4 OH burden (Tg OH) 203 (4) 187 (3) +8.3 201 (4) 186 (3) +8.5
∗not significantly different at the 0.01 level. +This is the NO
xlifetime change for the entire model domain-surface up to 100 hPa. We do not archive sufficient 3-D fluxes to be able to
calculate the NOxlifetime using a tropopause mask.
O3chemical production reactions are: NO+HO2, NO+CH3O2, NO+RO2.
O3 chemical destruction reactions are: O1D+H2O, O3+OH, O3+HO2, O3+hydrocarbons (C2H4, C3H6(2 routes), C5H8, Methyl vinyl
ketone) and other minor net O3losses.
3.4 Influence of convection on the global tropospheric O3 budget
Global tropospheric budgets for O3with and without convec-tive mixing are calculated in Table 1.
The global budgets have been calculated using two differ-ent masking techniques in order to assess uncertainty arising from use of the 150 ppb isopleth to determine the tropopause. The first 3 columns in Table 1 show results using the 150 ppb tropopause definition, and the next three columns show re-sults using the HadAM3 physical tropopause. As discussed in Sect. 2, the same mask is used in the control and con-vection off simulations. The 20-year annual-average budget terms are calculated to be similar for the two tropopause def-initions, thus the values given below are based on the phys-ical tropopause definition. Annual-average standard devia-tions are also tabulated. Larger interannual variability oc-curs in the convection off simulation. This is presumably due to steeper concentration gradients through the troposphere in the absence of convective mixing.
Chemical production increases globally by 3.7%, mainly
due to tropical and northern mid-latitudinal MT NOx
in-creases (Figs. 7b, 4a). Global chemical destruction also
increases (by 3.0%) as a result of MT O3increases (Figs. 7a, 4c). Because net chemical production is the small residual of two large budget terms it has a relatively large increase of 9.1%. Dry deposition (which increases with surface O3) globally increases by 3.5%. All annual-average O3fluxes are significantly different (at the 0.01 level) between the control and convection off simulations, bar stratospheric input (Ta-ble 1). Despite increased global net chemical production due to tropical MT increases, the global O3burden decreases by
13.4%. Likewise, the O3 lifetime decreases globally from
20.7 to 17.3 days (15.8%). The global NOx burden also
decreases globally by 21.2% and PAN increases by a simi-lar amount.We estimate that the NOx lifetime decreases by
∼20% with convective mixing; mainly due to the downward
transport of lightning NOxemissions (since there are
light-ning NOx emissions in the convection off case). The OH
burden increases by 8.5% as a result of greater O3destruction (and hence OH production) with convective mixing. The dif-ferences in burdens between the control and convection off experiments are significant at the 0.01 level for all species mentioned above.
4 Discussion
Lelieveld and Crutzen (1994) calculated a 20% decrease in
the global O3 burden due to convective mixing, using a
global model with no NMHC chemistry. In their model, they
found that the effects of mixing O3 over-rode any
chemi-cal effects due to mixing of O3 precursors. More recently, Lawrence et al. (2003), using a global model with detailed NMHC chemistry (similar to that used in this study), found
a global O3 burden increase of 12% from convective
mix-ing. In their study, Lawrence et al. (2003) found the effects of changes in precursor chemistry due to mixing (in partic-ular lifting of surface NOx emissions) to outweigh the ef-fect of vertical mixing of O3 itself. In our study with the
STOCHEM-HadAM3 model, O3 decreases by 13% due to
convective mixing, and the effect of O3 vertical transport outweighs the effect of precursor mixing changes (Table 1; Fig. 7a). Differences in the patterns of TC O3 change are large with decreases almost everywhere in our study, com-pared to increases everywhere in Lawrence et al. (2003).
Table 2. Summary of the impact of convective mixing on polluted and remote regions. The largest impact is in bold print.
Impact on O3 Impact on O3
Process over polluted land over remote oceans Dominant impact
(45◦N–15◦S) (0◦–60◦S)
Convective transport of O3 UT O3↓ UT O3↓ Overall TCO decreases
MT O3↑ MT O3↓ except in parts
Surface O3↓ Surface O3↑ of SE Asia
Convective transport of NOx UT NOx↓ UT NOx↓ Largest changes over
n.b. lightning emissions in both simulations MT NOx↑ MT NOx↑ polluted regions and in the UT
Surface NOx↓ Surface NOx↓ UT O3Production ↓
MT O3Production ↑
– (largest changes 30◦–60◦N) Surface O3Production ↓
– (largest changes 30◦–60◦N)
Convected C5H8⇒HO2+RO2 UT O3Production ↑ UT Net O3production ↑
UT O3destruction ↑
Convected C5H8⇒NOxto PAN conversion UT NOx↓ UT O3Production ↓
One similarity between the Lawrence et al. (2003) and this
study is that MT O3 increases due to mixing of precursor
NOxemissions. Lawrence et al. (2003) also report O3 bud-gets for their simulations. In common with this study, they find that switching on convection results in an increase in production of O3, although they find a larger percentage in-crease (Table 1). Another similarity is that convection re-duces the tropospheric O3lifetime. The impact of convec-tive mixing on tropospheric O3lifetime is much stronger in our study. As discussed in Sect. 3.1, of all the models sam-pled in a recent intercomparison (Stevenson et al., 2005b), STOCHEM-HadAM3 had the shortest lifetime (17 days), whereas MATCH-MPIC had the longest (28 days).We might therefore expect some significant differences in the responses of these two models to convection, even if the convective mass fluxes were quite similar. With the larger reduction in tropospheric O3 lifetime, the tropospheric O3 burden falls in our study, whereas Lawrence et al. find an increase. The reduction in lifetime in our results arises mainly due to a re-duction in UT O3concentrations. In our model these UT O3 reductions are driven mainly by the vertical mixing of O3, as we find they occur despite increases in land UT chemi-cal production (Fig. 4a). An interesting observation is that land UT chemical production increases despite large reduc-tions in NOx(Figs. 4a, 3g) – this indicates that HOxincreases (Figs. 5e, f) outweigh the NOxdecreases (Figs. 3g, h). In the
Lawrence et al. (2003) study UT O3 increases, which
sug-gests that UT O3production increases are greater than in our study.
Do the differences in the impact of convective mixing in these two contemporary models represent a realistic
uncer-tainty range? To answer this question we need to understand the root causes of these inter-model differences. Below we investigate potential model differences.
In both studies, the water vapour distribution and lightning
NOx emissions were kept constant between the control and
convection off (or equivalent) simulations.
Differences in the convection schemes themselves (Prather et al., 2001) may be an important, if not the most important cause, of the different effects of convective mixing on the O3 burden in the two studies. In particular, differences in the height and strength of convection (Olivi´e et al., 2004) and efficiency of vertical transport of NOx and O3 out of the boundary layer (Beekman et al., 2003) may be crucial. Annual-average convective updraught mass fluxes simulated in HadAM3 and MATCH-MPIC (Rasch et al., 1997) models are displayed in Fig. 1 for years 1991–1996 and 1995, re-spectively. Annual-average convective mass fluxes for 1991– 1996 and the year 1995 are similar in HadAM3, showing 1995 to be a typical year within the 1991–1996 period.
The strength of convective updraught fluxes in the tropics and mid-latitudes is typically a factor of 2–3 stronger every-where in HadAM3 compared to MATCH-MPIC (Figs. 1a–c, g–i). Whilst HadAM3 has generally stronger and higher con-vection compared to ERA-40- (Figs. 1a–f), MATCH-MPIC
shows weaker and less deep convection (Figs. 1g–i). In
particular, there is much less convection in the upper UT in MATCH-MPIC. This implies more vigorous and exten-sive deep convection in the HadAM3 model. There is gen-eral agreement between the two models in the location of convective updraughts in the MT (Figs. 1b, h), except that there is little convection over the Eastern Pacific branch of
the ITCZ in MATCH-MPIC. In the UT (Figs. 1a, g) there are much greater differences between the simulated convec-tive updraught fluxes. In particular, HadAM3 exhibits much greater convection across the ITCZ, and shows greater deep convection in mid-latitude regions.
Olivi´e et al. (2004) compared the impact of using convec-tive mass fluxes derived from two different methods on
tro-pospheric O3 distribution. One source of convective mass
fluxes was directly archived “on-line” ERA-40 reanalyses, the other a convective parametrisation in the TM3 model based on large-scale wind, temperature, evaporation and hu-midity fields from ERA-40 reanalyses. In this case convec-tive mass fluxes are derived “off-line”. Both derived mass fluxes are based on Tiedtke (1989), but have different
mod-ifications to their underlying schemes. The datasets also
have different temporal averaging properties (time-averaged vs. instantaneous). One of the main differences reported by Olivi´e et al. (2004) was that convective mass fluxes reach higher altitudes in the ERA-40 on-line reanalyses compared to those diagnosed off-line. Comparing the results from sim-ulations performed using their on-line and off-line convec-tion schemes Olivi´e et al. (2004) find lower O3 and NOx concentrations in the UT and higher concentrations in the free troposphere as a result of the deeper convection in the ERA-40 on-line scheme. This promoted greater transport of O3-poor air from the surface to the UT, as well as more sub-sidence to the MT. Therefore, we expect that it is the higher and larger amount of convection that leads to the substan-tial reduction of tropical UT O3in STOCHEM, which is not seen in the MATCH-MPIC simulations. Olivi´e et al. (2004) also report a reduction in tropical UT O3concentrations us-ing on-line compared to off-line ERA-40 reanalyses convec-tive mass fluxes. They suggest that these tropical anomalies are transported to higher latitudes through latitudinal trans-port, and transport downward along the subtropical front.
The lower O3 concentrations with greater and higher
mix-ing in the UT, is in agreement with the patterns of change in the sub-tropics displayed in Fig. 7a. In the mid-latitudes, Olivi´e et al. (2004) find larger O3concentrations in the MT with larger/higher convection in the simulations that use the fluxes from the ERA-40 reanalyses. These arise from en-hanced downward transport in the higher latitudes. However, despite greater and higher convection in the mid-latitudes in STOCHEM-HadAM3 relative to MATCH-MPIC (Figs. 1b, h), MT increases are smaller. Therefore, we suspect differ-ences other than those arising from the convection schemes also contribute to the contrasting effects of convective mix-ing displayed by the STOCHEM and MATCH-MPIC mod-els. Interestingly, the relative effects of convection on O3 budget fluxes are larger in the MATCH model compared to STOCHEM, despite the generally smaller convective mass fluxes; this may be related to the longer tropospheric O3 life-time in MATCH-MPIC (Table 1).
Differences in chemistry potentially arise from differences in both emission source strengths and chemical schemes.
A comparison of the emissions used in the two stud-ies shows that NO surface, aircraft and ship emissions
are similar but lightning NOx emissions are higher at
7 Tg N/yr in our study compared to 2 Tg N/yr in Lawrence et al. (2003) (M. Lawrence, personal communication); anthro-pogenic NMHC emissions are also higher by 5–20 Tg/yr in STOCHEM, and isoprene is higher by ∼225 Tg/yr (∼65%) compared to MATCH (von Kuhlmann et al., 2003). The
higher isoprene and lightning NOx emissions in our study
may result in greater amounts of PAN formation and conse-quently a larger UT NOxreduction, although higher isoprene also suggests higher UT HOx. Emissions of both lightning NOx and isoprene from vegetation carry high levels of un-certainty, and it is unclear whether the higher or lower lev-els of emissions more closely resemble the real world. Both these natural sources are sensitive to climate, and thus likely to respond to changes in climate (Stevenson et al., 2005a).
In addition, there may be significant model differences in chemical schemes in the two studies, particularly in the iso-prene degradation schemes. The isoiso-prene-lightning NOx in-teraction may be much less important in the MATCH model, resulting in larger increases in O3production with convec-tion. In STOCHEM, this mechanism limits the effective-ness of convection in promoting chemical production of UT O3, and consequently the impact of vertical O3mixing is the process of overriding importance. Figure 2 shows simulated tropical PAN to be in agreement with observations to within ±1 standard deviation. There is some overestimation of PAN in parts of the UT, but also some overestimation of UT NOx (Sect. 3.1). Therefore, promotion of the conversion of NOx into PAN by convection seems a plausible process, since it acts to bring simulated NOxconcentrations into better agree-ment with observations. However, other mechanisms such as excessive lightning NOxemissions or errors in their verti-cal distribution could also explain the UT NOxoverestimates in the tropics. In a model sensitivity study, von Kuhlmann et al. (2004) found that both isoprene and lightning emis-sions magnitudes, and isoprene degradation schemes, all had important influences on tropical O3. Further model sensi-tivity studies are needed to clarify how different emissions and isoprene schemes influence tropospheric O3response to convective mixing.
Finally, vertical resolution and upper boundary conditions
for O3, as discussed by Lawrence et al. (2003) could be
another source of different responses with convective mix-ing. However, although the vertical grid resolution is lower in STOCHEM than in the MATCH-MPIC model used in the Lawrence et al. (2003) study the Lagrangian sampling in STOCHEM is at roughly the same resolution (50 000 air parcels compared to 64×32×(∼20 tropospheric vertical lev-els)= approximately 41 000 grid cells in the troposphere).
5 Conclusions
Model experiments have been performed to examine the role of deep convective mixing in determining the distributions of tropospheric O3and its precursors. In contrast to results from an earlier study with a model of similar chemical complex-ity (Lawrence et al., 2003), convective mixing in our study reduces the O3burden, due to vertical O3redistribution and associated lifetime changes. Convection of O3precursors has several competing effects on O3chemical production. Over tropical land, convection lofts surface sources of NOx and NMHCs in particular isoprene, tending to increase their con-centrations in the MT and UT at the expense of the LT. How-ever, in our model the subsidence associated with convection
mixes downwards UT lightning NOx. UT NOxis also
con-verted to PAN by the introduction of peroxy acetyl radicals, an oxidation product of isoprene. The overall effect is a re-duction in UT NOx, together with an increase in UT HOx; the net effect is a small increase in O3production. However, this increase in O3production is more than counteracted by the effects of convective mixing of O3itself, and UT O3reduces. The features generated over the tropical land are assumed to be advected over the tropical oceans, although over the re-mote oceans, the impact of local vertical mixing becomes more dominant. Mid-latitudinal convection also reduces UT O3resulting in a 13% decrease in the global O3burden de-spite a 4% increase in chemical production. This apparent contradiction arises because the mean tropospheric O3 life-time reduces substantially (by 16%); this is mainly because less O3resides in the UT, where its lifetime is longest. Com-parison of convective mass fluxes from this study and that of Lawrence et al. (2003) reveal substantial differences in the strength and height of deep convection. We suspect that differences in isoprene chemistry schemes as well as light-ning NOxand isoprene emissions magnitudes are also impor-tant. With such divergent results from two apparently similar models (in terms of resolution and complexity), and the im-portance of deep convective mixing processes in altering the state of the atmosphere on interannual and longer timescales, further studies with other models are needed to constrain this range of uncertainty.
Acknowledgements. This work was supported by the NERC UTLS
thematic programme (NER/T/S/2000/01041). D. S. Stevenson was supported by NERC/Environment Agency fellowship funding (P4-F02, NER/J/S/2000/00840). The UGAMP project is thanked for computing resources to run the coupled HadAM3-STOCHEM model. Many thanks to P. van Velthoven for providing ERA-40 convective mass fluxes. Many thanks to M. Lawrence for providing convective mass fluxes used in MATCH-MPIC and also for his detailed review. Thanks also to 3 further anonymous reviewers. Thanks to J. Pyle and G. Zeng for useful discussions.
Edited by: A. Stohl
References
Beekmann, M., Kowol-Santen, J., Honore, C., Dugault, E., and Ancellet, G.: Modelling studies of boundary-layer to free tro-posphere exchange, in: Tropospheric Ozone Research, TOR-2 Eurotrac-2 Subproject Final Report, 37–41, 2003.
Chatfield, R. B. and Brost, R. A.: A two-stream model of the verti-cal transport of trace species in the convective boundary layer, J. Geophys. Res., 92, 13 263–13 276, 1987.
Christian H. J., Blakeslee, R. J., Boccippio, D. J., et al.: Global frequency and distribution of lightning as observed from space by the Optical Transient Detector, J. Geophys. Res., 108(D1), 4005, doi:10.1029/2002JD002347, 2003.
Collins, W. J., Stevenson, D. S., Johnson, C. G., and Derwent, R. G.: Tropospheric ozone in a global-scale three-dimensional La-grangian model and its response to NOxemission controls, J.
Atmos. Chem., 26, 223–274, 1997.
Collins, W. J., Stevenson, D. S., Johnson, C. E., and Derwent, R. G.: Role of convection in determining the budget of odd hydrogen in the upper troposphere, J. Geophys. Res., 104(D21), 26 927– 26 942, doi:10.1029/1999JD900143, 1999.
Collins, W. J., Derwent, R. G., Johnson, C. E., and Stevenson, D. S.: A comparison of two schemes for the convective transport of chemical species in a Lagrangian global chemistry model, Q. J. R. Meteorol. Soc., 128, 991–1009, 2002.
Cubasch, U., Meehl, G. A., Boer, G. J., Stouffer, R. J., Dix, M., Noda, A., Senior, C. A., Raper, S., and Yap, K. S.: Projections of future climate change, in: Climate Change 2001: The Scientific Basis, Contribution of WG1 to the Third Assessment report of the IPCC, edited by: Houghton, J. T., Ding, Y., Griggs, D. J., et al., Cambridge University Press, England, 2001.
Dentener, F. D., Stevenson, D. S., Cofala, J., Mechler, R., Amann, M., Bergamaschi, P., Raes, F., and Derwent, R. G.: The impact of air pollutant and methane emission controls on tropospheric ozone and radiative forcing: CTM calculations for the period 1990–2030, Atmos. Chem. Phys., 5, 1731–1755, 2005,
SRef-ID: 1680-7324/acp/2005-5-1731.
Dickerson, R. R., Huffman, G. J., Luke, W. T., Nunnermacker, L. J., Pickering, K. E., Leslie, A. C. D., Lindsey, C. G., Slinn, W. G. N., Kelly, T. J., Daum, P. H., Delany, A. C., Greenberg, J. P., Zimmermann, P. R., Boatman, J. F., Ray, J. D., and Stedman, D. H.: Thunderstorms – an important mechanism in the transport of air pollutants, Science, 235(47897), 460–464, 1987.
Emmons, L. K., Hauglustaine, D. A., Muller, J.-F., Carroll, M. A., Brasseur, G. P., Brunner, D., Staehelin, J., Thouret, V., and Marenco, A.: Data composites of airborne observations of tropo-spheric ozone and its precursors, J. Geophys. Res., 105, 20 497– 20 538, 2000.
Gauss, M., Myhre, G., Pitari, G., et al.: Radiative forcing in the 21st century due to ozone changes in the troposphere and the lower stratosphere, J. Geophys. Res., 108(D9), 4292, doi:10.1029/2002JD002624, 2003.
Gregory, D., Kershaw, R., and Innes, P. M.: Parametrization of mo-mentum transport by convection. II: Tests in single-column and general circulation models, Q. J. R. Meteorol. Soc., 123, 1153– 1183, 1997.
Guenther, A., Hewitt, C. N., Erickson, D., Fall, R., Geron, C., Graedel, T., Harley, P., Klinger, L., Lerdau, M., McKay, W. A., Pierce, T., Scholes, B., Steinbrecher, R., Tallamraju, R., Taylor, J., and Zimmerman, P.: A global model of natural organic
com-pound emissions, J. Geophys. Res., 100, 8873–8892, 1995. Labrador, L. J., von Kuhlmann, R., and Lawrence, M. G.: The
ef-fects of lightning-produced NOxand its vertical distribution on
atmospheric chemistry: sensitivity simulations with MATCH-MPIC, Atmos. Chem. Phys., 5, 1815–1834, 2005,
SRef-ID: 1680-7324/acp/2005-5-1815.
Lawrence, M. G., von Kuhlmann, R., and Salzmann, M.: The bal-ance of effects of deep convective mixing on tropospheric ozone, Geophys. Res. Lett., 30, 18, doi:10.1029/2003GL017644, 2003. Lawrence, M. G. and Rasch, P. J.: Tracer Transport in Deep Con-vective Updrafts: Plume Ensemble versus Bulk Formulations, J. Atmos. Sci., 62, 2880–2894, 2005.
Lelieveld, J. and Crutzen, P. J.: Role of deep cloud convection in the ozone budget of the troposphere, Science, 264, 1759–1761, 1994.
Li, D. and Shine, K. P.: A 4-dimensional ozone climatology for UGAMP models, UGAMP internal report, University of Read-ing, UK, 1995.
Murphy, D. M. and Fahey, D. W.: An estimate of the flux of strato-spheric reactive nitrogen and ozone into the troposphere, J. Geo-phys. Res., 99, 5325–5332, 1994.
Naki´cenovi´c, N., Alcamo, J., Davis, G., et al.: IPCC Special Re-port on Emissions Scenarios, Cambridge University Press, Cam-bridge, United Kingdom and New York, NY, USA, 599 pp., 2000.
Olivi´e, D. J. L, van Velthoven, P. F. J., Beljaars, A. C. M., and Kelder, H. M.: Comparison between archived and off-line disgnosed convective mass fluxes in the chem-istry transport model TM3, J. Geophys. Res., 109, D11303, doi:10.1029/2003/JD004036, 2004.
Pickering, K. E., Thompson, A. M., Dickerson, R. R., Luke, W. T., McNamara, D. P., Greenberg, J. P., and Zimmerman, P. R.: Model Calculations of Tropospheric Ozone Production Potential Following Observed Convective Events, J. Geophys. Res., 95, 14 049–14 062, 1990.
Pickering, K. E., Thompson, A. M., Tao, W.-K., Rood, R. B., Mc-Namara, D. P., and Molod, A. M.: Vertical transport by convec-tive clouds: Comparisons of three modeling approaches, Geo-phys. Res. Lett., 22, 1089–1092, 1995.
Pickering, K. E., Wang, Y., Tao, W.-K., Price, C., and Muller, J.-F.: Vertical distributions of lightning NOxfor use in regional and
global chemical transport models, J. Geophys. Res., 103(D23), 31 203–31 216, 1998.
Pope, V. D., Gallani, M. L., Rowntree, P. R., and Stratton, R. A.: The impact of new physical parametrizations in the Hadley Cen-tre climate model: HadAM3, Clim. Dyn., 16, 123–146, 2000. Prather, M., Ehhalt, D., Dentener, F., et al.: Atmospheric Chemistry
and Greenhouse Gases, in: Climate Change 2001: The Scientific Basis, Contribution of WG1 to the Third Assessment report of the IPCC, edited by: Houghton, J. T., Ding, Y., Griggs, D. J., et al., Cambridge University Press, England, 2001.
Prather, M. J. and Jacob, D.: A persistent imbalance in HOxand
NOx photochemistry of the upper troposphere driven by deep
tropical convection, Geophys. Res. Lett., 24, 3189–3192, 1997. Price, C., Penner, J., and Prather, M.: NOxfrom lightning 1. Global
distribution based on lightning physics, J. Geophys. Res., 102, 5929–5941, 1997.
Rasch, P. J., Mahowald, N. M., and Eaton, B. E.: Representations of transport, convection, and the hydrologic cycle in chemical transport models: Implications for the modeling of short-lived and soluble species, J. Geophys. Res., 102(D23), 28 127–28 138, doi:10.1029/97JD02087, 1997.
Sanderson, M. G., Collins, W. J., Derwent, R. G., and Johnson, C. E.: Simulation of global hydrogen levels using a Lagrangian three-dimensional model, J. Atmos. Chem., 46, 15–28, 2003a. Sanderson, M. G., Jones, C. D., Collins, W. J., Johnson, C. E., and
Derwent, R. G.: Effect of climate change on isoprene emissions and surface ozone levels, Geophys. Res. Lett., 30(18), 1936, doi:10.1029/2003GL017642, 2003b.
Seinfeld, J. H. and Pandis, S. N.: Atmospheric Chemistry and Physics: From air pollution to climate change, John Wiley & Sons, New York, pp. 1326, 1997.
Stevenson D. S., Doherty, R. M., Sanderson, M. G., Collins, W. J., Johnson, C. E., and Derwent, R. G., Radiative forcing from air-craft NOxemissions: Mechanisms and seasonal dependence, J.
Geophys. Res., 109, D17307, doi:10.1029/2004JD004759, 2004. Stevenson D. S., Doherty, R. M., Sanderson, M. G., Collins, W. J., Johnson, C. E., and Derwent, R. G.: Impacts of climate change and variability on tropospheric ozone and its precursors, Faraday Discuss., 130, doi:10.1039/b417412g, 2005a.
Stevenson, D. S., Dentener, F. D., Schultz, M. G., et al.: Multi-model ensemble simulations of present-day and near-future tro-pospheric ozone, J. Geophys. Res., in press, 2005b.
Tiedtke, M.: A comprehensive mass flux scheme for cumulus con-vection in large-scale models, Mon. Weather. Rev., 117, 1779– 1800, 1989.
von Kuhlmann, R., Lawrence, M. G., Crutzen, P. J., and Rasch, P. J.: A model for studies of tropospheric ozone and non-methane hydrocarbons: Model description and ozone results, J. Geophys. Res., 108(D9), 4294, doi:10.1029/2002JD002893, 2003. von Kuhlmann, R., Lawrence, M. G., P¨oschl, U., and Crutzen, P. J.:
Sensitivities in global scale modeling of isoprene, Atmos. Chem. Phys., 4, 1–17, 2004,
SRef-ID: 1680-7324/acp/2004-4-1.
Ziemke J. R. and Chandra, S.: La Nina and El Nino – induced variabilities of ozone in the tropical lower atmo-sphere during 1970–2001, Geophys. Res. Lett., 30(3), 1142, doi:10.1029/2002GL016387, 2003.