HAL Id: inserm-01672314
https://www.hal.inserm.fr/inserm-01672314
Submitted on 24 Dec 2017
HAL is a multi-disciplinary open access
archive for the deposit and dissemination of
sci-entific research documents, whether they are
pub-lished or not. The documents may come from
teaching and research institutions in France or
abroad, or from public or private research centers.
L’archive ouverte pluridisciplinaire HAL, est
destinée au dépôt et à la diffusion de documents
scientifiques de niveau recherche, publiés ou non,
émanant des établissements d’enseignement et de
recherche français ou étrangers, des laboratoires
publics ou privés.
Julie Méline, Basile Chaix, Bruno Pannier, Gbenga Ogedegbe, Leonardo
Trasande, Jessica Athens, Dustin T. Duncan
To cite this version:
Julie Méline, Basile Chaix, Bruno Pannier, Gbenga Ogedegbe, Leonardo Trasande, et al..
Neighbor-hood walk score and selected Cardiometabolic factors in the French RECORD cohort study. BMC
Public Health, BioMed Central, 2016, 17 (1), pp.960. �10.1186/s12889-017-4962-8�. �inserm-01672314�
R E S E A R C H A R T I C L E
Open Access
Neighborhood walk score and selected
Cardiometabolic factors in the French
RECORD cohort study
Julie Méline
1,2, Basile Chaix
1,2, Bruno Pannier
3, Gbenga Ogedegbe
4, Leonardo Trasande
4,5, Jessica Athens
4and Dustin T. Duncan
4,6*Abstract
Background: Walkable neighborhoods are purported to impact a range of cardiometabolic outcomes through increased walking, but there is limited research that examines multiple cardiometabolic outcomes. Additionally, few Walk Score (a novel measure of neighborhood walkability) studies have been conducted in a European context. We evaluated associations between neighborhood Walk Score and selected cardiometabolic outcomes, including obesity, hypertension and heart rate, among adults in the Paris metropolitan area.
Methods and results: We used data from the second wave of the RECORD Study on 5993 participants recruited in 2011–2014, aged 34–84 years, and residing in Paris (France). To this existing dataset, we added Walk Score values for participants’ residential address. We used multilevel linear models for the continuous outcomes and modified Poisson models were used for our categorical outcomes to estimate associations between the neighborhood Walk Score (both as a continuous and categorical variable) (0–100 score) and body mass index (BMI) (weight/height2in kg/m2), obesity (kg/m2), waist circumference (cm), systolic blood pressure (SBP) (mmHg), diastolic blood pressure (DBP) (mmHg), hypertension (mmHg), resting heart rate (RHR) (beats per minute), and neighborhood recreational walking (minutes per week). Most participants lived in Walker’s Paradise (48.3%). In multivariate models (adjusted for individual variables, neighborhood variables, and risk factors for cardiometabolic outcomes), we found that neighborhood Walk Score was associated with decreased BMI (β: -0.010, 95% CI: -0.019 to −0.002 per unit increase), decreased waist circumference (β: -0.031, 95% CI: -0.054 to−0.008), increased neighborhood recreational walking (β: +0.73, 95% CI: +0.37 to +1.10), decreased SBP (β: -0.030, 95% CI: -0.063 to −0.0004), decreased DBP (β: -0.028, 95% CI: -0.047 to −0.008), and decreased resting heart rate (β: -0.026 95% CI: -0.046 to −0.005).
Conclusions: In this large population-based study, we found that, even in a European context, living in a highly walkable neighborhood was associated with improved cardiometabolic health. Designing walkable neighborhoods may be a viable strategy in reducing cardiovascular disease prevalence at the population level.
Keywords: Built environment, Walkability, Walk score, Cardiovascular disease, Paris Background
Cardiovascular disease in industrialized countries, including those in the European Union, remains a significant public health problem [1–3]. Each year cardiovascular disease
causes over 4 million deaths in Europe and over 1.9 million deaths in the European Union, accounting for 40% of all deaths in the European Union [3]. In France, obesity prevalence significantly increased between 1995 and 2005 for all socio-economic status population sub-groups [4]. Furthermore, in a recent study of French adults, 19.1% of the participants had hypertension [5]. Like elsewhere, in the European Union, cardiovascular disease is costly [6]. For example, the cost of hypertension treatment has
* Correspondence:Dustin.Duncan@nyumc.org
4Department of Population Health, New York University School of Medicine,
227 East 30th Street, New York, NY 10016, USA
6Spatial Epidemiology Lab, Department of Population Health, New York
University School of Medicine, 227 East 30th Street, 6th Floor, Room 621, New York, NY 10016, USA
Full list of author information is available at the end of the article
© The Author(s). 2017 Open Access This article is distributed under the terms of the Creative Commons Attribution 4.0 International License (http://creativecommons.org/licenses/by/4.0/), which permits unrestricted use, distribution, and reproduction in any medium, provided you give appropriate credit to the original author(s) and the source, provide a link to the Creative Commons license, and indicate if changes were made. The Creative Commons Public Domain Dedication waiver (http://creativecommons.org/publicdomain/zero/1.0/) applies to the data made available in this article, unless otherwise stated.
Méline et al. BMC Public Health (2017) 17:960 DOI 10.1186/s12889-017-4962-8
increased from 2.6 billion euros in 2000 to 4.4 billion euros in 2006 in France [7].
Neighborhood factors, including neighborhood walk-ability (including access to walkable destinations such as parks and community design features that can promote walking such as sidewalks), can influence cardiovascular health outcomes across geographies and populations [8–16]. While a large number of neighborhood walkability studies have been conducted, the measures used to examine neighborhood walkability have varied considerably and many of these studies consider only single or few measures of walkable development [17]. Composite measures of neighborhood walkability such as Walk Score (www.walkscore.com) might be useful as predictors of cardiovascular health—as studies that use singe compo-nents of neighborhood walkability often generally document fewer relationships and are much less consistent regarding direction of effect [18].
Walk Score is a novel and valid measure of estimating certain aspects of neighborhood walkability, which pro-vides up-to-date geospatial walkability information [18]. However, to date, only a handful of research studies have utilized Walk Score as a measure of neighborhood walk-ability in connection to cardiovascular health outcomes [18]. Though the association between walkable neighbor-hoods and multiple cardio-metabolic outcomes has been posited [19], built environment influences on certain cardio-metabolic outcomes such as blood pressure are less frequently examined. Indeed, most such studies focus on physical activity as an outcome, which is further away from diseases and vital health status. The next most commonly analyzed outcome is obesity. It is also import-ant to note that several studies examining the associations of Walk Score on cardiovascular health outcomes have utilized small community-based U.S. samples. For example, in a study of 197 women Supplemental Nutrition Assistance Program (SNAP) participants in eastern North Carolina (U.S.), Walk Score was inversely associated with BMI. [20] Large population-based samples are necessary for detecting meaningful effects as well as for increasing generalizability across geographies and populations. Some recent Walk Score research has used larger population-based samples of adults and found associations between Walk Score and walking (e.g., a study including 4552 adults from the Multi-Ethnic Study of Atherosclerosis [MESA] study in 6 U.S. sites). [21] The current study adds to previous literature by expanding work utilizing Walk Score outside of the U.S. and examining multiple cardiometabolic outcomes. Though some Walk Score studies have been conducted in non-U.S. locations including in Canada [22–25] and Australia [26], this particular study in France will be beneficial in diversifying the literature and among the first such study to be conducted in the European Union.
[27, 28] In line with the recent Canadian and Australian research, the current study uses a larger sample size.
The purpose of the current study was to evaluate associations between Walk Score, as a composite measure of walkable neighborhood development, and selected car-diometabolic outcomes, including obesity, hypertension, and heart rate, among adults from the RECORD Study in the Paris metropolitan area. We hypothesized that higher Walk Scores are associated with improved cardiovascular health (e.g., associated with decreased body mass index, blood pressure, and heart rate).
Methods Study Population
The present cross-sectional analysis was based on data from the second wave of the Residential Environment and CORonary heart Disease (RECORD) Cohort (www.record-study.org). [29] Overall, 6003 adult participants were surveyed between January 2011 and March 2014. Among those, 3843 participants had already been enrolled in the RECORD Study in the first wave (2007–2008) and 2160 were new recruits. All participants were recruited as a convenience sample among individuals coming to the IPC Medical Center in Paris for a two-hour medical checkup. As eligibility criteria, participants were 34–84 years old and had to reside at recruitment in one of ten administra-tive divisions of Paris or in 111 other municipalities selected in the Paris metropolitan area. Among the 6003 participants, 5993 (99.9%) were geocoded based on their residential address in 2011–2014. Additional details on the study have been reported elsewhere. [29] The study protocol was approved by the French Data Protection Authority. The current secondary analysis was determined to be exempt by the New York University School of Medicine Institutional Review Board.
Measures Body mass index
During the medical checkup, height (using a wall-mounted stadiometer) and weight (using calibrated scales) were recorded by a nurse. [30] Body mass index (BMI) (weight/height2in kg/m2) was expressed as a continuous variable and participants were defined as obese (binary variable) if their BMI was >30 kg/m2.
Waist circumference
Waist circumference (in cm) was measured using an inelastic measurement tape placed midway between the lower ribs and iliac crests on the midaxillary lines and was expressed as a continuous variable.
Blood pressure and hypertension
Supine brachial blood pressure was measured by trained nurses three times in the right arm after a 10-minute
rest period, using a manual mercury sphygmomanom-eter. A standard cuff size was used, but a large cuff was employed if necessary. Systolic blood pressure (SBP) and diastolic blood pressure (DBP) were defined as the first and fifth Korotkoff phases, respectively, using the mean of the last two blood pressure measurements. [31] Anti-hypertensive medication use was assessed as a binary variable with the following questionnaire item:“Are you regularly taking antihypertensive medication?” Participants were defined as hypertensives (binary variable) if their measured SBP was≥140 mm Hg (mmHg) or if their DBP was ≥90 mmHg or if they had declared antihypertensive medications [32]. Family history of hypertension was self-reported.
Resting heart rate
Resting heart rate (RHR) was measured by ECG after a 5 to 7-min rest period [30] and was expressed as a continuous variable. Despite various categorizations in the literature [33–36], RHR was subsequently divided into three categories to be consistent with previous studies [37–40]: <60 beats per minute (bpm), 60–70 bpm, and >70 bpm.
Recreational walking
Recreational walking in the residential neighborhood, expressed in minutes per week of walking, was assessed as a continuous variable with the following questionnaire item:“Over the past 7 days, how long in hours and minutes you have walked in total for recreational walks or exercise in your residential neighborhood?”. Absence of walking is coded as 0 min. A binary variable of recreational walking in the residential neighborhood based on the same item distinguished participants with and without recreational walking.
Individual and neighborhood variables
Gender was coded as a binary variable and age was cate-gorized as follows: 34–49 years old, 50–64 years old, and 65–84 years old. Household status was coded in 3 clas-ses: living alone, as a couple, and as a family. Education was divided into four classes: no education (low), primary and low secondary education (mid-low), high secondary and low tertiary education (mid-high), and upper tertiary education (high). Employment status was coded as employed, unemployed, retired, and other. Self-reported financial strain and nonownership of dwelling were coded with binary variables.
Neighborhood socioeconomic status was defined as the education of the residents in circular buffers of 1 mile of radius centered on the residence of the participants. The educational level of the neighborhood residents was defined as the proportion of residents aged >20 years with an upper tertiary education (2010 Census). This variable was divided into 4 categories (quartiles) comprising a
similar number of participants. We selected these covariates based on past research, including our coding scheme and our relevant past work in the RECORD Cohort Study [41–44].
Risk factors of Cardiometabolic outcomes
Alcohol consumption was coded in four categories: Never drinkers, former drinkers (who declared not drinking alco-hol anymore), light drinkers (between one and≤two glasses per day for women and between one and≤three glasses per day for men), and drinkers (>two glasses per day for women and >three glasses per day for men). For smoking, we distinguished between nonsmoker, former smoker, and smoker. A 16-item questionnaire that assessed the score of adherence to the traditional Mediterranean diet was derived from previously validated question-naires [45, 46]. We assigned values of 0 or 1 to each item and added them. The variable of diet score was coded as a continuous variable.
Neighborhood walk score
Originally developed by Front Seat Management, Walk Score® (available at: www.walkscore.com) calculates neighborhood walkability using a web-based algorithm for a 1-mile radius of an address. The algorithm uses a distance-decay function. If the closest establishment of a certain type is within 0.25 miles, Walk Score assigns the maximum number of points for that type. No points are awarded for destinations more than 1-mile away. It uses publicly available data and places added by the Walk Score user community. Walk Score divides facilities into various categories including: educational (e.g., schools), retail (e.g., bookstores), food (e.g., restaurants), recreational (e.g., gyms), and entertainment (e.g., movie theaters). Each destination type is weighted equally. Walk Scores assigned to the various categories are summed and normalized into a continuous score ranging from 0 to 100. Higher scores indicate increased walkability. It is important to note that Walk Score has been validated against several features of the built environment (e.g., retail destinations, service destinations, parks, street connectivity, and resi-dential density) created using geographical information systems (GIS) technology [47–50]. In addition, Walk Score has been associated with individuals’ perception of their built environment (e.g., perceived physical activity facilities) [47]. For this study, Walk Scores were obtained from Walk Score in April and June 2014 for the geo-graphic coordinates of each participant’s street address in the second wave of the RECORD Study. The traditional Walk Score was used in this analysis, which uses an ‘as the crows flies’ distance, as opposed to the Street Smart Walk Score which accounts for the pedestrian friendliness factors (e.g., average block length), because these were the only measures available to us. To minimize spatial
misclassification, [11] we used participants’ actual address, as opposed to an administrative area (e.g., census tract). Walk Scores were examined continuously and using categories designated by Walk Score: 0–24, “Very Car-Dependent” (almost all errands require a car); 25–49, “Car-Dependent” (a few amenities within walking dis-tance); 50–69, “Somewhat Walkable” (some amenities within walking distance); 70–89, “Very Walkable” (most errands can be accomplished on foot); and 90–100, “Walker’s Paradise” (daily errands do not require a car).
Statistical analysis
We first conducted descriptive analyses, calculating means and standard deviations for study variables. Multilevel linear regression models (with a random effect at the census block group neighborhood level) were then estimated with the restricted maximum likelihood approach to examine associations for Walk Score with the continuous outcomes: BMI, waist circumference, SBP, DBP, RHR, and neighborhood recreational walking (in minutes per week). The multilevel linear regression models were estimated with participants nested within 2084 census block group neighborhoods. These units, defined for the Population Census, were relatively homo-geneous in terms of sociodemographic and housing characteristics. Overall, 33% of the census block groups comprised only one participant. This is not a problem with this methodology in which neighborhoods with only one participant do not contribute to the neighborhood-level variance. The distribution of the residuals were approximately normal.
In the analysis of BP, since controlling for antihyperten-sive medication use in this analysis can introduce bias (as the treatment is itself a consequence of a high underlying BP level) [51], we added a constant to the observed BP (10 mmHg for SBP and 3.24 mmHg for DBP) in treated subjects to account for the treatment effect on BP, instead of adjusting (as previously recommended) [51, 52].
Since the prevalence of obesity and hypertension re-spectively reached 12.3% and 34.1%, modified Poisson [53] regression models (yielding a robust variance estimator based on the Generalized Estimating Equations) were estimated to examine associations of Walk Score with the binary variables of obesity, hypertension, and neighbor-hood recreational walking, and also with resting heart rate as a categorical variable, in order to derive relative risks.
For each sample, a null model was first estimated. Then, models for the associations with Walk Score were adjusted for participant-level variables. Models were then adjusted for neighborhood-level education. For the linear models, we report beta coefficients expressing increases/ decreases: in kg/m2of BMI, in cm of waist circumference, in mmHg of BP, in bpm of resting heart rate, and in minutes per week of neighborhood recreational walking.
These increases/decreases were associated: 1) with a one point increase in the continuous variable of Walk Score; and 2) with“Very / Car-dependent”, “Somewhat Walkable”, “Very Walkable”, in comparison with “Walker’s Paradise” (categorical variable of Walk Score). For the modified Poisson models, we reported prevalence ratios for being obese, for being hypertensive, for a higher resting heart rate, and for practicing recreational walking in one’s residential neighborhood associated with “Very/Car-dependent”, “Somewhat Walkable”, “Very Walkable”, in comparison with “Walker’s Paradise” (categorical variable of Walk Score). The categories “Car-Dependent” and “Very Car-Dependent” were grouped into one category: “Very/Car-Dependent” in order to ensure sufficient statis-tical power, which has also been done in previous Walk Score research [54]. All analyses were conducted with SAS version 9.3 (Cary, North Carolina, U.S.).
Results
Descriptive statistics
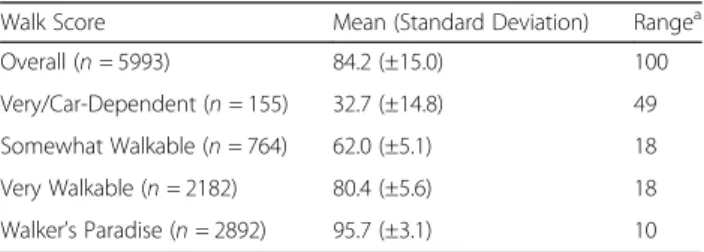
Table 1 shows descriptive statistics for Walk Scores. The largest group of participants lived in Walker’s Paradise (48.3%), with a mean Walk Score of 95.7 (SD = ±3.1), followed by Very Walkable neighborhoods (36.4% of participants, mean Walk Score = 80.4, SD = ±5.6). The 10th, 50th, and 90th percentiles of the Walk Score in the sample were 65, 88, and 98 respectively. Table 2 shows descriptive statistics for the RECORD participants. The mean age of the sample was 53.7 years and most partici-pants were male (67.3%). In addition, most participartici-pants reported living as a couple, having a high level of educa-tion, and being employed. Approximately 60% reported owning their dwelling. The prevalence of recreational walking in the neighborhood was 68.7%.
Association between neighborhood walk score and Cardiometabolic outcomes
The distribution of cardiometabolic outcomes according to the Walk Score is shown in Table 3. Living in more walkable neighborhoods was associated with a lower BMI, a smaller waist circumference, increased recreational walk-ing in the residential neighborhood, a lower SBP, a lower DBP, and a lower RHR (all p for trend <0.01).
Table 1 Descriptive statistics for Walk Scores
Walk Score Mean (Standard Deviation) Rangea
Overall (n = 5993) 84.2 (±15.0) 100 Very/Car-Dependent (n = 155) 32.7 (±14.8) 49 Somewhat Walkable (n = 764) 62.0 (±5.1) 18 Very Walkable (n = 2182) 80.4 (±5.6) 18 Walker’s Paradise (n = 2892) 95.7 (±3.1) 10 a
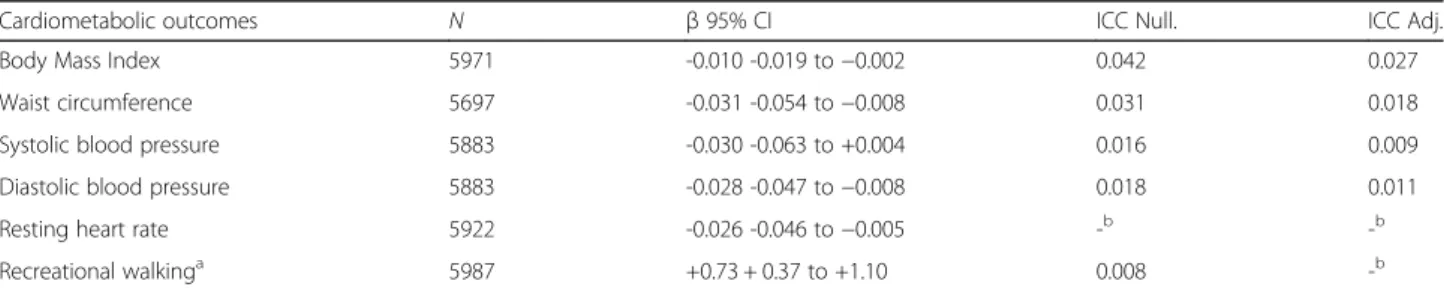
These relationships persisted in adjusted models (Table 4). After adjustment for individual variables, neighborhood variables, and risk factors for CVD outcomes, we found that Walk Score was associated with decreased BMI (β: -0.010, 95% CI: -0.019 to −0.002 for a unit increase in Walk Score), decreased waist circumference (β: -0.031, 95% CI: -0.054 to −0.008), increased neighborhood recre-ational walking (β: +0.73, 95% CI: +0.37 to +1.10), decreased SBP (β: -0.030, 95% CI: -0.063 to +0.004), decreased DBP (β: -0.028, 95% CI: -0.047 to −0.008), and decreased RHR (β: -0.026, 95% CI: -0.046 to −0.005).
Compared to living in Walker’s Paradise, living in very walkable and particularly in very/car dependent neigh-borhoods was associated with a higher BMI, increased obesity prevalence, and a larger waist circumference (Table 5). For example, individuals living in a very/car-dependent neighborhood were 1.66 (95% CI: 1.09 to 2.52) times more likely to be obese. Living in very/car
dependent neighborhoods, compared to living in Walker’s Paradise, was associated with higher DBP (Table 5). More specifically, individuals living in a very/ car-dependent neighborhood had a 1.84 (95% CI: 0.21 to 3.46) mmHg higher DBP. Walk Score categories were not significantly associated with SBP or RHR. Lastly, living in less walkable neighborhoods, compared to living in Walker’s Paradise, was associated with decreased neighborhood recreational walking (Table 5). For example, individuals living in a very/car-dependent neighborhood had approximately 45 (95% CI, −75.91 to −14.01) fewer minutes of neighbor-hood recreational walking over the previous 7 days.
Discussion
The current study builds on and addresses certain limi-tations of existing built environment research, by using Walk Score data, in a unique population-based sample of adults in the Paris metropolitan area (Paris, France). This is one of the largest studies to examine relation-ships between Walk Score and selected cardiometabolic outcomes. Additionally, this is one of few Walk Score studies to be conducted outside of the U.S., and one of the first in Europe to our best knowledge. In this study, we found that living in more walkable neighborhoods was associated with a lower BMI, a smaller waist circum-ference, increased recreational walking in the residential neighborhood, a lower SBP, a lower DBP, and lower resting heart rate. The reported relationships were modest, which is likely due to the large causal distance between the envir-onmental Walk Score and the cardiometabolic outcomes of interest. Despite their limited clinical significance for a given individual, these findings may have a public health importance as they contribute with other factors (e.g., socioeconomic status) to shape population-level dispar-ities in health. Our results were robust to different ways to categorize Walk Score and robust to covariate adjustment. We note that reductions in diastolic BP are not nearly as important as reductions in systolic blood pressure, which is the principal driver of long term cardiovascular risk.
Previous studies, frequently using smaller samples, have examined relationships between Walk Score and cardiovascular health outcomes in the U.S. context pre-dominantly, and our results are comparable to these studies, including those across geographies. For instance, previous research has found associations between Walk Score and BMI [20, 24, 55, 56], hypertension [22], heart rate [55] and physical activity or walking [21, 23–26, 54–57]. The vast majority of these studies analyze associations between Walk Score and physical activity or walking and often analyze transportation walking. Unfortunately, the second wave of the RECORD Study did not have transpor-tation walking and in a previous analysis with the first wave of the RECORD Study (as opposed to the second wave in the present study) found densities of destinations (Walk
Table 2 Descriptive statistics for the RECORD participants (N = 5993)
Individual socio-demographic characteristics Participants (N = 5993) % (N) Gender Male 67.3% (4035) Female 32.7% (1958) Age 34–49 40.1% % (2403) 50–64 41.3% (2474) 65–84 18.7% (1116) Household status Living alone 27.2% % (1136) Living as a couple 61.7% (2580) Living as a family 11.1% (463) Individual education High 41.6% (2476) Mid-high 29.7% (1768) Mid-low 22.0% (1311) Low 6.7% (400) Financial strain Yes 14.5% (868) No 85.5% (5125) Employment status Employed 60.1% (3603) Unemployed 13.2% (791) Retired 23.5% (1405) Other 3.2% (194) Ownership of dwelling Owner 59.8% (3586) Nonowner 40.2%(2407)
Score was not available) to be associated with recreational walking [41]. We concluded that this typical predictor of transportation walking was also relevant to recreational walking. Recreational walking could be associated with Walk Score because one could choose to walk in a neighborhood the look at different amenities. In a similar study, we sought to explore associations that might emerge between Walk Score, transportation mode choice, and walking at the trip level among Paris adults who were tracked with GPS receivers and accelerometers from the RECORD GPS Study (n = 227 participants; 6969 trips) [58]. When we adjusted trip-level associations between Walk Score and walking only in the trip, the findings indicated that there was an association between walkable neighborhood at the trip origin and the trip destination and an increased odds of walking in the trip—assessed
through the survey. Furthermore, we observed the number of steps per 10 min (which was assessed with accelerometry) to be cumulatively higher for trips that originated and ended in walkable neighborhoods (i.e. “Very Walkable”). In addition, similar to our study find-ings, Hisch and her colleagues found that Walk Score was associated with leisure walking [21].
There are several potential explanations for our findings. Walk Score primarily measures access to destinations and as such people may be walking to these proximate desti-nations, increasing their physical activity and reducing clinical cardiovascular disease-related outcomes. Moreover, it is possible that increases in neighborhood destinations may be related to pleasantness of the neighborhood, which could also be associated with improved overall cardiovas-cular health through pathways other than strictly walking
Table 4 Associations estimated between continuous Walk Score and cardiometabolic outcomes, adjusted for individual variables, neighborhood variables and risk factors related to cardiometabolic outcomes
Cardiometabolic outcomes N β 95% CI ICC Null. ICC Adj. Body Mass Index 5971 -0.010 -0.019 to−0.002 0.042 0.027 Waist circumference 5697 -0.031 -0.054 to−0.008 0.031 0.018 Systolic blood pressure 5883 -0.030 -0.063 to +0.004 0.016 0.009 Diastolic blood pressure 5883 -0.028 -0.047 to−0.008 0.018 0.011 Resting heart rate 5922 -0.026 -0.046 to−0.005 -b -b Recreational walkinga 5987 +0.73 + 0.37 to +1.10 0.008 -b
Abbreviations: ICC Null Intra-class Correlation Coefficient for the null model (only age and gender), ICC Adj Intra-class Correlation Coefficient, after adjustment for Walk Score and individual, neighborhood factors, and risk factors of the cardiometabolic outcomes (except recreational walking). Walk score was expressed as a continuous score ranging from 0 to 100 in the residential neighborhood. The variables of BMI (in kg/m2
), waist circumference (in centimeter), recreational walking (in minutes/week of walking), and resting heart rate (in beats/min) were expressed as continuous variables. SBP and DBP (in mmHg) were expressed as continuous variables with 10 mmHg added to the observed SBP values and with 3.24 mmHg added to the observed DBP values for the participants on antihypertensive treatment. Multilevel linear regression models were estimated after excluding individuals with missing values for Walk Score, for census block group neighborhoods, and for each cardiometabolic outcome
a
Multilevel linear regression models were estimated after adjusting for individual and neighborhood variablesb
In certain models, the between-neighborhood variance could not be estimated after adjustment, possibly due to the very low level of clustering
Table 3 Distribution of cardiometabolic outcomes according to the Walk Score
Walk Score BMI
Mean ± SD (P25; P75) Waist circumference Mean ± SD (P25; P75) Recreational walking Mean ± SD (P25; P75) N = 5971 N = 5697 N = 5987 Very/Car-Dependent Somewhat Walkable Very Walkable Walker’s Paradise 26.3 ± 3.9 (23.9; 28.1) 25.9 ± 3.9 (23.1; 28.0) 25.9 ± 4.2 (23.1; 28.1) 25.1 ± 3.9 (22.5; 27.3) 90.1 ± 11.2 (84.0; 96.0) 88.0 ± 11.4 (80.0; 96.0) 88.4 ± 11.9 (80.0; 96.0) 86.8 ± 11.7 (79.0; 94.0) 115.4 ± 175.4 (0; 180.0) 99.3 ± 155.6 (0; 120.0) 113.4 ± 181.2 (0; 120.0) 132.4 ± 182.6 (0; 180.0) P For Trenda <.0001a <.0001a <.0001a Walk Score SBP Mean ± SD (P25; P75) DBP Mean ± SD (P25; P75) RHR Mean ± SD (P25; P75) N = 5883 N = 5883 N = 5922 Very/Car-Dependent Somewhat Walkable Very Walkable Walker’s Paradise 133.0 ± 16.2 (123.0; 143.0) 132.8 ± 16.8 (121.0; 142.0) 132.7 ± 16.2 (121.5; 141.5) 131.5 ± 16.5 (120.0; 141.5) 80.0 ± 9.6 (73.0; 86.5) 79.2 ± 9.4 (73.0; 85.0) 78.9 ± 9.5 (72.5; 85.0) 77.9 ± 9.2 (71.5; 83.5) 61.0 ± 9.1 (55.0; 67.0) 62.1 ± 9.6 (55.0; 68.0) 61.8 ± 10.0 (55.0; 68.0) 60.9 ± 9.8 (54.0; 67.0) P For Trenda 0.0005a <.0001a 0.0004a a
P values for trends were estimated from the Jonckheere-Terpstra test
Abbreviations: BMI Body Mass Index, Recreational walking in the residential neighborhood, SBP Systolic Blood Pressure, DBP Diastolic Blood Pressure, RHR Resting Heart Rate
to these destinations (such as recreational, non-purposive walking).
Although the results from the current study need to be confirmed with strong study designs such as a pro-spective cohort study design, findings from this study suggest that changes to the built environment can be implemented. Perhaps, providing nearby access to a wide range of destinations may have its importance for cardiovascular disease prevention. Pursuing these built environment interventions may require support from multiple sectors, including urban planners and economic developers [17].
Future research directions
Walk Score and other composite measures of neighbor-hood walkability (e.g., Walk Shed) can be used in future research to elucidate their potential connections to health outcomes such as cardio-metabolic outcomes examined in the present study including obesity and hypertension. When possible, these future investigations should utilize a prospective cohort research design to improve causal inference. We note that emerging longi-tudinal studies of Walk Score and health outcomes have been conducted. [56] Historical Walk Scores (currently not available) would be useful to integrate into existing population health datasets to conduct longitudinal analyses. Furthermore, studies should be conducted across the European Union and other global geographic locations with various samples (e.g., young children and older adults). Studies using standardized analytical designs should be conducted to compare Walk Score effects, e.g., between Europe and North America. Such cross-national
studies can potentially demonstrate the salience of neigh-borhood walkability on cardiovascular health. Finally, in addition to the traditional Walk Score, future studies can examine the cardiovascular health effects of the Street Smart Walk Score (an enhanced version of Walk Score that uses walking distances rather than crow-flies distances to calculate the score) as well as Walk Score’s Transit Score (a measure of how well a location is served by public transit) and Walk Score’s new Bike Score (a measure of whether a location is good for biking).
Study strengths and limitations
This study has a number of strengths including the large and diverse population-based sample encompassing a variety of environmental conditions in a European metropolitan area and several objectively measured cardio-metabolic outcomes. However, there are a number of limitations that also should be recognized. First, we conducted a cross-sectional analysis. Therefore, while we found an association between neighborhood Walk Score and cardiovascular-related factors, these relationships are not causal. Moreover, we only considered selected cardio-metabolic outcomes, and others would have been relevant to analyze, e.g., inflammatory markers. We did not adjust for whether specific participants with particularly healthy cardiovascular profiles chose to live in highly walkable neighborhoods. However, as previously discussed, a recent prospective cohort study reported relationships between Walk Score and cardiovascular health outcomes (i.e. walking and BMI) [56] and recent studies suggest that the impact of neighborhood self-selection is minimal in studies of neighborhood built environments and
Table 5 Associations estimated between categorical Walk Score and cardiometabolic outcomes, adjusted for individual variables, neighborhood variables and risk factors related to cardiometabolic outcomes
Cardiometabolic outcomes Walker’s Paradise Very Walkable Somewhat Walkable Very/Car-Dependent Continuous outcomes β 95% CI β 95% CI β 95% CI
Body Mass Index Ref +0.30 + 0.04 to +0.55 +0.11 -0.26 to +0.48 +0.88 + 0.18 to +1.59 Wait circumference Ref +0.75 + 0.06 to +1.45 +0.44 -0.55 to +1.42 +2.75 + 0.86 to +4.63 Systolic blood pressure Ref +0.47 -0.53 to +1.48 +0.77 -0.68 to +2.21 +1.62 -1.18 to +4.43 Diastolic Blood pressure Ref +0.39 -0.20 to +0.97 +0.61 -0.22 to +1.45 +1.84 + 0.21 to +3.46 Resting heart rate Ref +0.58 -0.04 to +1.20 +0.85 -0.04 to +1.74 +0.68 -1.07 to +2.42 Recreational walkinga Ref −14.46 -25.51 to −3.42 −26.96 -42.84 to −11.08 −44.96 -75.91 to −14.01
Categorical outcomes PR 95% CI PR 95% CI PR 95% CI Obese Ref 1.23 1.04 to 1.46 1.02 0.80 to 1.30 1.66 1.09 to 2.52 Hypertension Ref 0.99 0.91 to 1.07 1.00 0.89 to 1.12 1.10 0.87 to 1.39 Resting heart rate Ref 1.02 0.99 to 1.04 1.02 0.98 to 1.07 1.04 0.96 to 1.12 Recreational walkinga Ref 0.96 0.92 to 1.01 0.93 0.87 to 0.99 0.93 0.82 to 1.06
Multilevel linear regression and modified Poisson regression models were estimated after excluding individuals with missing values for Walk Score, for census block group neighborhoods, and for each cardiometabolic outcome. These models estimated associations between categorical Walk Score and continuous and categorical cardiometabolic outcomes, adjusted for individual, neighborhood factors, and risk factors of these cardiometabolic outcomes, such as alcohol consumption, smoking habits, and the quantitative score of adherence to Mediterranean diet
a
These models were estimated after adjusting for individual and neighborhood variables
cardiovascular health [59]. In addition, while Walk Score has been validated in the U.S., no Walk Score validation research has been conducted in Paris in France more broadly or in Europe [18]. We have no reason however, to believe that our Walk Score data for the Paris metropolitan area is substantially different than data in the U.S.-based studies, especially because most validation studies have been in urban settings. Previous Walk Score validation research, for example, has found higher correlations be-tween Walk Scores and population density in geographic locations with increasing population density [50] and Paris is a densely populated city. This study used the standard Walk Score, which may be a limitation. As described previ-ously, the standard Walk Score does not take into account for pedestrian friendliness factors intersection density. The Street Smart Walk Score was not available to us for the Paris metropolitan area at the time of data collection. However, previous research has found strong correlations between the standard Walk Score and the Street Smart Walk Score [21]. We recognize that Walk Score is a useful proxy for only certain neighborhood walkability indicators (e.g., retail destinations and intersection density) [47, 50]. Walk Score does not consider certain neighborhood-related characteristics (e.g., traffic) and weights all destina-tions equally, which may result in misclassification compared to a “true” walkability indicator. In addition, spatial polygamy [60–63] and the uncertain geographic context problem [64, 65] may be concerns that we did not address in this study. For this study, we only had Walk Scores for participants’ residential addresses, and for example not for their work locations [66, 67]. Generalizability may also be a concern. For example, findings from this study might not be generalizable to urbanized non-industrialized countries. Finally, residual confounding might be a concern due to other not men-tioned reasons. For example, we did not control for individual-level race/ethnicity in the current study. In our previous U.S.-based research, we control for race/ethnicity as a covariate. Race/ethnicity is not typically considered in French studies, however, for ethical reasons. Thus this variable was not available for us to analyze.
Conclusion
Walk Score is a valid measure for estimating certain aspects of neighborhood walkability and provides up-to-date geospatial walkability information [18]. In a population-based sample of adults in the Paris metro-politan area, we found that living in a highly walkable neighborhood was associated with improved cardiovascular health (e.g., decreases in BMI and blood pressure). Designing walkable neighborhoods may be a viable strategy in reducing cardiovascular disease prevalence at the population level.
Abbreviations
BMI:Body mass index; DBP: Diastolic blood pressure; ICC Adj.: Intra-class Correlation Coefficient, after adjustment for Walk Score and individual, neighborhood factors, and risk factors of the cardiometabolic outcomes (except recreational walking).; ICC Null: Intra-class Correlation Coefficient for the null model (only age and gender); RECORD: Residential Environment and CORonary heart Disease; RHR: Resting heart rate; SBP: Systolic blood pressure; SNAP: Supplemental Nutrition Assistance Program
Acknowledgements
We thank the NYU Global Public Health Research Challenge Fund (Dr. Dustin Duncan, Principal Investigator) for funding for this study. The RECORD Study (Dr. Basile Chaix, Principal Investigator) was supported by INPES (National Institute for Prevention and Health Education); IReSP (Institute for Public Health Research); InVS (National Institute of Public Health Surveillance); French Ministries of Research and Health; CNAM-TS (National Health Insurance Office for Salaried Workers); and the Ile-de-France Regional Health Agency (ARS). We thank Samantha Bennett, Daniel Hagen and Lucy Yang for their assistance with the preparation of this manuscript. We thank Kristen Day and Jermaine Blakley for commenting on an early version of this manuscript.
Funding
NYU Global Public Health Research Challenge Fund. Availability of data and materials
The data in this study came from the second wave of the Residential Environment and CORonary heart Disease (RECORD) Cohort (www.record-study.org). Authors’ contributions
JM assisted with the study design, performed the statistical analysis, interpreted the results, and assisted with writing the manuscript. BC conceived the study, interpreted the results, critically revised the manuscript for substantial intellectual content and is the principal investigator of the parent study. BP contributed to the definition of the procedures for recruiting the participants for the parent study and critically revised the manuscript for substantial intellectual content. GO, LT, JA critically revised the manuscript for substantial intellectual content. DTD conceived the study, interpreted the results, and drafted the manuscript. All authors have read and approved the final manuscript.
Ethics approval and consent to participate
No formal ethics was needed as this was secondary data analysis. However, the study protocol was approved by the French Data Protection Authority. The current secondary analysis was determined to be exempt by the New York University School of Medicine Institutional Review Board.
Consent for publication Not applicable. Competing interests
The authors declare that they have no competing interests.
Publisher’s Note
Springer Nature remains neutral with regard to jurisdictional claims in published maps and institutional affiliations.
Author details 1
Sorbonne Universités, UPMC Univ Paris 06, UMR_S 1136, Pierre Louis Institute of Epidemiology and Public Health, 1 rue Victor Cousin, 75230, 05 Paris cedex, France.2Inserm, UMR_S 1136, Pierre Louis Institute of
Epidemiology and Public Health, 56, boulevard Vincent Auriol CS 81393, 75646 Paris Cedex 13, France.3IPC Medical Center, 6 Rue la Pérouse, 75016 Paris, France.4Department of Population Health, New York University School
of Medicine, 227 East 30th Street, New York, NY 10016, USA.5Departments of
Pediatrics and Environmental Medicine, New York University School of Medicine, 550 First Avenue, New York, NY 10016, USA.6Spatial Epidemiology Lab, Department of Population Health, New York University School of Medicine, 227 East 30th Street, 6th Floor, Room 621, New York, NY 10016, USA.
Received: 11 May 2017 Accepted: 29 November 2017
References
1. Reddy KS, Yusuf S. Emerging epidemic of cardiovascular disease in developing countries. Circulation. 1998;97(6):596–601.
2. Wolf-Maier K, Cooper RS, Banegas JR, Giampaoli S, Hense HW, Joffres M, Kastarinen M, Poulter N, Primatesta P, Rodriguez-Artalejo F, et al.
Hypertension prevalence and blood pressure levels in 6 European countries, Canada, and the United States. JAMA. 2003;289(18):2363–9.
3. Nichols M, Townsend N, Luengo-Fernandez R, Leal J, Gray A, Scarborough P, Rayner M. European cardiovascular disease statistics 2012. In: European heart network, European society of cardiology; 2012.
4. Czernichow S, Vergnaud AC, Maillard-Teyssier L, Peneau S, Bertrais S, Mejean C, Vol S, Tichet J, Hercberg S. Trends in the prevalence of obesity in employed adults in central-western France: a population-based study, 1995-2005. Prev Med. 2009;48(3):262–6.
5. Wiernik E, Nabi H, Pannier B, Czernichow S, Hanon O, Simon T, Simon JM, Thomas F, Ducolombier C, Danchin N, et al. Perceived stress, sex and occupational status interact to increase the risk of future high blood pressure: the IPC cohort study. J Hypertens. 2014;32(10):1979–86. discussion 1986 6. Leal J, Luengo-Fernandez R, Gray A, Petersen S, Rayner M. Economic burden
of cardiovascular diseases in the enlarged European Union. Eur Heart J. 2006;27(13):1610–9.
7. Assurance Maladie: Hypertension artérielle et facteurs de risque associés. In: Point d’information mensuel. vol. 19 octobre 2007; 2007.
8. Auchincloss AH, Diez Roux AV, Mujahid MS, Shen M, Bertoni AG, Carnethon MR. Neighborhood resources for physical activity and healthy foods and incidence of type 2 diabetes mellitus: the multi-ethnic study of atherosclerosis. Arch Intern Med. 2009;169(18):1698–704.
9. Chaix B. Geographic life environments and coronary heart disease: a literature review, theoretical contributions, methodological updates, and a research agenda. Annu Rev Public Health. 2009;30:81–105.
10. Coffee NT, Howard N, Paquet C, Hugo G, Daniel M. Is walkability associated with a lower cardiometabolic risk? Health Place. 2013;21:163–9.
11. Duncan DT, Kawachi I, Subramanian SV, Aldstadt J, Melly SJ, Williams DR. Examination of how neighborhood definition influences measurements of youths' access to tobacco retailers: a methodological note on spatial misclassification. Am J Epidemiol. 2014;179(3):373–81.
12. Li F, Harmer P, Cardinal BJ, Vongjaturapat N. Built environment and changes in blood pressure in middle aged and older adults. Prev Med. 2009;48(3):237–41. 13. Mujahid MS, Diez Roux AV, Morenoff JD, Raghunathan TE, Cooper RS, Ni H,
Shea S. Neighborhood characteristics and hypertension. Epidemiology. 2008;19(4):590–8.
14. Muller-Riemenschneider F, Pereira G, Villanueva K, Christian H, Knuiman M, Giles-Corti B, Bull FC. Neighborhood walkability and cardiometabolic risk factors in Australian adults: an observational study. BMC Public Health. 2013;13:755. 15. Paquet C, Coffee NT, Haren MT, Howard NJ, Adams RJ, Taylor AW, Daniel M.
Food environment, walkability, and public open spaces are associated with incident development of cardio-metabolic risk factors in a biomedical cohort. Health Place. 2014;28:173–6.
16. Unger E, Diez-Roux AV, Lloyd-Jones DM, Mujahid MS, Nettleton JA, Bertoni A, Badon SE, Ning H, Allen NB. Association of neighborhood characteristics with cardiovascular health in the multi-ethnic study of atherosclerosis. Circ Cardiovasc Qual Outcomes. 2014;7(4):524–31.
17. Cradock A, Duncan DT. The role of the built environment in supporting health behavior change. In: The handbook of health behavior change. 4th ed. New York: Springer Publishing Company; 2013.
18. Duncan DT. What's your walk score(R)?: web-based neighborhood walkability assessment for health promotion and disease prevention. Am J Prev Med. 2013;45(2):244–5.
19. Diez Roux AV. Residential environments and cardiovascular risk. J Urban Health. 2003;80(4):569–89.
20. Jilcott Pitts SB, McGuirt JT, Carr LJ, Wu Q, Keyserling TC. Associations between body mass index, shopping behaviors, amenity density, and characteristics of the neighborhood food environment among female adult supplemental nutrition assistance program (SNAP) participants in eastern North Carolina. Ecol Food Nutr. 2012;51(6):526–41.
21. Hirsch JA, Moore KA, Evenson KR, Rodriguez DA, Diez Roux AV. Walk score(R) and transit score(R) and walking in the multi-ethnic study of atherosclerosis. Am J Prev Med. 2013;45(2):158–66.
22. Chiu M, Rezai MR, Maclagan LC, Austin PC, Shah BR, Redelmeier DA, Tu JV. Moving to a highly Walkable neighborhood and incidence of hypertension: a propensity-score matched cohort study. Environ Health Perspect. 2016; 124(6):754–60.
23. Winters M, Barnes R, Venners S, Ste-Marie N, McKay H, Sims-Gould J, Ashe MC. Older adults’ outdoor walking and the built environment: does income matter? BMC Public Health. 2015;15(1):876.
24. Chiu M, Shah BR, Maclagan LC, Rezai M-R, Austin PC, Tu JV. Walk score® and the prevalence of utilitarian walking and obesity among Ontario adults: a cross-sectional study. Health Rep. 2015;26(7):3–10.
25. Thielman J, Rosella L, Copes R, Lebenbaum M, Manson H. Neighbourhood walkability: differential associations with self-reported transport walking and leisure-time physical activity in Canadian towns and cities of all sizes. Prev Med. 2015;
26. Cole R, Dunn P, Hunter I, Owen N, Sugiyama T. Walk score and Australian adults' home-based walking for transport. Health & place. 2015;35:60–5. 27. Riley DL, Mark AE, Kristjansson E, Sawada MC, Reid RD. Neighbourhood walkability and physical activity among family members of people with heart disease who participated in a randomized controlled trial of a behavioural risk reduction intervention. Health Place. 2013;21:148–55. 28. Manaugh K, El-Geneidy A. Validating walkability indices: how do different
households respond to the walkability of their neighborhood? Transp Res Part D: Transp Environ. 2011;16(4):309–15.
29. Chaix B, Kestens Y, Bean K, Leal C, Karusisi N, Meghiref K, Burban J, Fon Sing M, Perchoux C, Thomas F, et al. Cohort profile: residential and non-residential environments, individual activity spaces and cardiovascular risk factors and diseases–the RECORD cohort study. Int J Epidemiol. 2012;41(5):1283–92. 30. Thomas F, Bean K, Pannier B, Oppert JM, Guize L, Benetos A. Cardiovascular
mortality in overweight subjects: the key role of associated risk factors. Hypertension. 2005;46(4):654–9.
31. Benetos A, Thomas F, Pannier B, Bean K, Jego B, Guize L. All-cause and cardiovascular mortality using the different definitions of metabolic syndrome. Am J Cardiol. 2008;102(2):188–91.
32. Chalmers J, MacMahon S, Mancia G, Whitworth J, Beilin L, Hansson L, Neal B, Rodgers A, Ni Mhurchu C, Clark T. 1999 World Health Organization-International Society of Hypertension Guidelines for the management of hypertension. Guidelines sub-committee of the World Health Organization. Clin Exp Hypertens. 1999;21(5–6):1009–60.
33. Lee JM, Kim HC, Kang JI, Suh I. Association between stressful life events and resting heart rate. BMC Psychol. 2014;2:29.
34. Zurek M, Maeder MT, Rickli H, Muzzarelli S, Sanders-Van Wijk S, Abbuhl H, Handschin R, Jeker U, Pfisterer M, Brunner-La Rocca HP: Differential Prognostic Impact of Resting Heart Rate in Older Compared to Younger Patients with Chronic Heart Failure - Insights from TIME-CHF. J Card Fail 2015;21(4):347-54. 35. Fox K, Ford I, Steg PG, Tendera M, Ferrari R. Ivabradine for patients with
stable coronary artery disease and left-ventricular systolic dysfunction (BEAUTIFUL): a randomised, double-blind, placebo-controlled trial. Lancet. 2008;372(9641):807–16.
36. Palatini P. Need for a revision of the normal limits of resting heart rate. Hypertension. 1999;33(2):622–5.
37. Khan H, Kunutsor S, Kalogeropoulos AP, Georgiopoulou VV, Newman AB, Harris TB, Bibbins-Domingo K, Kauhanen J, Gheorghiade M, Fonarow GC, et al. Resting heart rate and risk of incident heart failure: three prospective cohort studies and a systematic meta-analysis. J Am Heart Assoc. 2015;4(1): e001364.
38. Van Hulst A, Thomas F, Barnett TA, Kestens Y, Gauvin L, Pannier B, Chaix B. A typology of neighborhoods and blood pressure in the RECORD cohort study. J Hypertens. 2012;30(7):1336–46.
39. Pfister R, Michels G, Sharp SJ, Luben R, Wareham NJ, Khaw KT. Resting heart rate and incident heart failure in apparently healthy men and women in the EPIC-Norfolk study. Eur J Heart Fail. 2012;14(10):1163–70.
40. Chaix B, Bean K, Leal C, Thomas F, Havard S, Evans D, Jego B, Pannier B. Individual/neighborhood social factors and blood pressure in the RECORD cohort study: which risk factors explain the associations? Hypertension. 2010;55(3):769–75.
41. Perchoux C, Kestens Y, Brondeel R, Chaix B. Accounting for the daily locations visited in the study of the built environment correlates of recreational walking (the RECORD cohort study). Prev Med. 2015;81:142–9. 42. Méline J, Van Hulst A, Thomas F, Chaix B. Road, rail, and air transportation
noise in residential and workplace neighborhoods and blood pressure (RECORD study). Noise and Health. 2015;17(78):308.
43. Leal C, Bean K, Thomas F, Chaix B. Are associations between neighborhood socioeconomic characteristics and body mass index or waist circumference based on model extrapolations? Epidemiology. 2011; 22(5):694–703.
44. Karusisi N, Thomas F, Méline J, Chaix B. Spatial accessibility to specific sport facilities and corresponding sport practice: the RECORD study. Int J Behav Nutr Phys Act. 2013;10(1):48.
45. Estruch R, Martinez-Gonzalez MA, Corella D, Salas-Salvado J, Ruiz-Gutierrez V, Covas MI, Fiol M, Gomez-Gracia E, Lopez-Sabater MC, Vinyoles E, et al. Effects of a Mediterranean-style diet on cardiovascular risk factors: a randomized trial. Ann Intern Med. 2006;145(1):1–11.
46. Martinez-Gonzalez MA, Fernandez-Jarne E, Serrano-Martinez M, Wright M, Gomez-Gracia E. Development of a short dietary intake questionnaire for the quantitative estimation of adherence to a cardioprotective Mediterranean diet. Eur J Clin Nutr. 2004;58(11):1550–2. 47. Carr LJ, Dunsiger SI, Marcus BH. Walk score as a global estimate of
neighborhood walkability. Am J Prev Med. 2010;39(5):460–3. 48. Carr LJ, Dunsiger SI, Marcus BH. Validation of walk score for estimating
access to walkable amenities. Br J Sports Med. 2011;45(14):1144–8. 49. Duncan D, Aldstadt J, Whalen J, Melly S. Validation of walk scores and
transit scores for estimating neighborhood walkability and transit availability: a small-area analysis. GeoJournal. 2013;78(2):407–16.
50. Duncan DT, Aldstadt J, Whalen J, Melly SJ, Gortmaker SL. Validation of walk score for estimating neighborhood walkability: an analysis of four US metropolitan areas. Int J Environ Res Public Health. 2011;8(11):4160–79. 51. Tobin MD, Sheehan NA, Scurrah KJ, Burton PR. Adjusting for treatment
effects in studies of quantitative traits: antihypertensive therapy and systolic blood pressure. Stat Med. 2005;24(19):2911–35.
52. Cui JS, Hopper JL, Harrap SB. Antihypertensive treatments obscure familial contributions to blood pressure variation. Hypertension. 2003;41(2):207–10. 53. Zou G. A modified poisson regression approach to prospective studies with
binary data. Am J Epidemiol. 2004;159(7):702–6.
54. Tuckel P, Milczarski W. Walk score(TM), perceived neighborhood Walkability, and walking in the US. Am J Health Behav. 2015;39(2):242–56.
55. Pitts SB, Carr LJ, Brinkley J, Byrd JL 3rd, Crawford T, Moore JB. Associations between neighborhood amenity density and health indicators among rural and urban youth. Am J Health Promot. 2013;28(1):e40–3.
56. Hirsch JA, Diez Roux AV, Moore KA, Evenson KR, Rodriguez DA. Change in walking and body mass index following residential relocation: the multi-ethnic study of atherosclerosis. Am J Public Health. 2014;104(3):e49–56.
57. Brown SC, Pantin H, Lombard J, Toro M, Huang S, Plater-Zyberk E, Perrino T, Perez-Gomez G, Barrera-Allen L, Szapocznik J. Walk score(R): associations with purposive walking in recent Cuban immigrants. Am J Prev Med. 2013; 45(2):202–6.
58. Duncan DT, Meline J, Kestens Y, Day K, Elbel B, Trasande L, Chaix B. Walk score, transportation mode choice, and walking among French adults: a GPS, accelerometer, and mobility survey study. Int J Environ Res Public Health. 2016;13:6.
59. James P, Hart JE, Arcaya MC, Feskanich D, Laden F, Subramanian SV. Neighborhood self-selection: the role of pre-move health factors on the built and socioeconomic environment. Int J Environ Res Public Health. 2015; 12(10):12489–504.
60. Basta LA, Richmond TS, Wiebe DJ. Neighborhoods, daily activities, and measuring health risks experienced in urban environments. Soc Sci Med. 2010;71(11):1943–50.
61. Chaix B, Kestens Y, Perchoux C, Karusisi N, Merlo J, Labadi K. An interactive mapping tool to assess individual mobility patterns in neighborhood studies. Am J Prev Med. 2012;43(4):440–50.
62. Duncan DT, Kapadia F, Halkitis PN. Examination of spatial polygamy among young gay, bisexual, and other men who have sex with men in new York City: the P18 cohort study. Int J Environ Res Public Health. 2014; 11(9):8962–83.
63. Matthews SA. Spatial Polygamy and the Heterogeneity of Place: Studying People and Place via Egocentric Methods. In: Communities, Neighborhoods, and Health. New York; Springer; 2011 p. 35–55.
64. Kwan M-P. The uncertain geographic context problem. Ann Assoc Am Geogr. 2012;102(5):958–68.
65. Kwan M-P. How GIS can help address the uncertain geographic context problem in social science research. Ann GIS. 2012;18(4):245–55.
66. Lewin A, Pannier B, Meline J, Karusisi N, Thomas F, Chaix B. Residential neighborhood, geographic work environment, and work economic sector: associations with body fat measured by bioelectrical impedance in the RECORD study. Ann Epidemiol. 2014;24(3):180–6.
67. Moore K, Diez Roux AV, Auchincloss A, Evenson KR, Kaufman J, Mujahid M, Williams K. Home and work neighbourhood environments in relation to body mass index: the multi-ethnic study of atherosclerosis (MESA). J Epidemiol Community Health. 2013;67(10):846–53.
• We accept pre-submission inquiries
• Our selector tool helps you to find the most relevant journal
• We provide round the clock customer support
• Convenient online submission
• Thorough peer review
• Inclusion in PubMed and all major indexing services
• Maximum visibility for your research Submit your manuscript at
www.biomedcentral.com/submit