HAL Id: tel-01155512
https://tel.archives-ouvertes.fr/tel-01155512
Submitted on 26 May 2015
HAL is a multi-disciplinary open access archive for the deposit and dissemination of sci-entific research documents, whether they are pub-lished or not. The documents may come from teaching and research institutions in France or abroad, or from public or private research centers.
L’archive ouverte pluridisciplinaire HAL, est destinée au dépôt et à la diffusion de documents scientifiques de niveau recherche, publiés ou non, émanant des établissements d’enseignement et de recherche français ou étrangers, des laboratoires publics ou privés.
Genetic and ecophysiological dissection of tolerance to
drought and heat stress in bread wheat : from
environmental characterization to QTL detection
Bruno Bouffier
To cite this version:
Bruno Bouffier. Genetic and ecophysiological dissection of tolerance to drought and heat stress in bread wheat : from environmental characterization to QTL detection. Agricultural sciences. Université Blaise Pascal - Clermont-Ferrand II, 2014. English. �NNT : 2014CLF22532�. �tel-01155512�
1 2532
E
COLE
D
OCTORALE
S
CIENCES DE LA
V
IE
,
S
ANTE
, A
GRONOMIE
, E
NVIRONNEMENT
N° ordre : 655
T h è s e :
Présentée à l’INRA de Crouel pour l'obtention du grade de
D O C T E U R D ' U N I V E R S I T E
(Spécialité : Physiologie et génétique moléculaires)
Soutenue le 16 Décembre 2014
Bruno BOUFFIER
Genetic and ecophysiological dissection of
tolerance to drought and heat stress in bread
wheat: from environmental characterization to
QTL detection
Dr CHARMET Gilles President
Dr TARDIEU François Rapporteur
Dr THIS Patrice Rapporteur
GOUACHE David Examinateur
Dr DERORY Jeremy Encadrant
Dr LE GOUIS Jacques Directeur de Thèse
Dr MURIGNEUX Alain Directeur de Thèse
Dr REYNOLDS Matthew P. Directeur de Thèse
Thèse préparée au sein des laboratoires:
Limagrain Europe, Native Trait, Genetic Resources and Pre-breeding Team, Chappes, France CIMMYT, Bread Wheat Physiology Group, El Batan, Texcoco, Mexico
UMR UBP/INRA Génétique, Diversité et Ecophysiologie des Céréales, Clermont-Ferrand, France Thèse CIFRE (2011/0550) cofinancée par Limagrain Europe, CIMMYT et ANRT.
UNIVERSITE BLAISE PASCAL
N° D.U.: 2532
UNIVERSITE D'AUVERGNE
3 2532
E
COLE
D
OCTORALE
S
CIENCES DE LA
V
IE
,
S
ANTE
, A
GRONOMIE
, E
NVIRONNEMENT
N° ordre : 655
T h è s e :
Présentée à l’INRA de Crouel pour l'obtention du grade de
D O C T E U R D ' U N I V E R S I T E
(Spécialité : Physiologie et génétique moléculaires)
Soutenue le 16 Décembre 2014
Bruno BOUFFIER
Dissection génétique et écophysiologique de la
tolerance au stress hydrique et thermique chez le
blé tendre: de la caractérisation
environnementale à la détection de QTL
Dr CHARMET Gilles President
Dr TARDIEU François Rapporteur
Dr THIS Patrice Rapporteur
GOUACHE David Examinateur
Dr DERORY Jeremy Encadrant
Dr LE GOUIS Jacques Directeur de Thèse
Dr MURIGNEUX Alain Directeur de Thèse
Dr REYNOLDS Matthew P. Directeur de Thèse
Thèse préparée au sein des laboratoires:
Limagrain Europe, Native Trait, Genetic Resources and Pre-breeding Team, Chappes, France CIMMYT, Bread Wheat Physiology Group, El Batan, Texcoco, Mexico
UMR UBP/INRA Génétique, Diversité et Ecophysiologie des Céréales, Clermont-Ferrand, France Thèse CIFRE (2011/0550) cofinancée par Limagrain Europe, CIMMYT et ANRT.
UNIVERSITE BLAISE PASCAL
N° D.U.: 2532
UNIVERSITE D'AUVERGNE
5
Acknowledgement
During my PhD, there were many people who helped me, gave me support, and made that this work became a reality. I would like to thank all of them and decided to address my thanks into the appropriate language for each of them.
Firstly, I wish to acknowledge all my supervisors. Alain and Matthew, thank you for organizing the PhD project and building the collaboration between your two laboratories where my thesis was done. Jacques, thank you very much for having accepted to be my supervisor. Alain, Matthew, and Jacques, thank you very much for having given me the opportunity to realize one of my professional objectives. I’ve really appreciated that you’ve made everything that was required to allow the thesis to be done in such good conditions. Thanks for having made me comfortable within each one of your laboratory, for always having had time to discuss, for having guide and encourage me along these years, for having given me the opportunity to share my work during international conferences, and for having given me the possibility to train myself during these years. A special thanks to Jeremy Derory, my “roommate” in the C175 office at Chappes. I would like to thank you very much for always having had time to discuss with me, answer my questions, and share your knowledge and experience with me. I strongly beneficiate from your experience at each step of my PhD, not only in Genetics, but also in Agronomy, data analysis, organization, etc. Your input strongly improved the quality of my work. Jeremy, Jacques, Alain, and Matthew, thank you for all the time you spent to correct and improve my scientific productions, but also, for having helped me to have hindsight in the data analysis with so many results.
I would like to thank the members of the jury, especially François Tardieu and Patrice This who accepted to review this manuscript.
Me gustaría dar las gracias a todo el personal del CIMMYT por su bienvenida, su ayuda, disponibilidad y consejos durante todas mis estancias en México.
En primer lugar, quiero dar las gracias a Rodrigo Rascón quien me dió la bienvenida en la estación del CENEB a Ciudad Obregón.
Me gustaría dirigir todos mis sinceros agradecimientos al grupo de fisiología de trigo, especialmente a los ingenieros y el personal técnico (Araceli, Eugenio, Syhara,
6 Mayra, Pimi, Nayeli, Abisai, Edgar, Chema, Jazmin, Israel, Arturo, Raymundo, Jessy, Vania, Manuel, Gilberto, Gera, Martha, Joaquín, Román, Don Bicho, etc.) y también a todos los estudiantes de doctorado y los post-docs (Julián, Mariano, Gemma, Alistair, Maria, Perla, Arnauld, Carolina, Eliseo, Francisco, Suzuky, Alejandro, Oscar, Máximo, Sean, Ruth, etc.). Me ha encantado pasar cada ciclo con ustedes y ser parte de su equipo. Fué un placer trabajar con personas tan capacitadas y calificadas, pero sobre todo con gente a quien le gusta tanto enriquecerse de conocimientos.
Sería injusto que mis agradecimientos conciernan solamente al trabajo. Plebes, muchas gracias por todas nuestras salidas, de las famosas carne-asadas de Julián y Mariano, las fiestas de Maria y Gemma, las noches de pizza y sushi… ¡qué rico!, todas las noches de puras risas con el Take, el JP y mi Syhara; también a Malena y su familia a quienes agradezco por recibirme en su casa.
L’administratif a occupé une part non-négligeable de ma thèse, surtout avec mes voyages transcontinentaux. Je voudrais donc pour cela adresser mes sincères remerciements à Sylvie Guillaume du côté Limagrain Europe pour sa disponibilité et son aide avec tous mes petits tracas administratifs, mais aussi pour nos fous rires dans le bureau avec Jeremy.
Del lado del CIMMYT, agradezco muchísimo a Norma Hernández y Eloisa Carillo por toda la ayuda y por haber hecho que todo fuera siempre muy sencillo con las visas y los viajes. Fué un grato placer conocerlas.
Une thèse c’est avant tout savoir ce que les autres ont déjà fait et publié dans la littérature. Christine, Pierre, qu’est-ce que j’ai pu vous embêter avec toutes mes demandes d’article... mais vous avez toujours réussi à me dégoter rapidement ce que je recherchais. Je tiens à vous remercier pour votre gentillesse et votre disponibilité à chacune de nos rencontres. Nos échanges ont toujours été un véritable bonheur pour moi.
Aurélien, Aurélien, Aurélien…, s’il y en a un que j’ai pu « e…… », je crois que c’est bien toi. Tu as toujours été disponible pour m’aider et m’expliquer ces petits concepts statistiques sur lesquels je butais mais aussi pour identifier du premier coup d’œil dans mon code la petite erreur qui m’ennuyait. J’aime à croire que tu as également de ton côté pu apprécier et profiter du travail et des réflexions que nous avons menés et
7 solutionnés ensemble. Ce fut toujours très stimulant d’être en contact avec quelqu’un d’aussi talentueux que toi en statistique et codage.
Je tiens également à remercier Zivan Karaman, Chloé Boyard, Stéphanie Chauvet et Sébastien Ducrocq pour nos discussions statisticiennes autour de mes données et de mes expériences
Mes plus sincères remerciements s’adressent également aux autres membres de l’équipe Native Trait de Limagrain Europe de Chappes, Morgan Renault, Philippe Dufour, Fabienne Henriot, et Manuel Personne. J’ai toujours pris beaucoup de plaisir dans nos discussions scientifiques ou non, lesquelles furent toujours fructueuses et passionnantes. Ce fut très enrichissant pour moi de travailler au côté de personnes aussi compétentes et passionnantes que vous. J’espère de mon côté avoir également pu au travers de mes travaux vous apporter quelques éléments de réponses dans l’approche de l’étude des stress abiotiques.
I would like to thank Suzanne Dreisigacker from the CIMMYT genotyping laboratory, and also Jean-Pierre Martinant, Sébastien Specel, Valérie Gauthier, and Jordi Comadran from the Limagrain Europe Genotyping Laboratory for their great work concerning the genotyping of my three populations, the construction of the genetic maps, their advices in QTL detection with GenStat, but also the time spent for my numerous questions. I have been so blessed to work with so skilled people.
Merci au gens du couloir du Bâtiment 1 de la Garenne, Benoit, Luc, Samantha, Delphine, Perrine, Noémie, Romain, Anne-Marie, Elena, et Eliette, pour vos encouragements, et m’avoir soutenu tout au long de cette aventure.
Je tiens également à remercier Pierre Dubreuil de Biogemma que j’ai eu la chance de côtoyer et qui a toujours accepté de partager ses incroyables connaissances sur les modèles mixtes et l’interaction génotype x environnement avec moi. J’ai toujours beaucoup apprécié nos échanges scientifiques, ce fut toujours un régal !
Merci également à Bruno Poupard, François Torney, et Fabien Lecouviour de Limagrain Europe pour leurs conseils et l’ouverture à d’autres sujets plus éloignés du mien.
8 Je tiens enfin à remercier infiniment toute ma famille, en particulier Syhara, mes parents, mes frères et sœur, papi, mais aussi Ouragan, Chifouille et Dingo. Je n’ai jamais vraiment eu l’occasion de vous remercier durant toutes ces années d’avoir toujours cru en moi, d’avoir toujours été à mes côtés, d’avoir absolument tout fait pour que se concrétisent toutes mes études, mais également pour votre soutien indéfectible et vos continuels encouragements...et Dieu sait que parfois je ne le méritai pas.
Finalmente, pero ciertamente lo más importante, a mi prometida Syhara, quien siempre me ha sostenido y alentado durante todo mi doctorado. Syhara mi amor, te agradezco infinitamente por siempre estar a mi lado y también por haber creído en mí aun cuando yo dudaba. Lamento haberme ausentado por tanto tiempo pero te aseguro, mi amor, que jamás me alejare de ti, que siempre estaré a tu lado y que siempre podrás contar conmigo. Te amo mi hermosita, por siempre.
9
Abstract
B. Bouffier (2014) - Genetic and ecophysiological dissection of tolerance to drought and heat stress in bread wheat: from environmental characterization to QTL detection
A stagnation of wheat yield was reported in France and other countries worldwide since the 1990’s, which incriminated mainly drought and heat stress. Improving the European wheat tolerance to them is of first importance. This study aimed to investigate the genetic determinism of the tolerance to such stresses. Three CIMMYT bread wheat populations combining complementary heat and drought adaptive habits were grown in Northern Mexico under irrigated, drought and heat-irrigated treatments from 2011 to 2013. The trial network comprised 15 trials and both physiological and agronomic traits were scored.
First, an environmental characterization methodology was developed and resulted in the identification of six main environmental scenarios in the network. A representative environmental covariate was extracted from each of them. Then, a factorial regression model leaded to the dissection of the genotype-by-environment interaction and highlighted differential stress sensitivity of the germplasm. Finally, a multi-environmental QTL detection resulted in the discovery of genomic regions involved in the control of both physiological and agronomic traits and the study of their sensitivity to the environment.
From the environmental characterization to the QTL detection, this study resulted in the development of a tool for breeders which may enable the evaluation of the potential of any genotypes in front of a range of environment, but also the identification of genomic regions involved in the control of the tolerance to drought and heat stress in bread wheat. This may help in improving the tolerance of the European bread wheat germplasm to drought and heat stress.
10
Résumé
B. Bouffier (2014) – Dissection génétique et écophysiologique de la tolérance au stress hydrique et thermique chez le blé tender: de la caractérisation de l’environnement à la detection de QTL
L’étude des rendements en blé a mis en évidence une stagnation apparue dans les années 1990, notamment en France, et principalement lié aux stress hydrique et thermique. Dans ce contexte, améliorer la tolérance du blé européen à ces stress est de première importance. Cette étude avait pour but d’étudier le déterminisme génétique de la tolérance à ces stress chez le blé. Pour ce faire, trois populations de blé tendre du CIMMYT combinant des caractères d’adaptation à ces stresse ont été cultivées en conditions irriguée, sèche et stress thermique irriguée plusieurs années. Des caractères physiologiques et agronomiques ont été mesurés sur un réseau de 15 essais.
Une méthodologie de caractérisation environnementale a été développée et a permis l’identification de six scenarii de stress au sein du réseau. Une covariable environnementale représentative de chacun a été extraite. L’utilisation des modèles de régression factorielles a permis la décomposition de l’interaction génotype x environnement ainsi que la mise en évidence d’une sensibilité différentielle au stress dans le germplasm. Une recherche de QTL multi-environnementale a conduit à la détection de régions génomiques contrôlant les caractères physiologiques et agronomiques ainsi que leurs interactions avec l’environnement.
De la caractérisation environnementale à la détection de QTL, cette étude a abouti au développement d’un outil pour les sélectionneurs permettant l’évaluation du potentiel des génotypes face à une gamme d’environnement, mais aussi à l’identification de régions génomiques impliquées dans le contrôle de la tolérance aux stress hydrique et thermique chez le blé tendre. Ceci pourrait améliorer la tolérance à ces stress au sein du germplasm européen.
11
Key-words
Drought; Heat stress; Abiotic stress; Wheat; Stress tolerance; Agronomic traits; Physiological traits; Environmental characterization; Environmental covariates; Factorial regression; Genotype-by-environment interaction; Quantitative trait loci; Quantitative trait loci-by-environment interaction.
12
Mots-Clés
Sécheresse; Stress thermique; Stress abiotique; Blé ; Tolerance au stress; Caractères agronomiques; Caractères physiologiques; Caractérization environnementale; Covariables environnementales; Régression factorielle; Interaction génotype-environnement; Locus de caractère quantitatif (QTL); Interaction QTL-environnement.
13
Summary
General introduction ... 19
CHAPTER I: Literature review ... 25
I. Bread wheat features ... 27
a. Economic importance ... 27
b. Nutritional importance and industrial uses ... 29
c. Origin, domestication and geographical distribution of wheat ... 30
d. Wheat genetic resources ... 32
e. Wheat developmental stages and yield achievement ... 34
i. Aerial development and yield achievement ... 34
ii. Roots establishment and growth in cereals ... 38
f. Grain yield progress from the XVIIIe to the 1990’s ... 38
II. From the concept of stress to the characterization of the environment ... 41
a. Definition and description of water deficit and high temperature stresses ... 42
b. Distribution of water deficit and heat stresses worldwide on wheat cultivated areas ... 43
c. Water movements from the soil to the atmosphere through the plant ... 45
i. Theory and concepts of water potential (Taiz and Zeiger, 2010b) ... 45
ii. Water in the soil ... 46
iii. The gradient of water potential drives the water through the soil-plant-atmosphere continuum ... 47
d. Characterization of the environment ... 49
i. An agronomic diagnostic using probe genotypes ... 50
ii. Characterizing the water deficit along the crop cycle ... 50
III. Impact of drought and heat stress on wheat ... 52
a. Differential sensitivity to drought and heat stress along the crop cycle ... 53
b. Grain yield achievement ... 54
c. Physiological effects of drought and heat stress on plant development and growth 55 i. Aerial development and growth ... 55
ii. Impact on the rooting system ... 57
iii. Drought and heat stress impact the photosynthesis process ... 58
IV. Adaptive responses of cereals to water deficit and heat stresses ... 61
a. Concepts of tolerance and resistance to drought and heat stress ... 61
b. Conceptual models for traits associated with adaptation to drought and heat stress prone environments ... 63
c. Traits to improve tolerance to drought and heat stress ... 64
i. Water uptake, WU ... 65
ii. Water and radiation use efficiency, WUE/RUE ... 66
iii. Harvest index, HI ... 69
d. Bread wheat breeding: improvement of tolerance to drought and heat stress ... 70
V. Highlighting and assessing the huge available natural genetic diversity of bread wheat for drought and heat stress tolerance ... 71
a. Genetic variability for yield driving traits under drought and heat stress conditions ... 71
14 c. Study of the GEI, or how better benefit can be taken from the understanding of
how the genetic variability interacts with the environment ... 74
i. Importance of the GEI ... 74
ii. Presentation of the GEI ... 75
iii. Analytical tools to study the GEI ... 76
VI. Assessing the genetic determinism of tolerance to drought and heat stress ... 81
a. From genetic and physical maps to whole wheat genome sequencing ... 81
b. Quantitative trait loci analyses ... 86
c. Impact of the segregation distortion on QTL analysis ... 86
d. QEI: dissection of the genetic component of the GEI ... 87
e. Synthesis of the previously reported QTL for traits associated with drought and heat stress tolerance in wheat ... 88
CHAPTER II: Objectives and strategy developed during the thesis ... 99
I. Frame and objective of the thesis ... 101
II. Research questions and strategy developed ... 102
III. Plant material and experimental design of the study ... 103
a. The plant material ... 103
b. Experimental trial network design ... 104
CHAPTER III: E, environmental characterization of the trial network ... 107
CHAPTER IV: GEI, study of the genotype-by-environment interaction ... 143
CHAPTER V: G, study of the genetic component ... 191
CHAPTER VI: General discussion and conclusion ... 253
I. General conclusions ... 255
a. Importance of the environmental characterization in MET network ... 255
b. Importance of the physiological phenotyping approach in the understanding of the drought and heat stress tolerance in wheat ... 256
c. Dissection of the genotype-by-environment interaction using environmental covariates revealed the stress sensitivity of the germplasm ... 257
d. Genetic dissection of the traits involved in the control of drought and heat stress tolerance in wheat can lead to a wider use of the QTL-by-environment interaction 258 II. General discussion ... 259
a. Need for standard protocols ... 259
b. New phenotyping methods ... 261
c. Interest of the genetic material studied ... 263
d. Relevant genomic regions directly usable in breeding ... 264
III. Perspectives ... 266
a. A new experimental design to tackle the long term objective of the thesis ... 267
b. Use of the environmental characterization methodology developed to characterize the bread wheat trial network ... 269
c. Winter x spring wheat crosses ... 271
d. To go further on genetics ... 272
References ... 275
15
List of figures
General introduction
Figure Int-I-1: Annual evolution of bread wheat yield in France since the 1950’s to the time of the study (Source: Brisson et al., 2010) ...22 Figure Int-I-2: Simulated change in water-limited wheat production for 2030 compared with 2000 with the model A1B for two meteorological scenarios of CO2 emission: (i) low-emission scenario, i.e., cold climate change projection (ECHAM5) (left) and (ii) high-emission scenario, i.e., a warm climate change projection (HADCM3) (right). Simulation performed on a 25x25 km grid (assuming current area of wheat cropping) (Source: European Environment Agency, 2012) ...23
CHAPTER I: Literature review
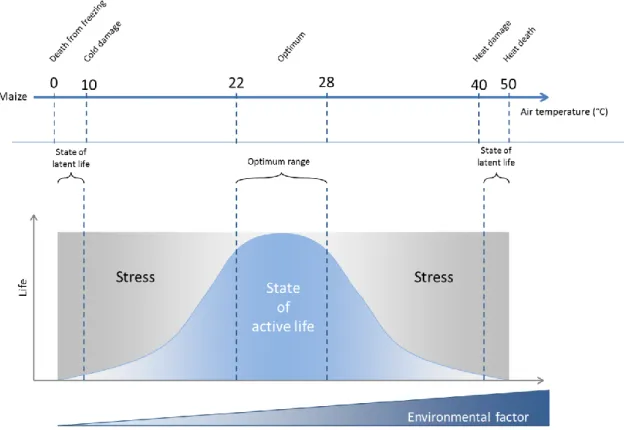
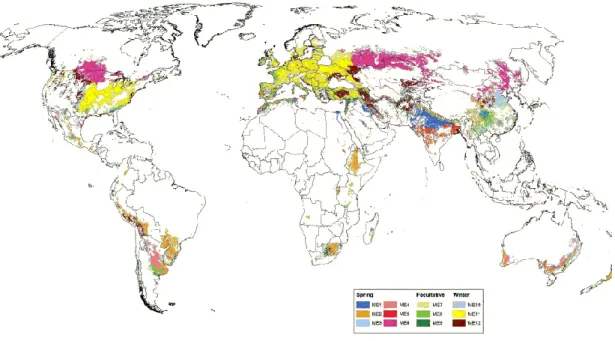
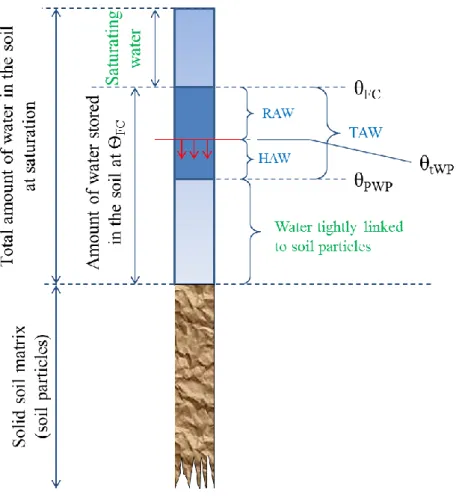
Figure I-1:Country map of bread wheat cultivation in 2012, in millions tons (based on FAO (2014a)) ...27 Figure I-2: Map of (a) the six biggest wheat harvested acreage countries (cold colours) and (b) the six highest wheat yield countries (hot colours), worldwide in 2012 (based on FAO (2014a)) ...28 Figure I-3: The evolutionary and genome relationships between cultivated bread and durum wheats and related wild diploid grasses, showing examples of spikes and grains (Source: Shewry, 2009) ...31 Figure I-4 : Worldwide spread of Wheat from the expected origin of the species (red area) according to Bonjean and Angus (2001). BC: Before Christ; AC: After Christ ...32 Figure I-5 : Organization of the hexaploid genome of bread wheat (Triticum aestivum L.) into three different genomes (A, B, and D) and seven homoeologous groups (Adapted from Laperche, 2005). ...33 Figure I-6: Wheat, Triticum aestivum L., anatomy adapted from an image processed by Thomas Schoepke (www.plant-pictures.de) ...35 Figure I-7:Schematic diagram of wheat growth and development adapted from lafer and awson 199 awson and me ac herson 000 and lafer 01 , showing the main developmental stages of wheat growth their corres ondences within the Zadoks’ scale (Zadoks et al., 1974; Tottman, 1987) and the timing of initiation of crop yield components. Periods of initiation of growth (or death) of specific organs and those of when different components of grain yield are produced are represented in bottom boxes. ...37 Figure II-1 : Life processes of maize (Zea mays L.) described as a function of an abiotic environmental factor (ex.: air temperature). Adapted from Schulze (2005) ...42 Figure II-2 : Distribution of the twelve wheat growing mega-environments identified by the CIMMYT (Source: Braun and Payne, 2012) ...45 Figure II-3 : Diagram of the different water compartments in a soil in terms of availability for plant. RAW: Readily available water; HAW: Hardly available water; TAW: Total available water; ѲFC: Field ca acity; ѲPWP: Permanent wilting oint; ѲtWP: temporary wilting point. In green are displayed water compartments unavailable for plants ...47 Figure II-4: Idealized water potential gradients through the soil plant water atmosphere continuum (SPAC). Curves 1 and 2 represent plant water removal from relatively wet soil at low and high transpiration rates, respectively; curves 3 and 4 represent plant water removal at low and high transpiration rates, respectively, after soil water potential has been reduced to -0.6 MPa (Source: Hillel, 1980). ...48 Figure II-5: Water moves from the soils to the roots (on the right), showing the three pathways (symplast, transmembrane and apoplast) for water uptake by the root, and water and gazes exchanges from the leaf to the atmosphere (on the left) (Adapted from Taiz and Zeiger, 2010c) ...49 Figure II-6: Diagram representing the three equation steps structuring the whole process to characterize the water stress status of the plant. Reference (ET0), crop evapotranspiration under standard (ETc) and non-standard conditions (ETc adj). kc corresponds to the crop coefficient; ks correspond to the drought stress coefficient (Source: Allen et al., 1998b) ...52 Figure III-1 : Evolution of the average temperature (red) and the precipitations at Ciudad Obregon, Sonora, Mexico, during the year (top part) and the estimated evolution of the soil water availability in
16
that location under rainfed conditions. Are indicated the period of winter sowing trials (irrigated and drought conditions) and spring sowing trials (heat-irrigated conditions) ...53 Figure III-2: Diagram of the photosynthesis process of C3 plants (Adapted from Freeman (2005) and http://www.citruscollege.edu/lc/archive/biology/Pages/Chapter06-Rabitoy.aspx); ATP: Adenosine Tri-Phosphate; ADP: Adenosine Di-Tri-Phosphate; P: Tri-Phosphate; NADP+/NADPH: Nicotinamide Adenine Dinucleotide Phosphate; G3P: Phosphoglyceraldehyde; H+: proton ...60 Figure IV-1: Plant responses to environmental stress in correspondence with stress and plant characteristics (Adapted from Gaspar et al., 2002); The neoplastic progression refers to the development of tumors ...62 Figure IV-2: Conceptual models representing: (A) traits associated with adaptation to drought-prone environments. They are gathered according to the main grain yield determinants under drought (yield = water uptake [WU] × water use efficiency [WUE] × harvest index [HI] according to Passioura (1977)), (B) traits associated with adaptation to water deficit stressed and/or high temperature with irrigation environments (adaption from Reynolds and Trethowan (2007)). These traits are grouped by main grain yield determinants under non-drought prone environment (yield = light interception [LI] × radiation use efficiency [RUE] × harvest index [HI]) (Source: Reynolds et al., 2007b) ...64 Figure IV-3: Percentage of new advanced lines deriving from both conventional and physiological trait based CIMMYT breeding per yield categories expressed in percent of the drought adapted check varieties used between 2006 and 2008. CIMMYT (Source: Reynolds et al., 2009) ...71 Figure V-1: Descriptive diagrams of the different cases of genotype-by-environment interaction between two genotypes (A and B) in terms of mean performance across environments (Env 1 and Env 2); (a) additive model, (b) divergence, (c) convergence, and (d) cross-over interaction (Adapted from Malosetti et al., 2013) ...76
CHAPTER II: Objectives and strategy developed during the thesis
Figure III-1 : Pedigree of each one of the bread wheat recombinant inbred lines populations worked during the PhD. PW: Pastor//hxl7573/2*Bagula/3/Weebill1; SW: Sokoll/Weebill1; VP: Vorobey//Parus/Pastor. In red are indicated common ancestors between populations leading to connected population system. ...104 Figure III-2: Table representing the trial network tested during the study in terms of population sowed (PW: Pastor//hxl7573/2*Bagula/3/Weebill1; SW: Sokoll/Weebill1; VP: Vorobey//Parus/Pastor) under three different treatments (IR: winter sowing irrigated; DR: winter sowing drought; HI: spring sowing heat irrigated) ...104
CHAPTER VI: General discussion and conclusion
Figure II-1: Dynamic curves of NDVI performed on the PASTOR//HXL7573/2*BAGULA/3/WEEBILL1 population in 2012, in irrigated, drought, and heat-irrigated treatments. The x-axis is the thermal time of each NDVI scoring date while the y-axis represents the NDVI values (no unit). Within each plot, each color line corresponds to the evolution of the NDVI for a given genotype. Red arrows indicate the anthesis range within each treatment. ...260 Figure II-2: Evolution of a canopy temperature series within a trial during grain filling in Pastor//hxl7573/2*Bagula/3/Weebill1 under heat stress condition in 2011 at Ciudad Obregon, Sonora, Mexico. The red line represents the linear regression line. The blue line represents a local fitting curve. The x-axis represents the number of the plot and in the y-axis, the value of canopy temperature. Number in blue represents outliers that were removed. ...262 Figure III-1: Description of a typical plot in the trial network and its use during the crop cycle ...269
17
List of tables
CHAPTER I: Literature review
Table VI-1 Synthesis of the main wheat physical and genetic map studies displaying the species involved, the date of release, the type of map, authors of the study, the cross, the structure of the mapping population, the number and type of markers used, the chromosome mapped and the size in centiMorgan (cM) when available in total and for each one of the genome A, B, and D. p+ Physical map; G=Genetic map ...84 Table VI-2: Table summarizing the studies reported for the synthesis of QTL found for many traits under irrigated, drought, and heat conditions. Here is represented, the number of the species studied, the cross involve, the genetic structure of the material studied, and the reference of the studied ...89 Table VI-3 : Table summarizing QTL found in the literature in wheat under different environmental conditions encompassing irrigated, drought and heat conditions. References refers to Table VII-2 ...90
CHAPTER VI: General discussion and conclusion
Table II-1: Genomic regions potentially interesting to increase the senescence rate ...266
18
List of formulas
CHAPTER I: Literature review
Equation II-1 : Equation of the leaf elongation rate in corn as a function of the temperature, the inherent elongation rate (a), the sensitivity to the evaporative demand (b), and the sensitivity to the soil water deficit (c) (Source: Salah and Tardieu (1997), Reymond et al. (2003), and Tardieu et al. (2008)) ...43 Equation II- : Water otential formula Ѱw) decomposition into osmotic potential Ѱs), pressure potential Ѱp and gravity otential Ѱg) (Source: Taiz and Zeiger, 2010b) ...46 Equation IV-1: Dissection of the cereals grain yield under drought-prone environments as proposed by Passioura (1977) ...63 Equation IV-2: Dissection of the cereals grain yield under heat stress conditions proposed by Passioura (1977) ...63
19
21 The birth of the Agriculture in the Fertile Crescent around 10,000 years ago was concomitant with the agricultural birth of the hexaploid wheat. Several centuries after the wheat domestication, rice (Oriza sativa L.) and corn (Zea mays L.) were domesticated in south-east Asia and in Central America, respectively. Because grains of these three species are used as food both for humans and domestic animals, they are called cereals1 (Bonjean and Picard, 1990). Cereals share diverse features continuously improved by humankind (1) grain starch and proteins content which make cereals suitable for basal ration of human diet, (2) ease of harvesting and conservation and (3) suitability for transportation (Bonjean and Picard, 1990).
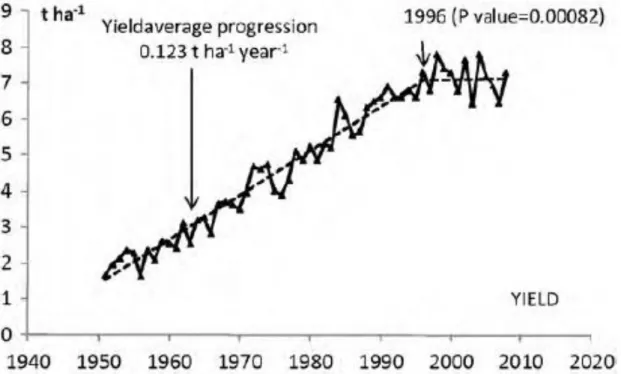
From the birth and the beginning of selection of hexaploid wheat by the first men to the XVIIIe, wheat-related species were spread worldwide leading to their diversification and resulting in the constitution of many locally adapted groups of genotypes: the landraces. Indeed, a plant has to adapt (germinates, grows, reproduces and matures) to its environment as fundamentally immobile. Until the XVIIIe, landraces were the only form of cultivated wheat, corn, and rice. During the XVIIIe century, plant breeding started with the first phenotypical selection of varieties. Through decades of breeding efforts, wheat yield have tremendously increased in many countries worldwide, and especially in France. Calderini and Slafer (1998) reported a constant growth trend due to the progress of both genetics and agronomical practices. In France, from the 1950’s to 1996, an increase of wheat yield of 0.12 t ha−1 year−1 was reported (Brisson et al., 2010).
However, over the last 25 years, several studies have reported a stagnation in grain yield of several crops such as wheat (Brisson et al., 2010) and rice (Ladha et al., 2003) in many countries in Europe, like in France, but also worldwide, in Mexico, China, and India. In France, the inflexion of bread wheat yield continuous increase occurred around 1996 (Figure Int-1) (Brisson et al., 2010). Brisson et al. (2010) explored different putative causes for this yield plateau, such as genetics, agronomy (nitrogen fertilization, disease protection, effect of the preceding crop, soil organic matter) and climate. They concluded (i) that there was a constant genetic gain even during the last 20 years, which ranged between 0.10 and 0.12 t ha-1 year-1 and (ii) that drought during stem elongation and heat stress during grain filling were responsible for
22 most of the stagnation of wheat yield observed in France. For France (4th wheat world producer), but also, China (1st) and India (2nd), such stagnation is very worrying, particularly in the context of increasing human population and increasing worldwide food demand.
Figure Int-I-1: Annual evolution of bread wheat yield in France since the 1950’s to the time of the study (Source: Brisson et al., 2010)
CO2 and other gazes emission released by human activity were reported as the
direct cause of the current global warming which leads to such drier conditions for farming (IPCC, 2007, 2014; Smith and De Smet, 2012). The IPCC (2007, 2014) expected an increase in frequency and intensity of drought and heat stress around the world. The recent simulation works of Dai (2012) strongly supported such an assumption by concluding to a severe drought widespread in the incoming decades in several countries worldwide, as resulting from either an increased evaporation, or a decrease of the or rain fall.
Worldwide, water deficit and high temperature stress are referred as ones of the most common abiotic stresses occurring in crop production nowadays. In 2012, the European Environment Agency (EEA) reported simulation works on the impact of water limitation in Europe on wheat production by 2030 (Figure Int-2). Whatever the climate change scenario tested, the coolest (ECHAM5) or the warmest (HadCM3), most of the European bread wheat production area might be strongly impacted leading to a decrease of the production.
23 Figure Int-I-2: Simulated change in water-limited wheat production for 2030 compared with 2000 with the model A1B for two meteorological scenarios of CO2 emission: (i) low-emission scenario, i.e., cold climate change projection (ECHAM5) (left) and (ii) high-emission scenario, i.e., a warm climate change projection (HADCM3) (right). Simulation performed on a 25x25 km grid (assuming current area of wheat cropping) (Source: European Environment Agency, 2012)
Although no model is perfect in terms of predictions, even if climate predictions are only the results of simulation and are subjected to a large uncertainty, they can be useful in giving a glimpse on what the weather may look like in the incoming decades. Such information is highly valuable for a plant breeder as it is of great help to design the varietal ideotype for the future decades.
In such a drying context, the big challenge of the whole European wheat breeding community is the improvement of the tolerance to both drought and heat stress. Limagrain Europe, the fourth worldwide seed company and the current leader of the European seed wheat market, has to tackle this challenge. However, the study of drought in open field in Europe is difficult and uncertain due to the high inter-annual climate variations. The International Maize and Wheat Improvement Center, better known by its Spanish acronym, CIMMYT, already studies the impact of these stresses on wheat and breed for increased tolerant genotypes since several decades at its experimental station based at Ciudad Obregon, in the northwestern Mexican Sonora desert (CENEB). In such a place, inter-annual variations are reduced, enabling the experimentation of targeted stresses in good conditions every year. Over there, the CIMMYT beneficiates from well-established facilities, well-trained people, and adapted germplasm. The bread wheat physiology group led by Matthew Reynolds, is in charge
24 of CIMMYT research on wheat physiology under abiotic stress conditions. The objective is to identify and dissect mechanisms involved in tolerance, but also, to look for native novel drought and heat stress tolerance sources to improve worldwide-spread wheat varieties. Collaboration had therefore been established between the CIMMYT and Limagrain Europe.
Several ways exist to improve the tolerance of European wheat to drought and heat stress. The CIMMYT and Limagrain Europe agreed on a collaborative project, which was my Phd research, on the dissection of the genetic determinism of drought and heat stress tolerance using populations of crosses whose parents were chosen to combine complementary and relevant traits to tolerate such stresses. The uncertainty of drought and heat stress in open-field experiments in Europe, combined with the experience of the CIMMYT facilities, made the Sonora platform the most relevant choice as a first step towards the improvement of European bread wheat through possible CIMMYT germplasm introgression.
The present study has been put in place to meet this objective by studying of the genetic determinism of the tolerance to drought and heat stress in various bread wheat genetic backgrounds. Firstly, a review of the literature is presented in the first chapter. Secondly, the research questions and the strategy are defined. Then, the results of the study are presented as scientific articles, either accepted or submitted or other that will be submitted in the near future. These articles deal with the characterization of the environment, the quantification of the genotype-by-environment interaction, and finally, the dissection of the genetic determinism through the identification of QTL for drought and heat stress tolerance and QTL-by-environment interaction. The manuscript ends with a general discussion and a general conclusion.
25
27
I.
Bread wheat features
Wheat is a vascular (Tracheobionta), flowering (Magnoliophyta), and monocotyledon (Liliopsida) plants (Plantae) related to the grass family (Poaceae). The precise classification of wheat is not such an easy task. There are many taxonomic classifications which diverge on some controversial points such as the genus classification; considering one unique Triticum genus, or two different genera: Triticum and Aegilops (National Germplasm Resources Laboratory, Beltsville, Maryland, 2004).
Conventionally, a species is defined as a set of inter-fertile organisms, i.e., able to cross and give fertile progeny. However a set of individuals displaying various degrees of interbreeding is referred as a ‘complex of species’. Wheat is a vernacular name associated with different species within the Triticum genus (Auriau et al., 1992). They form a complex of annual herbaceous species. Triticum aestivum (L.) Thell., the bread wheat, represents 95% of all wheat species cultivated worldwide (Shewry, 2009).
a. Economic importance
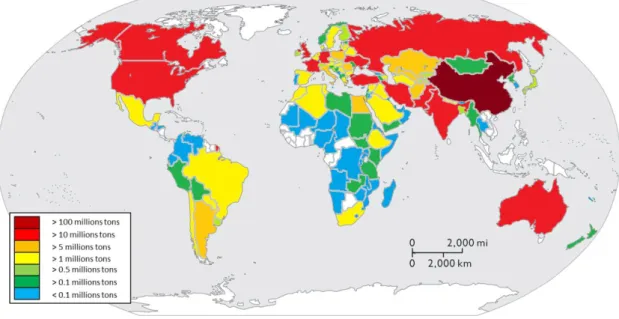
Bread wheat is cultivated from Scandinavia (67°N) to Argentina (45°S), Chile and New-Zealand (Trethowan et al., 2005). In 2012, it was grown in at least 124 different countries, on the five continents. In 2012, 57 % of the 671 million tons of the world wheat production was achieved by only six countries among which, by order, (1) China (18.0 %), (2) India (14.1 %), (3) United States of America (9.2 %), (4) France (6.0 %), (5) Russia (5.6 %) and (6) Australia (4.0 %) (Figure I-1).
28 Five of the biggest bread wheat producers reached such production thanks to their high wheat acreage. Indeed, with Kazakhstan, these five countries represented more than 56 % of the 215 million hectares of wheat grown worldwide, with by order, (1) India (13.9 %), (2) China (11.2 %), (3) Russia (9.9 %), United States of America (9.2 %), (5) Australia (6.5 %) and (6) Kazakhstan (5.8 %) (Figure I-2).
In 2012, bread wheat yield ranged from 0.3 t ha-1 in Venezuela to 8.9 t ha-1 in New-Zealand. France reached 7.6 t ha-1. Indeed, it belongs to the list of the top six highest wheat productive countries. These countries displayed at least twice more than the 3.1 t ha-1 average wheat yield. It was leaded by (1) New Zealand (8.9 t ha-1) followed by (2) Netherlands (8.6 t ha-1), (3) Belgium (8.5 t ha-1), (4) France (7.6 t ha-1), (5) Denmark (7.4 t ha-1) and (6) Germany (7.3 t ha-1). In 2012, UK reached 6.7 t ha-1 and was at the 11 position on the list of the biggest world wheat yield (FAO, 2014a).
Figure I-2: Map of (a) the six biggest wheat harvested acreage countries (cold colours) and (b) the six highest wheat yield countries (hot colours), worldwide in 2012 (based on FAO (2014a))
For the trade season 2012/2013, the world wheat disponibilities (WWD) represented 841 million tons (world wheat 2012 productions + stock from the 2011/2012 season). The trade concerned 16.7 % of WWD (140.9 million tons). Stocks represented 18.7 % of WWD (187 million tons). The three biggest wheat exporters were (1) the United Stated of America, (2) France and (3) Australia (FAO, 2014b). In 2012,
29 the value of the total world production was estimated to 79 billion $US, with a price per ton around 118 $US (FAO, 2014a). The world wheat price has become particularly volatile since the beginning of 21st century. Price volatility is intrinsic to agricultural markets coming from agriculture specificity (seasonality, climate influence, etc.). Such volatility has strongly increased with the financialisation of the agricultural sector which strongly accelerated since the beginning of the 1990’s.
b. Nutritional importance and industrial uses
Wheat, corn (Zea mays L.) and rice (Oriza sativa L.) are the three main staple foods worldwide. Altogether, 44 % of calories and 37 % of proteins are covered by these three crops. Alone, wheat provides more calories and proteins for humans than any other single food crop in the world. Indeed, wheat represented 19 % of calories and 20 % of proteins of the human diet (Braun et al., 2010; Braun and Payne, 2012).
Bread wheat has multiple end-uses. The industrial sector is structured into five main trades: (1) flour, (2) starch, (3) ethanol, (4) animal feed, and (5) seed trades. These trades regroup diverse activities such as industrial and artisanal bread making, biscuit and cake making, extraction of starch and gluten2, biofuel production, etc. The development and diversification of bread wheat processes need to look for constant and specific bread wheat qualities.
French bread wheat is still mainly used for bread making on the national or international markets. Due to the main target of the French bread wheat production, wheat varieties are classified depending on their behavior in bread making. Many countries have their own bread wheat quality scale such in the United Kingdom, the United States of America, Mexico, etc. In France, a distinction must be done between the classification of wheat varieties quality on the official registration list (potential of the registered varieties) and the classification of wheat quality at harvest. In the former classification, four main classes are distinguished: BAF (“blé améliorant ou de force”, cover wheat or strength wheat), BPS (“blé panifiable supérieur”, superior bread making wheat), BP (“Blé panifiable”,standard bread making wheat), and BAU (“blé pour autres usages”, wheat for other uses). In 2013, 69 % of the French wheat acreage was sowed with BPS and BAF, 23 % with BP, and 9 % with BAU (FranceAgriMer, 2013). In the
2
Gluten is the main bread wheat grain protein. It is responsible of the bread making feature of bread wheat flour.
30 latter classification, i.e., at harvest, four main classes exist (E, 1, 2, and 3, by decreasing quality order), mainly based on the protein content and the bread making strength. In 2014, 2% of the French production belonged to class E, 20 % to class 1, 33 % to class 2, and 45 % to class 3 (FranceAgriMer et al., 2014).
Bread wheat is one of the most important agricultural resources for economy and human diet worldwide. Our interest is focused on wheat grown under drought and high temperature stress conditions. Therefore, the origin and the developmental process of wheat are essential regarding our work. The deciphering of tolerance to drought and heat stress requires the perfect understanding of the plant behavior under stressful conditions.
c. Origin, domestication and geographical distribution of wheat
Polyploidization has played a major role in the evolution within the grass family,
Poaceae (Salse et al., 2008), and was one of the key of the success of the wheat
evolution (Dubcovsky and Dvorak, 2007). Wheat evolution faced two independent events of allopolyploidization. First, between 300,000 to 500,000 years before present, in the Fertile Crescent area, wild diploid wheat (Triticum urartu, 2n=2x=14, genome AA) hybridized with the BB genome ancestor, nowadays disappeared. Its closest relative species is a goat grass (Aegilops speltoides, 2n=2x=14, genome SS). They produced the wild emmer (Triticum dicoccoides, 2n=4x=28, genome AABB) (Dvorak and Akhunov, 2005). About 10,000 years ago, the wild emmer was cultivated by the hunter-gatherers. Gradually, a cultivated emmer was selected subconsciously (Triticum
turgidum, 2n=4x=28, genome AABB), the durum wheat. Secondly, about 9,000 years
ago, a spontaneous hybridization occurred with another grass (Triticum tauschii, 2n=2x=14, genome DD) and leaded to the production of the hexaploid wheats such as bread wheat (Triticum aestivum, 2n=6x=42, genome AABBDD) and spelt (Triticum
spelta, 2n=6x=42, genome AABBDD) (Figure II-1) (Feldman, 2001). Wheat
domestication resulted in the loss of two main features in bread wheat, the brittle rachis and the hulled grains (except for spelt), resulting in non-dehiscent spikes and naked grains (Peng et al., 2011).
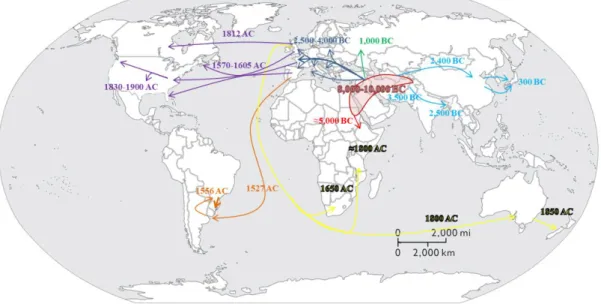
Although bread wheat emerged as a crop only around 10,000 years ago (8,000 BC), it has been greatly diversified since then in terms of adaptation, partly due to its worldwide spread (Figure II-2). Diversification occurred along this long period through
31 mutations or hybridization and leads to the accumulation of a pool of genetic variability (Feldman, 2001).
Nowadays, worldwide wheat cultivation (Figure I-1) encompasses a wide range of environmental conditions, on the five continents. It is cultivated in locations ranging from sea level to more than 3000m above sea level, as in Tibet, Percival (1921) cited by Curtis (2002) and Nepal, and in locations with rainfall ranging from 250 to more than 1700mm per year (Braun et al., 2010).
Figure I-3: The evolutionary and genome relationships between cultivated bread and durum wheats and related wild diploid grasses, showing examples of spikes and grains (Source: Shewry, 2009)
32 Figure I-4 : Worldwide spread of Wheat from the expected origin of the species (red area) according to Bonjean and Angus (2001). BC: Before Christ; AC: After Christ
d. Wheat genetic resources
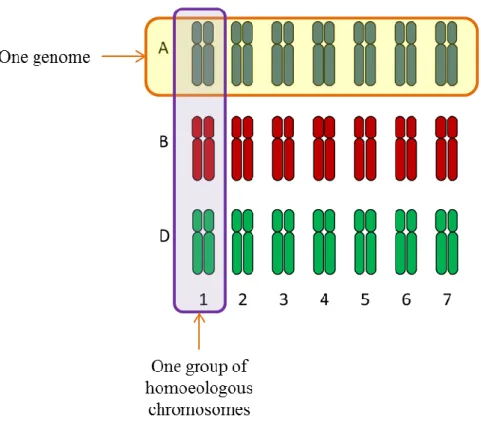
During its history, wheat experienced two events of polyploidization resulting in a very large genome. Bread wheat, Triticum aestivum L. is constituted of 21 pairs of chromosomes grouped into seven groups of homoeologous chromosomes (Figure II-3). Within each group of homoeologous chromosomes, the three chromosomes come from three genome ancestors: Genome A from Triticum urartu, Genome B from a close species of Aegilops speltoides today disappeared, and Genome D from Aegilops tauschii (Figure II-1). A gene located in each homoeologous chromosome is also referred as homoeologous. The bread wheat genomes contained around 17 billion base pairs, approximately five times larger than maize (Zea mays L.) and 40 times larger than rice (Oryza sativa L.) genomes, with more than 80 % of repeated sequences (Paux et al., 2008). Further details will be presented in part VI. Bread wheat polyploid genome is stable despite the three homoeologous genomes thanks to the Ph1 locus (Griffiths et al., 2006). Indeed, this locus avoids pairing between related chromosomes resulting in diploids behavior at meiosis.
33 Figure I-5 : Organization of the hexaploid genome of bread wheat (Triticum aestivum L.) into three different genomes (A, B, and D) and seven homoeologous groups (Adapted from Laperche, 2005).
Before the advent of plant breeding during the XVIIIe, farmers only grew landraces and mixtures of landraces (Skovmand et al., 2002). Figure II-2 illustrates the fact that since the Neolithic age, wheat and its relatives were spread in different environments among which several were drought-prone and heat stress-prone areas. Such spread and diversification of wheat along its evolutionary history is particularly important as we will see later on. Jones et al. (2008) and FAO (2013) defined a landrace as a local ecotype of a domesticated animal or plant breed that has been largely improved by traditional agricultural methods and adaptation to its natural and cultural environment. Nowadays, wheat landraces are not the only material which is considered as genetic resources. Indeed, as mentioned by Becker (1993) and reported by Haussmann et al. (2004), genetics resources can be defined as ‘all materials that are available for improvement of a cultivated plant species’. They can be classified according to the ‘gene pool concept’ into primary, secondary, and tertiary gene pools, and isolated genes representing the fourth class (Harlan and de Wet, 1971; Haussmann et al., 2004). The four classes correspond to (Haussmann et al., 2004):
34
Pool II: related species for which crosses with targeted crop species lead to a low percentage of viable kernels and a progeny partially sterile
Pool III: species for which crosses with targeted crop species are almost impossible and require the use of biotechnological techniques like embryo rescue or protoplast fusion.
Isolated genes: all organisms containing DNA
For wheat, pool I consists of the cultivated, wild and weedy forms of the crop species (Skovmand et al., 2002), i.e., hexaploid landraces, cultivated tetraploids (AABB), wild Triticum dicoccoides, and the diploid donors of the A and B genomes of durum/bread wheat. Pool II contains Triticum tauschii (2n=2x=14, DD), other Aegilops and Triticum species sharing one genome with wheat, and diploid species of the Sitopsis section (putative donors of their B/G genomes; Salina et al. 2006) (Mujeeb-Kazi and Rajaram, 2002; Mujeeb-Kazi, 2003). Within pool III are present all diploid and polyploid wheat species with non-homologous genome to those of wheat (Mujeeb-Kazi and Rajaram, 2002).
Börner et al. (2002) reported that wheat represented the largest collection of accessions with around 900,000 accessions preserved worldwide, with 858,000 of the
Triticum genus and 48,000 of the wild ancestor Aegilops. CIMMYT preserved the
largest collection of wheat accessions worldwide with more than 110,000 accessions, followed by the National Center for Genetic Resources Preservation (NCGRP) in the USA with more than 57,000 accessions. The ten biggest wheat genebank worldwide represent more than half of the 900,000 preserved accessions (Börner et al., 2011). Such variability and its characterization are of paramount importance for the future of breeding, especially in drought and heat stress prone environments.
e. Wheat developmental stages and yield achievement
i. Aerial development and yield achievement
Wheat development is constituted by successive and partially overlapping developmental phases. Wheat development is the result of exogenous factors such as temperature, vernalization, and photoperiod needs. Bread wheat development is mainly dependent on temperature due to its insensitivity to vernalization (Prasad et al., 2008). Therefore, the plant development is usually expressed in terms of thermal time unit, or growing degree days. It corresponds to a measure of the heat accumulation by plants
35 along its development (McMaster and Wilhelm, 1997; Acevedo et al., 2002). Organ differentiation occurs during the various stages of wheat development. In 1974, Zadoks et al. published a scale for cereal development. Such scale is used to ‘quantify’ the wheat development. The Zadoks scale starts with the germination and then the emergence with the leaf production, the tillering with the tiller production, the stem elongation with the “node” production, the booting, the heading, the anthesis, and the physiological maturity (Figure II-4 and II-5).
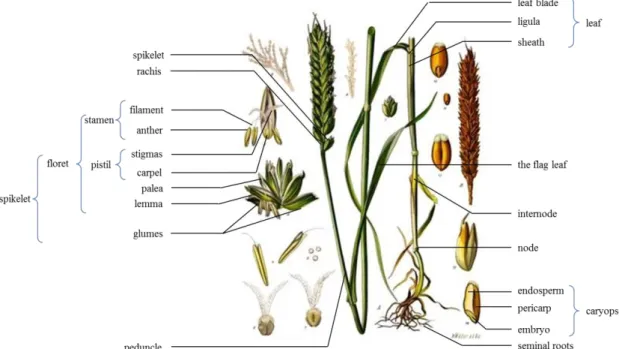
Figure I-6: Wheat, Triticum aestivum L., anatomy adapted from an image processed by Thomas Schoepke (www.plant-pictures.de)
The wheat crop cycle is divided into three periods: (i) the vegetative period, from sowing to floral initiation, occurring during tillering stage, (ii) the reproductive period, from floral initiation to anthesis, and (ii) the grain filling period, from anthesis to physiological maturity (Slafer, 2012). Leaf appearance starts at emergence and ends before booting with emergence of the last leaf, named the flag leaf. Plant height is set from emergence to some days after anthesis. Most of plant height is achieved within the stem growth phase starting some days before terminal spikelet stage (i.e., stem elongation) and ending some days after anthesis with the end of the peduncle growth (Figure II-5) (Acevedo et al., 2002).
Wheat grain yield can be dissected into various components. Each one is established at a more or less specific given period of the crop cycle. We are going to detail it now.
36 Wheat grain yield is established during the whole crop cycle. It is the combination of two main components set during the growth cycle overlapping at anthesis; from emergence to a week after anthesis: the number of grains per square meter, and during the grain development and filling, from grain set stage to physiological maturity: the kernel weight (Figure II-5). At a constant sowing density, the number of grains per square meter can then be dissected into: (i) the number of spikes per square meter and (ii) the number of grains per spike. All tillers produced by a wheat plant will not lead into spikes. Some will abort before anthesis (Gallagher and Biscoe, 1978a; Gaudillère and Barcelo, 1990). Compensation mechanisms exist between the different yield components in wheat. If one is impacted, the other ones might compensate loss (Slafer et al., 1996). In wheat, meiosis coincides with the booting stage (Z4.0). It starts in the middle of the spike and is spread toward both the base and the tip of the spike (Zadoks et al., 1974). In corn (Zea mays L.), Jones et al. (1985) reported at anthesis, after fecundation, a rapid cell division period leading to the appearance of endosperm cells and amyloplast of the future grains. Then, these cells grow, are differentiated and the starch deposition starts. This is the beginning of the grain filling phase (Figure II-5).
37 Figure I-7:Schematic diagram of wheat growth and development adapted from fe d so 199 so d me he so 000 d fe 01 , showing the main developmental stages of wheat growth, their correspondences within the Z doks’ s e (Zadoks et al., 1974; Tottman, 1987) and the timing of initiation of crop yield components. Periods of initiation of growth (or death) of specific organs and those of when different components of grain yield are produced are represented in bottom boxes.
There are two main flowering types in wheat due to their response to vernalization3
(Flood and Halloran, 1986): (i) winter wheat and (ii) spring wheat. The former one shows a strong response to vernalization and requires a period of cold wheather to initiate flower development. In its early stages, winter wheat is highly resistant to frost (-20°C). The latter one has a very mild response or no response to vernalization. It is sensitive to frost (Acevedo et al., 2002). To acquire the ability to flower, some wheat genotypes may require specific day-length: they are sensitive to
3
(from Latin: vernus, of the spring) is the acquisition of a plant's ability to flower or germinate in the spring by exposure to the prolonged cold of winter.
38 photoperiod. Most of cultivated wheat genotypes are long-day plants, i.e., flowering is accelerated with day-length increase, but they do not really need specific length of day to initiate flowering (Major and Kiniry, 1991). The major vernalization and photoperiod genes have been identified, molecular studies have identified their interactions, and gene networks showing their inter-relationship have been proposed (Trevaskis et al., 2007; Distelfeld et al., 2009; Shimada et al., 2009; Trevaskis, 2010). Major genes will be presented on part V.
ii. Roots establishment and growth in cereals
Cereal roots can reach 2m depth in field conditions by the end of anthesis (Lucas et al., 2000; King, 2003). Basic morphology of cereal root systems is well known. It grows following a consistent pattern and, as a consequence, has a relatively predictable architecture in uniform soils (Robinson, 1994). King (2003) reported that dynamic morphology of cereal root systems can be summarized with only a few variables without reducing significantly the resolution of the model.
The whole root system of a plant can be organized in three main schemes: (i) the taproot system found in most of Dicotyledonous and Gymnosperm, (ii) the fascicular root system characteristic of most of Monocotyledonous, and (iii) adventitious roots system (Prat and Rubinstein, 2005). Root system of many cereals like wheat, barley, and oats is classified as fascicular root system. However, it consists in two different root systems occurring successively. First, seminal roots grow from the seeds and then, starting at tillering (Z2.0, Zadoks et al., 1974; Tottman, 1987), nodal roots, also known as adventitious roots, appear at the base of the main stem and tillers, and develops abundant root hair. Each tiller develops its own roots allowing it to be independent of the plant (Lucas et al., 2000). Authors reported a root extension rate, sensitive to temperature and environment, ranging from around 5 mm d-1 for cereals sown in autumn to 15-25 mm d-1 in spring. At full emergence and maximum canopy size, with a root depth reaching 1.5 to 2.0 m depth, maximum root weight is around 1 t ha-1 and total root length range between 16 and 32 km m-2.
f. Grain yield progress from the XVIIIe to the 1990’s
A recurrent purpose in agronomic science is the improvement of crop yield. Many studies focused on bread wheat yield evolution due to its importance in both economy and in human food supply: for the UK winter wheat (Austin et al., 1980, 1989),
39 for the Canadian Prairies spring wheat (Stewart and Dwyer, 1990), for the north western mexican bread wheat (Bell et al., 1995), for the French winter wheat (Brancourt-Hulmel et al., 2003; Brisson et al., 2010; Oury et al., 2012) and for many other countries (Calderini and Slafer, 1998).
In France, first bread wheat varieties cultivated were landraces. One of the first traces of bread wheat variety recorded is ‘Rouge d’Alsace’ and ‘Noé’ around 1826 (Doré et al., 2006). At the beginning of 19th century, yield was around 0.9 t ha-1. In 1950, 150 years later yield had just doubled to reach 2.0 t ha-1. The global grain yield increase was really slow with around +0.01 t ha-1 year-1 (Bonjean et al., 2001; Brancourt-Hulmel et al., 2003). A the end of 19th century, the first variety bred by Henry De Vilmorin, so called ‘Dattel’, from a cross between two English wheats, was the result of a kind of pedigree breeding. At this time, English varieties were late, displayed good resistance to yellow rust (Puccinia striiformis) and to lodging, but had a really poor bread quality. Such quality was brought by “Aquitaine wheat”, originating from Russia. The ‘Bordier’ variety, released in 1889, sign the start of variety combining both habits from Aquitaine and English wheats (Doré et al., 2006). With 1920s came the development of public and private breeding stations that represent an important change in plant breeding. Just before the Second World War, in 1938, with the progresses achieved, France became temporarily self-sufficient in wheat (Bonjean et al., 2001). From 1950 to 1990, yield more than tripled to reach 7.3 t ha-1, corresponding to a progress of +0.13 t ha-1 year-1 (Bonjean et al., 2001). This progress came from the improvement both of agronomic crop management (higher level of input such as nitrogen and pesticide, use of certified seeds, etc.) and of genetic of cultivated varieties. Genetic progress can be dissociated from yield progress due to crop management modernization. In 2003, Brancourt-Hulmel et al. estimated the genetic progress between 1950 and 1990 at +0.063 t ha-1 year-1. Genetic progress was mainly due to the introgression of dwarfing genes, known as the Green Revolution4, which strongly improved harvest index and enabled higher imput levels with reduced lodging risks. It is also the consequence of a better disease resistance (Bonjean et al., 2001).
4 Initiated by Norman Borlaug, the Green Revolution is the result of a series of investigations and technology transfer initiated in the 1940’s and lasted until 1960’s. It leaded to an dramatic increased of the worldwide agricultural production by the development of high yielded cereal varieties, irrigation, modernization of agronomic practices, and the wider use of improved seeds and chemical products (Wikipedia, 2014b).
40 Most of the breeding efforts to improve wheat grain yield resulted in an increase in the number of grains per square meter, by through the number of grains per spike. In 1989, Austin et al. compared older and ‘modern’ US winter wheat varieties, with higher grain yield. He showed that the grain per square meter increased by more than 59 %, with 14 % more spikes per square meter and 30 % more grains per spike, and with a relatively constant grain weight. Similar conclusions were also reached by other studies (Perry and D’Antuono, 1989). A well-known hierarchy of yield components in yield achievement is that the number of grains per square meter is much more important than the grain size, i.e., the number of grains per square meter is the coarse-regulation mechanism and the grain size, only a fine-tuning mechanism (Slafer et al., 2014). As a consequence, modern wheat cultivars are able to sustain grain filling of much more grains per square meter.
After the Green Revolution, the Mexican wheat programme was led by the INIFAP5
and the CIMMYT6
. It mainly focused on the creation of varieties adapted to the northwestern Mexican irrigated conditions. Since 1969, three different environments were targeted in Mexico: the northwestern irrigated areas, the Bajio and central Mexico irrigated areas, and the central highlands rainfed areas (Rajaram and Van Ginkel, 2001). Between 1966 and 2001, in northern Mexican and in the Bajio and Central Mexico irrigated areas, a yield increase of +0.07 t ha-1 year-1 and +0.058 t ha-1 year-1 was reached, respectively. However, in the central highlands rainfed areas, the grain yield progress was lower than in irrigated conditions and reached only +0.024 t ha-1 year-1. Historical genetic gain in absolute values is almost always lower under stressed environments than in unstressed conditions (Rajaram and Van Ginkel, 2001). However, Blum (2006) shown that when the genetic gain is regarded as a percentage of average yield, whatever the environment considered, genetic gains are quite close. Austin et al. (1989) observed a gain from 0.6 to 0.7 % in unstressed conditions and from 0.4 to 0.6 % under stressed environments.
It was necessary to present the origin, genetic structure, and growth and development of bread wheat. However, the main interest of this PhD is about the adaptation of plants under abiotic stress conditions; drought and heat stress. But what is
5
National institute of forestry, agriculture and animal research 6 International center for maize and wheat improvement