HAL Id: hal-03118929
https://hal.archives-ouvertes.fr/hal-03118929
Submitted on 22 Jan 2021
HAL is a multi-disciplinary open access
archive for the deposit and dissemination of
sci-entific research documents, whether they are
pub-lished or not. The documents may come from
teaching and research institutions in France or
abroad, or from public or private research centers.
L’archive ouverte pluridisciplinaire HAL, est
destinée au dépôt et à la diffusion de documents
scientifiques de niveau recherche, publiés ou non,
émanant des établissements d’enseignement et de
recherche français ou étrangers, des laboratoires
publics ou privés.
Short H2A histone variants are expressed in cancer
Guo-Liang Chew, Marie Bleakley, Robert Bradley, Harmit Malik, Steven
Henikoff, Antoine Molaro, Jay Sarthy
To cite this version:
Guo-Liang Chew, Marie Bleakley, Robert Bradley, Harmit Malik, Steven Henikoff, et al.. Short H2A
histone variants are expressed in cancer. Nature Communications, Nature Publishing Group, 2021,
12 (1), pp.490. �10.1038/s41467-020-20707-x�. �hal-03118929�
Short H2A histone variants are expressed in cancer
Guo-Liang Chew
1, Marie Bleakley
2, Robert K. Bradley
3,4,5, Harmit S. Malik
4,6, Steven Henikoff
4,6,
Antoine Molaro
4,7✉
& Jay Sarthy
4✉
Short H2A (sH2A) histone variants are primarily expressed in the testes of placental mammals. Their incorporation into chromatin is associated with nucleosome destabilization and modulation of alternate splicing. Here, we show that sH2As innately possess features similar to recurrent oncohistone mutations associated with nucleosome instability. Through analyses of existing cancer genomics datasets, wefind aberrant sH2A upregulation in a broad array of cancers, which manifest splicing patterns consistent with global nucleosome destabilization. We posit that short H2As are a class of“ready-made” oncohistones, whose inappropriate expression contributes to chromatin dysfunction in cancer.
https://doi.org/10.1038/s41467-020-20707-x OPEN
1The Cancer Science Institute of Singapore, National University of Singapore, Singapore, Singapore.2Clinical Research Division, Fred Hutchinson Cancer Research Center, Seattle, WA, USA.3Computational Biology Program, Public Health Sciences Division, Fred Hutchinson Cancer Research Center, Seattle, WA, USA.4Basic Sciences Division, Fred Hutchinson Cancer Research Center, Seattle, WA, USA.5Department of Genome Sciences, University of Washington, Seattle, WA, USA.6Howard Hughes Medical Institute, Fred Hutchinson Cancer Research Center, Seattle, WA, USA.7Present address:
Genetics, Reproduction and Development (GReD) Institute, Université Clermont Auvergne, Clermont-Ferrand, France. ✉email:antoine.molaro@uca.fr; jsarthy@fredhutch.org
123456789
N
ucleosomes, the fundamental subunit of chromatin, con-sist of octamers of histones (H2A, H2B, H3, and H4) that wrap 147 bp of DNA1. Single-allele mutations in histones,termed “oncohistones”, are found in many different
malignancies2,3. Oncohistones comprise small percentages of the total histone pool4,5 and rarely cause cancer by themselves2,6.
Instead, they synergize with other oncogenes to facilitate the development of neoplastic chromatin landscapes2,6. Recent large-scale cancer genome analyses identified recurrent mutations in histones within the highly conserved histone fold domain (HFD) in many common cancers2,3. These HFDs mutations, including the well-characterized H2B-E76K substitution, reduce nucleo-some stability in vitro and perturb chromatin in vivo2,7. Similarly,
most H2A HFD oncohistone mutations disrupt either contact sites with DNA (R29Q) or inter-nucleosomal interactions (acidic patch) (Fig. 1a). Cells co-expressing H2B-E76K and a PI3KCA oncogene showed increased transformation capacity, consistent with nucleosome instability, enhancing the cancerogenic potential of other oncogenes2.
Short histone H2A variants (sH2A) are a class of histone var-iants expressed during mammalian spermatogenesis8–11. Regula-tion of sH2A expression in normal testis is unknown12. Unlike
other histone variants, sH2As are rapidly evolving and possess highly divergent HFDs, mutated acidic patches, and truncated C-termini, all of which impact nucleosome stability8,13–16. The best
characterized of these variants, H2A.B, forms unique nucleosomes that wrap ~120 bp of DNA both in vitro and in vivo15–17. In testis, H2A.B is incorporated into nucleosomes during meiosis and has been shown to interact with splicing factors at actively transcribed genes17–20. Germline disruption of H2A.B-encoding genes in mice
revealed that H2A.B loss is associated with chromatin dysfunction and splicing changes in testis18.
Though a role for sH2As in cancer has yet to be determined21,
the emerging literature on nucleosome instability as cancer driver2,3 along with H2A.B’s potent ability to destabilize
nucleosomes13–16prompted us to investigate whether sH2As may
contribute to cancer. Previous work showed that expression of H2A.B causes increased sensitivity to DNA damaging agents, shortens S-phase22, and alters splicing17,19,22, each of which are
associated oncogenesis. Additional evidence for a role for H2A.B in cancer comes from Hodgkin’s lymphoma (HL), where H2A.B transcripts have been detected23and HL cells expressing H2A.B
grow faster than H2A.B-negative cells22. Here, through
com-parative analyses of germline short H2A sequences and onco-histone mutations in canonical H2A, we show that short H2As inherently possess oncohistone features. We explore several cancer data sets andfind H2A.B expression in a diverse array of malignancies. We also show that many of these cancers possess unique splicing signatures. We propose that the nucleosome-destabilizing characteristics sH2As evolved for their role in testis result in oncohistone activity in other tissues.
Results
sH2As have evolved oncohistone features. There are five X-linked sH2A genes in humans: H2A.B.1.1 (H2AFB2), H2A.B.1.2 (H2AFB3), H2A.B.2 (H2AFB1), H2A.P (HYPM), and H2A.Q (unannotated)8. We compared the amino-acid sequences of
sH2As to canonical H2A to assess whether their rapid evolution resulted in oncohistone-like changes. This analysis revealed that many of the most common cancer-associated mutations in canonical H2A are already present in all wild-type sH2A sequences (Fig.1a, Supplementary Fig. 1a, b). This includes R29Q/ F substitutions that correspond to the second most frequent mutation in canonical H2A (Fig.1a, Supplementary Fig. 1a, b)2,3.
In addition, all wild-type sH2As have a C-terminal truncation that removes E121, the most common mutation in canonical H2A (Fig. 1a, Supplementary Fig. 1a, b)2,3. Phylogenetic analyses in
primates showed that despite their rapid evolution, these oncohistone-like changes are highly conserved (Fig. 1b, Supple-mentary Fig. 1a–c)8. This conservation implies functional
con-sequences as many of these residues are critical contact points for histone-DNA or histone-histone interactions1,13–16. These data
Fig. 1 H2A.B possesses oncohistone features that are conserved throughout primates. a Schematic of common oncomutations found in human core H2A and their status in H2A.B. Marked sites on core H2A show WT amino acid position followed by its most common cancer-specific substitution in TCGA (pink). Associated sites found in WT short H2As are shown in purple.b Protein alignment of core H2A, testis-specific H2A (TH2A), and H2A.B paralogs from Human and representative primates. Substitutions corresponding to oncohistone mutations in H2A (see Fig.1.) are shown in pink.
show that sH2As contain oncohistone features similar to cano-nical H2A mutations in cancers.
H2A.Bs are reactivated in a broad array of cancers. The oncohistone properties inherent in sH2As indicate that they may play a role in cancer simply through upregulation. We focused on the expression of H2A.B paralogs, as they are well annotated and have been shown to impact both nucleosome stability and cell cycle progression22. To investigate whether H2A.Bs are reacti-vated in different cancers, wefirst used transcriptomic data from The Cancer Genome Atlas (TCGA). This analysis showed that H2A.B paralogs are activated (at a threshold of >1.5 transcripts per million (TPM)) in numerous individual tumors across cancer types (Fig.2a, Supplementary Data 1, Supplementary Data 2), but never in adjacent normal tissue (Supplementary Data 1), and very rarely (<1.5%) in non-testes tissue samples from the
Genotype-Tissue Expression database (Supplementary Table 1). The range of expression varies widely, with H2A.B-encoding transcripts present at >100 TPMs in two specimens (Supplementary Data 2). Although many tumors reactivate H2AFB1 alone, most tumors that express H2AFB2 also express H2AFB3 (Fig.2a). Thisfinding may result from transcriptional co-regulation due to their geno-mic proximity (Supplementary Fig. 2b) or inability to distinguish these near-identical paralogs by short-read mapping8. Despite their similarity, we were able to distinguish these two genes in a few tumor samples (Fig.2a).
Across the TCGA data set, diffuse large B-cell lymphomas (DLBCLs) showed the highest frequency of aberrant H2A.B expression at 50% (Fig.2a). A recent analysis of DLBCL genomes identified five distinct molecular subtypes24, including a favorable
prognosis-germinal center (FP-GC) subtype associated with histone mutations. We investigated whether H2A.B expression
Fig. 2 H2A.B is expressed in a broad array of cancers. a Heat map illustrating the co-expression of H2A.B paralogues in individual tumors that express any one H2A.B paralogue (at >1.5 TPM as measured by RNA-seq), for cancer types with at least 10 tumors expressing any H2A.B paralogue. Percentages of tumors for each cancer type that express any H2A.B paralogue are shown.b Expression levels (TPM) of H2A.B-encoding transcripts in three independent B-acute lymphoblastic leukemia data sets, horizontal line demarcates 1.5 TPM as measured by RNA-seq. Only samples with non-zero expression of any H2A.B paralog are shown: 18, 5, and 1 samples are omitted from Liu et al. 2016, Qian et al. 2017, and Yasuda et al. 2016, respectively.c As in b, but for cancer cell lines from CCLE, grouped by their lineage. Only lineages with any sample >1.5 TPM, and samples with non-zero expression of any H2A.B paralog are shown.
was restricted to the FP-GC subtype. We queried the 37 DLBCL samples for mutations associated with the FP-GC subtype including linker H1 and core histones, immune evasion genes,
PI3K, NF-κB, and JAK/STAT/RAS pathway components24.
Twenty-five samples had a mutation in at least one of these genes, including 15 different samples with histone mutations (Supplementary Data 3). H2A.B was expressed in 13 samples with any FP-GC mutation, and in 6 of the 10 FP-GC samples without histone mutations (Supplementary Data 3). To contrast this with another DLBCL subtype, we analyzed H2A.B expression in the poorer prognosis-germinal center subtype associated with muta-tions in chromatin modifiers EZH2, CREBBP, EP300, KMT2D, and BCL11A24. Though we did not identify any EZH2 mutations,
15 samples had mutations in at least one chromatin modifier gene. Nine of these samples also had H2A.B upregulation. These analyses suggest that H2A.B expression occurs in multiple germinal center DLBCL subtypes.
Other cancers in the TCGA data set with H2A.B aberrant expression include uterine corpus endometrial carcinomas (UCEC) (9.5%), urothelial bladder carcinomas (BLCA) (4.7%), and cervical squamous cell carcinomas and endocervical carcinomas (4.5%) (Fig.2a). These same cancers were previously identified as having
the highest frequencies of core histone mutations in the TCGA data set, ranging from 5 to 8%2. We found a few specimens with both recurrent H2A mutations and H2A.B expression (Supplementary Data 4), however, the low numbers of specimens that share both of these features hinder meaningful correlative analyses.
Upregulation of H2A.B in HL23 and DLBCLs (Fig. 2a)
prompted us to analyze data sets from other lymphoid lineage-derived, low mutation cancers for aberrant H2A.B expression. We queried four separate B-acute lymphoblastic leukemia (B-ALL) data sets and found 6–7% of specimens with H2A.B-encoding transcripts at >1.5 TPM (Fig. 2b) in three of the data sets25–27,
and 13% in the fourth (Supplementary Fig. 2c)28. Because of the diversity of liquid and solid cancers with H2A.B expression, we searched the Cancer Cell Line Encyclopedia (CCLE) database29
for cell lines with H2A.B expression at >1.5 TPM. Consistent with high-frequency H2A.B expression in TCGA DLBCLs, lymphomas demonstrated the highest percentage of H2A.B-positive cell lines (Fig.2c), with 70% of HL and 25% of non-Hodgkin’s lymphoma
cell lines expressing H2A.B. The spectrum of H2A.B expression across other cancers was also similar between CCLE and TCGA data sets (Fig. 2c). We conclude that H2A.B is aberrantly expressed in a broad array of cancers.
We investigated the potential causes of H2A.B induction in cancer. Although little is known about the transcriptional regulation of H2A.B-encoding loci in testis, changes in X-chromosome ploidy are associated with increased fitness in cancer cells30. We investigated whether H2A.B expression in
cancer may result from global derepression of large domains, amplifications, or gain of an additional X chromosome in these samples. We compared levels of X- to autosome-linked transcripts in H2A.B-expressing and silent samples and found no significant differences (Supplementary Fig. 2a). We also investigated the expression profiles of individual H2AFB loci and their surrounding regions and found that upregulation was limited to each individual H2A.B-encoding locus without upregulation of neighboring loci (Supplementary Fig. 2b). These results are consistent with our findings in the TCGA data set, where median H2A.B expression for the 232 H2A.B-positive samples is ~3 TPM (Supplementary Data 2), corresponding to 49th percentile of all expressed genes. This level of expression is more likely the result of local, specific activation of individual H2AFB paralogues than recurrent amplifications or broader X-chromosome dysfunction.
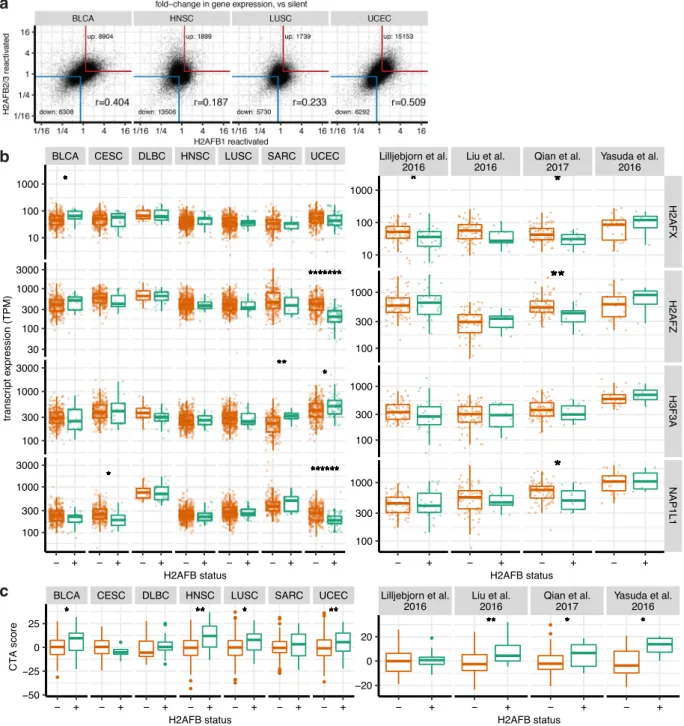
H2A.Bs are associated with cancer-specific, rather than pan-cancer gene expression programs. H2A.B proteins encoded by H2AFB1 and H2AFB2/3 are nearly identical in sequence. Never-theless, the independent reactivation of H2AFB1 and H2AFB2/3 in different cancer specimens raised the possibility that these closely related paralogues may be associated with distinct global gene expression programs. To explore this, we compared transcriptomes from H2AFB1-reactivated samples versus those from H2AFB2/3-reactivated samples within the same cancer types. We found thousands of genes that were commonly up- or downregulated in UCEC, HNSC, LUSC, and BLCA (Fig.3a), suggesting that different H2A.B paralogues operate in similar gene expression contexts.
We investigated whether expression of other genes was consistently associated with H2A.B expression. We found 146 genes were upregulated and 90 downregulated across H2A.B-positive cancers (Supplementary Data 5). We did not identify co-upregulation of other testis-specific histone variants such as H2A.1 (TH2A) or H2B.1 (TH2B)20 (Supplementary Data 5) in H2A.B-expressing cancers. Three histone variants with broad tissue distributions, H2A.Z, H2A.X, and H3.3, also did not show consistent differences between H2A.B-positive and negative cancers, except for lower H2A.Z and H2A.X in UCEC (Fig.3b). We note that median H2A.X levels are similar to maximum values for H2A.B (Fig. 3b, Supplementary Data 1). We also examined expression of the histone chaperone NAP1 (NAP1L1), which can assemble H2A.B-containing nucleosomes15,21. We detected NAP1-encoding transcripts in all
TCGA cancers, with DLBCLs expressing the highest levels (Fig.3b, Supplementary Table 2). The chromatin consequences of this correlation, i.e., whether higher NAP1 levels result in increased incorporation of H2A.B in chromatin are unknown.
We noted that 12/146 of the commonly upregulated genes are Cancer-Testis Antigens. As H2AFB1 was previously shown to be co-expressed with a subset of CTAs in HL23, we determined
whether H2A.B-reactivated cancers are generally associated with CTA upregulation. We summarized the expression of individual
CTAs into a composite “CTA score” for each tumor and
compared scores between H2A.B-reactivated and silent samples (Fig. 3c). Although H2A.B-expressing HNSCs, LUSCs, and UCECs showed statistically significant CTA enrichment, DLBCLs and SARCs did not (Fig.3c). We also examined the four B-ALL data sets and found that H2A.B expression was associated with CTA upregulation (Fig. 3c). However, individual CTAs such as NY-ESO-1 (CTAG1B) and CT45A5 were variably expressed across cancers (Supplementary Data 5), consistent with well-recognized transcriptional heterogeneity of this class of genes31,32.
These data indicate that H2A.B expression is associated with CTA expression in several cancer types.
CTAs are subject to endogenous immunosurveillance mechan-isms23and TCGA tumor samples are known to contain variable
amounts of immune infiltrates33. We investigated whether H2A.B
expression was associated with immune infiltrates, as this could confound our transcriptome analyses. We found that transcript levels for markers of B-cells, T-cell subsets, NK cells, monocytes, and activated macrophages did not show consistent enrichment across H2A.B-expressing tumors (Supplementary Fig. 3). In fact, UCEC displayed a statistically significant decrease in PRF1 expression as well as several macrophage and neutrophil markers. Several sH2A-derived peptides are predicted to bind human leukocyte antigen (HLA) molecules34,35(Supplementary Data 6),
suggesting an immunosuppressive microenvironment may con-tribute to sustained H2A.B expression in UCEC. The lack of excess immune infiltrates in H2A.B-positive TCGA specimens and the identification of H2A.B-positive cancer cell lines (Fig.2c) support H2A.B upregulation in cancer cells, though a contribution from surrounding stroma in patient specimens cannot be excluded.
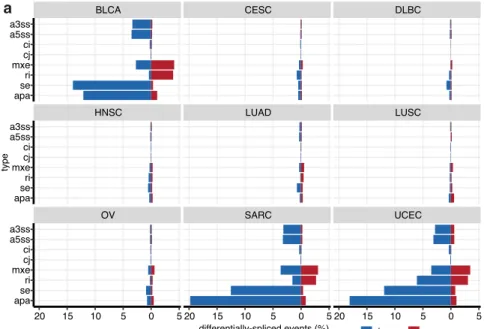
H2A.B-expressing cancers have distinct splicing patterns. H2A. B has been shown to directly bind RNA and interacts with spli-cing factors and H2A.B expression impacts alternative splispli-cing patterns17–20,22. To determine if H2A.B expression is associated with splicing dysregulation, we annotated and quantified all constitutive and alternative splicing events in the transcriptomes
of H2A.B-reactivated and silent tumors from the TCGA data set. We uncovered thousands of altered splicing events between these cancers (Fig.4a, b). We found that H2A.B expression is associated with reduced utilization of alternative “cassette exons” (se) and proximal alternative 3′ polyadenylation (APA) sites (Supple-mentary Fig. 4a, b). These features were particularly prominent in
***********************************************************************************************
******************************************************************************************
**
**
**
**
**
**
**
**
**
**
**
**
**
**
**
**
**
**
**
**
**
**
**
**
**
**
**
**
**
**
**
**
**
**
**
**
**
**
**
**
**
**
**
**
**
**
**
**
**
**
**
**
**
**
**
**
**
**
**
**
**
**
**
**
**
**
**
**
**
**
**
**
**
**
**
**
**
**
**
**
**
**
**
**
**
**
**
**
**
**
******************************************************************************************
Lilljebjorn et al. 2016 Liu et al. 2016 Qian et al. 2017 Yasuda et al. 2016 H2AFX H2AFZ H3F3A NAP1L1 − + − + − + − + 10 100 1000 100 300 1000 100 300 1000 100 300 1000 H2AFB status ** ** ** ** ** ** ** ** ** ** ** ** ** ** ** ** ** ** ** ** ** ** ** ** ** ** ** ** ** ** ** ** ** ** ** ** ** ** ** ** ** ** ** ** ** ** ** ** ** ** ** ** ** ** ** ** ** ** ** ** ** ** ** ** ** ** ** ** ** ** ** ** ** ** ** ** ** ** ** ** ** ** ** ** ** ****************************************************************************************** **************************** Lilljebjorn et al. 2016 Liu et al. 2016 Qian et al. 2017 Yasuda et al. 2016 − + − + − + − + −20 0 20 H2AFB status ********************************************************************************************************************************************************************************************************************************************************************************************************************** ************************************************************************************************************************************************************************************************************************************************************************************************************************************************************************************************************************************************************************************************************************************************************************************************************************************************************************************************************************************************************************************************************************************************************************************************************************ ******************************************************************************************************************************************************************************************************************************************************************************************************************************************************************************************************************************* **********************************************************************************************************************************************************************************************************************************************************************************************************************************************************************************************************************************************************************************************************************************************************************************************************************************************************************************************************************************************************************************************************************************************************************************************************************************************************************************************************************************BLCA CESC DLBC HNSC LUSC SARC UCEC
− + − + − + − + − + − + − + −50 −25 0 25 H2AFB status CTA score
b
a
c
******************************************************************************************************************************************************************************************************************************************************************************************************** **************************************************************************************************************************************************************************************************************************************************** ** ** ** ** ** ** ** ** ** ** ** ** ** ** ** ** ** ** ** ** ** ** ** ** ** ** ** ** ** ** ** ** ** ** ** ** ** ** ** ** ** ** ** ** ** ** ** ** ** ** ** ** ** ** ** ** ** ** ** ** ** ** ** ** ** ** ** ** ** ** ** ** ** ** ** ** ** ** ** ** ** ** ** ** ** ** ** ** ** ** ** ** ** ** ** ** ** ** ** ** ** ** ** ** ** ** ** ** ** ** ** ** ** ** ** ** ** ** ** ** ** ** ** ** ** ** ** ** ** ** ** ** ** ** ** ** ** ** ** ** ** ** ** ** ** ** ** ** ** ** ** ** ** ** ** ** ** ** ** ** ** ** ** ** ** ** ** ** ** ** ** ** ** ** ** ** ** ** ** ** ** ** ** ** ** ** ** ** ** ** ** ** ** ** ** ** ** ** ** ** ** ** ** ** ** ** ** ** ** ******* ******* ******* ******* ******* ******* ******* ******* ******* ******* ******* ******* ******* ******* ******* ******* ******* ******* ******* ******* ******* ******* ******* ******* ******* ******* ******* ******* ******* ******* ******* ******* ******* ******* ******* ******* ******* ******* ******* ******* ******* ******* ******* ******* ******* ******* ******* ******* ******* ******* ******* ******* ******* ******* ******* ******* ******* ******* ******* ******* ******* ******* ******* ******* ******* ******* ******* ******* ******* ******* ******* ******* ******* ******* ******* ******* ******* ******* ******* ******* ******* ******* ******* ******* ******* ******* ******* ******* ******* ******* ******* ******* ******* ******* ******* ******* ******* ******* ******* ******* ******* ******* ******* ******* ******* ******* ******* ******* ******* ******* ******* ******* ******* ******* ******* ******* ******* ******* ******* ******* ******* ******* ******* ******* ******* ******* ******* ******* ******* ******* ******* ******* ******* ******* ******* ******* ******* ******* ******* ******* ******* ******* ******* ******* ******* ******* ******* ******* ******* ******* ******* ******* ******* ******* ******* ******* ******* ******* ******* ******* ******* ******* ******* ******* ******* ******* ******* ******* ******* ******* ******* ******* ******* ******* ******* ******* ******* ******* ******* ******* ******* ******* ******* ******* ******* ******* ******* ******* ******* ******* ******* ******* ******* ******* ******* ******* ******* ******* ******* ******* ******* ******* ******* ******* ******* ******* ******* ******* ******* ******* ******* ******* ******* ******* ******* ******* ******* ******* ******* ******* ******* ******* ******* ******* ******* ******* ******* ******* ******* ******* ******* ******* ******* ******* ******* ******* ******* ******* ******* ******* ******* ******* ******* ******* ******* ******* ******* ******* ******* ******* ******* ******* ******* ******* ******* ******* ******* ******* ******* ******* ******* ******* ******* ******* ******* ******* ******* ******* ******* ******* ******* ******* ******* ******* ******* ******* ******* ******* ******* ******* ******* ******* ******* ******* ******* ******* ******* ******* ******* ******* ******* ******* ******* ******* ******* ******* ******* ******* ******* ******* ******* ******* ******* ******* ******* ******* ******* ******* ******* ******* ******* ******* ******* ******* ******* ******* ******* ******* ******* ******* ******* ******* ******* ******* ******* ******* ******* ******* ******* ******* ******* ******************************************************************************************************************************************************************************************************************************************************************************************************************************************* ****** ****** ****** ****** ****** ****** ****** ****** ****** ****** ****** ****** ****** ****** ****** ****** ****** ****** ****** ****** ****** ****** ****** ****** ****** ****** ****** ****** ****** ****** ****** ****** ****** ****** ****** ****** ****** ****** ****** ****** ****** ****** ****** ****** ****** ****** ****** ****** ****** ****** ****** ****** ****** ****** ****** ****** ****** ****** ****** ****** ****** ****** ****** ****** ****** ****** ****** ****** ****** ****** ****** ****** ****** ****** ****** ****** ****** ****** ****** ****** ****** ****** ****** ****** ****** ****** ****** ****** ****** ****** ****** ****** ****** ****** ****** ****** ****** ****** ****** ****** ****** ****** ****** ****** ****** ****** ****** ****** ****** ****** ****** ****** ****** ****** ****** ****** ****** ****** ****** ****** ****** ****** ****** ****** ****** ****** ****** ****** ****** ****** ****** ****** ****** ****** ****** ****** ****** ****** ****** ****** ****** ****** ****** ****** ****** ****** ****** ****** ****** ****** ****** ****** ****** ****** ****** ****** ****** ****** ****** ****** ****** ****** ****** ****** ****** ****** ****** ****** ****** ****** ****** ****** ****** ****** ****** ****** ****** ****** ****** ****** ****** ****** ****** ****** ****** ****** ****** ****** ****** ****** ****** ****** ****** ****** ****** ****** ****** ****** ****** ****** ****** ****** ****** ****** ****** ****** ****** ****** ****** ****** ****** ****** ****** ****** ****** ****** ****** ****** ****** ****** ****** ****** ****** ****** ****** ****** ****** ****** ****** ****** ****** ****** ****** ****** ****** ****** ****** ****** ****** ****** ****** ****** ****** ****** ****** ****** ****** ****** ****** ****** ****** ****** ****** ****** ****** ****** ****** ****** ****** ****** ****** ****** ****** ****** ****** ****** ****** ****** ****** ****** ****** ****** ****** ****** ****** ****** ****** ****** ****** ****** ****** ****** ****** ****** ****** ****** ****** ****** ****** ****** ****** ****** ****** ****** ****** ****** ****** ****** ****** ****** ****** ****** ****** ****** ****** ****** ****** ****** ****** ****** ****** ****** ****** ****** ****** ****** ****** ****** ****** ****** ****** ****** ****** ****** ****** ****** ****** ****** ****** ****** ******BLCA CESC DLBC HNSC LUSC SARC UCEC
− + − + − + − + − + − + − + 10 100 1000 30 100 300 1000 3000 100 300 1000 3000 100 300 1000 3000 H2AFB status tr anscr ipt e x pression (TPM)
Fig. 3 Gene expression analyses in H2A.B-reactivated cancers. a Scatter plot of gene expression differences (expressed as fold-change), comparing H2AFB1-positive against negative tumors (x axes), and H2AFB2/3-positive against negative tumors (y axes). The red and blue borders show genes that are commonly up- or downregulated at >1.19-fold. Pearson correlation coefficient is also shown. b Boxplots comparing levels of H2A.Z (H2AFZ), H3.3 (H3F3A), H2A.X (H2AFX), and NAP1 (NAP1L1) transcripts in H2A.B-positive (green) vs negative (orange) cancers from TCGA and B-ALL data sets. Asterisks show the statistical significance of the difference in TPMs by a two-sided Mann–Whitney U test. *p < 0.05; **p < 0.01; ******p < 0.000001; *******p < 0.0000001. Number of cancer samples in each group are listed in Supplementary Table 2. Boxplots indicate the 1st quartile, median and 3rd quartile, whereas the whiskers extend from the box-ends to values no larger/smaller than 1.5 times of the inter-quartile range. All data points are additionally plotted.c Boxplots as in b, comparing CTAs scores in H2A.B-positive (green) and negative (orange) cancers in TCGA and B-ALL cancers. For each tumor, the expression of CTAs is summarized as a CTA score: the sum Z-normalized log expression of the top 40 most variably expressed CTAs (within each cancer type). Asterisks show the statistical significance of the difference in CTA scores by a one-sided Mann–Whitney U test. *p < 0.05; **p < 0.01. Outlier points beyond the whiskers are additionally plotted.
Qian et al. 2017 Yasuda et al. 2016 Lilljebjorn et al. 2016 Liu et al. 2016
−30 −20 −10 0 −30 −20 −10 0 apa se ri mxe cj ci a5ss a3ss apa se ri mxe cj ci a5ss a3ss differentially−spliced events (%) type OV SARC UCEC HNSC LUAD LUSC BLCA CESC DLBC 20 15 10 5 0 5 20 15 10 5 0 5 20 15 10 5 0 5 apa se ri mxe cj ci a5ss a3ss apa se ri mxe cj ci a5ss a3ss apa se ri mxe cj ci a5ss a3ss differentially-spliced events (%) type down up apa se
: alt. poly-A site : skipped (cassette) exon ri mxe : retained intron : mutually-exclusive exon a5ss a3ss
: alt. 5' splice site : alt. 3' splice site
cj ci : constitutive junction : constitutive intron a b c
Fig. 4 Splicing analyses in H2A.B-reactivated cancers. a Bar graphs showing the percentage of up- and downregulated splicing events (constitutive and alternative) when comparing H2A.B-positive to negative tumors, for cancer types with at least 10 tumors expressing any H2A.B paralogue.b Scatter plots of alternative cassette exon inclusion for various cancers, comparing individual events from H2A.B-positive (y axes) to negative tumors (x axes). Axes units are fraction of transcripts that include the alternative cassette exon (Psi). Red and blue points indicate events that are significantly up- or downregulated (respectively) in H2A.B-positive tumors, at a threshold ofp < 0.05 (one-sided Mann–Whitney test) and the difference in Psi >0.1. The number of significantly up- and downregulated events are tallied in the bottom of each panel. c As in a, but for B-ALL data sets.
BLCA, SARC, and UCEC (Fig. 4a, Supplementary Fig. 4a). Although the changes are individually modest (Supplementary Fig. 4c–f, Supplementary Data 7), they are widespread, i.e., we observe significant changes at thousands of sites across multiple cancer types (Fig.4a, b). These patterns are not H2A.B paralogue-specific, as similar patterns were observed in specimens expres-sing either H2AFB1 or H2AFB2/3 (Supplementary Fig. 4a, b).
We also explored splicing in the four B-ALL data sets. Unlike in myelodysplastic syndromes and acute myelogenous leuke-mias36, B-ALLs are not associated with mutations in splicing
factors and global splicing dysregulation is not thought to be a major driver of these leukemias. When we compared splicing patterns in the H2A.B-reactivated and silent samples within each data set, we observed aberrant splicing at a scale similar to that seen in H2A.B-positive TCGA cancers, with reductions in alternative exon and APA usage. However, the most notable feature is a consistent decrease in retained introns“ri” in all four data sets (Fig. 4c). We conclude that H2A.B expression is associated with splicing dysfunction, with some features common among many cancers while others occur in a context-specific manner.
Discussion
The discovery of oncohistone mutations has revealed new insights into the biology of cancer. We show that all mammalian genomes already encode sH2A histone variants that have evolved nucleosome-destabilizing features without any additional coding mutations. These features are important for sH2As’ roles in normal testis physiology but result in oncohistone properties when expressed out of context. In this manner, they are similar to CATACOMB/EZHIP37,38, another testis-specific oncohistone
mimic that inhibits EZH2 in a subset of rare malignancies. Unlike CATACOMB/EZHIP, however, H2A.B expression occurs in many common cancers. The diversity of H2A.B-expressing can-cer types suggests that pathological histone dynamics play a more significant role in neoplasia than previously appreciated.
The precise molecular targets of H2A.B expression in cancers are not known. Relatively few genes are commonly dysregulated across H2A.B-positive malignancies (Supplementary Data 5), implying that H2A.B impacts different genes in different cancers. As nucleosomes protect DNA from inappropriate transcription factor binding, nucleosome instability may allow oncogenic TFs access to different regulatory elements depending on cancer type2,39. Nucleosome destabilization also hastens RNA pol II
elongation, which in turn reduces transcription-coupled splicing efficiency40. Alternative exons and proximal polyadenylation
sequences are preferentially impacted by inefficient splicing owing to their weaker splice signals, resulting in a splicing phe-notype similar to those observed in several H2A.B-positive can-cers40. As some alternative exons promote mRNA degradation by
targeting them for nonsense-mediated decay, even modest reductions in alternative splicing can increase oncogene expres-sion41. H2A.B may operate at the nexus of several processes that
cooperate to drive oncogenesis.
The relationship between histone dynamics, transcription, and splicing may also explain our inability to detect a splicing phe-notype in DLBCLs despite high-frequency H2A.B expression. Many chromatin proteins are deranged in DLBCLs including Myc, p300, H1 linker, and core histones, each of which can also impact alternative splicing24,42–44. Whether potential similarities
between histone mutant cancers and H2A.B-expressing cancers extend to prognoses and vulnerabilities merits further investiga-tion, particularly in the context of DLBCL where larger data sets are needed to dissect these relationships. Several cell lines show sensitivity to H2AFB1-gRNAs in the Sanger Cancer Dependency
Map, with lymphoma-derived cell lines SU-DHL-8 and IM9 being among the most sensitive to H2AFB1 disruption45. Better characterization of histone mutations and H2A.B expression across cancer cell lines is also needed in order to probe for similarities between H2A.B-expressing cancers and histone mutant cancers. Finally, sH2A-derived short peptides that bind HLA molecules (Supplementary Data 6) may be useful immu-notherapy targets, and global splicing dysregulation can also generate highly immunogenic neoantigens46. Thus, our discovery
of sH2A-expressing cancers may open new avenues of study and treatment for hundreds of thousands of cancer cases worldwide. Methods
Alignments of sH2A sequences. sH2A and other H2A sequences were retrieved from Histone DB v247and previously published work8. Predicted protein
sequences from annotated CDS were aligned using ClustalW and manually cura-ted. For primate alignments, sequences were arranged according to the accepted species phylogeny.
Genome annotation, RNA-seq read mapping, and gene and isoform expres-sion estimation. RNA-seq reads from TCGA were downloaded from CGHub. Reads were processed for gene expression and splice isoform ratio quantification as previously described48. In brief, read alignment and expression estimation were
performed with RSEM v1.2.44349, Bowtie v1.0.04450, and TopHat v2.1.14551, using
the hg19/GRCh37 assembly of the human genome with a gene annotation that merges the UCSC knownGene gene annotation52, Ensembl v71.1 gene
annota-tion53, and MISO v2.0 isoform annotation48. MISO v2.038 was used to quantify
isoform ratios. The trimmed mean of M values method54, as applied to coding
genes, was used to normalize gene expression estimates across all of TCGA. Data analysis and visualization. Data analysis was performed in the R pro-gramming environment and relied on Bioconductor55, dplyr56, and ggplot257.
RNA-seq coverage plots. RNA-seq coverage plots (i.e., Fig. S2c–f) were made using the ggplot2 package in R, and represent reads normalized by the number of reads mapping to all coding genes in each sample (per million).
Somatic mutation analysis. TCGA somatic mutation calls from the Mutect pipeline58, were obtained using the GDCquery_Maf function from
TCGAbio-links59. Mutations in the following canonical histones were collated by their class:
H2A—HIST1H2A(A/B/C/D/E/G/H/I/J/K/L/M), HIST2H2A(B/C), HIS3H2A; H2B —HIST1H2B(A/B/C/D/E/F/G/H/I/J/K/L/M/N/O), HIST2H2B(E/F), HIST3H2BB. Recurrent mutations (Supplementary Data 3) are defined as occurring at least five times across all cancer types in TCGA (e.g., 10 instances of E121Q mutations are found in various H2As across all TCGA samples).
Differential gene expression and splice event analyses. For the purposes of differential analyses, a threshold of >1.5 TPM was used to determine whether H2A. B was expressed in a sample, whereas a threshold of <0.5 TPM was used to determine whether H2A.B was not expressed; samples with an intermediate expression of H2A.B were not used in differential analyses. Statistical significance in differential expression or splicing in H2A.B-positive versus H2A.B-negative cancer samples was determined with a Mann–Whitney U test, as implemented in wilcox.test in R.
Prediction of H2A variant candidate T-cell epitopes. The amino acid sequence of human H2A.B.1.1 (H2AFB2), H2A.B.1.2 (H2AFB3), H2A.B.2 (H2AFB1), H2A. Q, and H2A.P (HYPM) were examined for short peptides with the potential to bind to common HLA alleles34,35. Specifically, the NetPanMHCBA4.0 algorithm of the
Immune Epitope Database and Analysis Resource (IEDB) was used to identify peptides of 8, 9, 10, or 11 amino acids long that are predicted to bind with strong affinity (IC50 < 300 nM) to HLA-A*0101, A*0201, A*0301, A*1101, A*2402, B*0702, B*0801, B*1501, B*1502, B*4001, B*4002, B*4402 or B*4403. Additional IEDB algorithms were employed to confirm predicted HLA binding, whereby binding was predicted by NetPanMHCBA4.0 and at least one other method (including artificial neural network, stabilized matrix method, PickPocket and NetPanMHCBA4.0) was required for inclusion in Supplementary Table 5.
Reporting summary. Further information on research design is available in the Nature Research Reporting Summary linked to this article.
Data availability
All data sets used in this study are publicly available or previously published. RNA-seq reads from TCGA were downloaded from CGHub, but are now available from the NIH
NCI Genomic Data Commons [https://portal.gdc.cancer.gov/]. RNA-seq reads from B-ALL samples were obtained from the Japanese Genotype–Phenotype Archive (accession numberJGAS000047, this data set is available under restricted access and step by step instructions for obtaining access including Form 2 submission are available at [https://
humandbs.biosciencedbc.jp/en/data-use]. For questions regarding this data set, please
contact Dr. Hiroyuki Mano at hmano@m.u-tokyo.ac.jp)27. RNA-seq reads from B-ALL
samples were also obtained from the European Genome-phenome Archive (accession numberEGAD0000100211228, andEGAD00001002151)26, and the Chinese
Genotype–phenotype Archive (data are available under restricted access, access can be obtained by contacting Dr. Sai-Juan Chen: sjchen@stn.sh.cn)25. RNA-seq quantification
of CCLE cell lines were obtained from the Broad Institute CCLE Portal [https://portals.
broadinstitute.org/ccle/data] (02-Jan-2019 release). TCGA mutation data was obtained
through the GenomicDataCommons Bioconductor package. The remaining data are available within the Article, Supplementary Information or from the authors upon request.
Received: 17 September 2020; Accepted: 9 December 2020;
References
1. Luger, K., Mader, A. W., Richmond, R. K., Sargent, D. F. & Richmond, T. J. Crystal structure of the nucleosome core particle at 2.8 A resolution. Nature 389, 251–260 (1997).
2. Bennett, R. L. et al. A mutation in histone H2B represents a new class of oncogenic driver. Cancer Discov. 9, 1438–1451 (2019).
3. Nacev, B. A. et al. The expanding landscape of‘oncohistone’ mutations in human cancers. Nature 567, 473–478 (2019).
4. Lehnertz, B. et al. H3(K27M/I) mutations promote context-dependent transformation in acute myeloid leukemia with RUNX1 alterations. Blood 130, 2204–2214 (2017).
5. Lewis, P. W. et al. Inhibition of PRC2 activity by a gain-of-function H3 mutation found in pediatric glioblastoma. Science 340, 857–861 (2013). 6. Funato, K. & Tabar, V. Histone mutations in cancer. Annu. Rev. Cancer Biol.
2, 337–351 (2018).
7. Arimura, Y. et al. Cancer-associated mutations of histones H2B, H3.1 and H2A.Z.1 affect the structure and stability of the nucleosome. Nucleic Acids Res. 46, 10007–10018 (2018).
8. Molaro, A., Young, J. M. & Malik, H. S. Evolutionary origins and diversification of testis-specific short histone H2A variants in mammals. Genome Res. 28, 460–473 (2018).
9. Shaytan, A. K., Landsman, D. & Panchenko, A. R. Nucleosome adaptability conferred by sequence and structural variations in histone H2A-H2B dimers. Curr. Opin. Struct. Biol. 32, 48–57 (2015).
10. Govin, J. et al. Pericentric heterochromatin reprogramming by new histone variants during mouse spermiogenesis. J. Cell Biol. 176, 283–294 (2007). 11. Soboleva, T. A. et al. A unique H2A histone variant occupies the transcriptional
start site of active genes. Nat. Struct. Mol. Biol. 19, 25–30 (2011). 12. Jiang, X., Soboleva, T. A. & Tremethick, D. J. Short histone H2A variants:
small in stature but not in function. Cells 9, 867 (2020).
13. Kohestani, H. & Wereszczynski, J. Effects of H2A.B incorporation on nucleosome structures and dynamics. bioRxiv,https://doi.org/10.1101/ 2020.06.25.172130(2020).
14. Peng, J., Yuan, C., Hua, X. & Zhang, Z. Molecular mechanism of histone variant H2A.B on stability and assembly of nucleosome and chromatin structures. Epigenetics Chromatin 13, 28 (2020).
15. Bao, Y. et al. Nucleosomes containing the histone variant H2A.Bbd organize only 118 base pairs of DNA. EMBO J. 23, 3314–3324 (2004).
16. Doyen, C. M. et al. Dissection of the unusual structural and functional properties of the variant H2A.Bbd nucleosome. EMBO J. 25, 4234–4244 (2006).
17. Tolstorukov, M. Y. et al. Histone variant H2A.Bbd is associated with active transcription and mRNA processing in human cells. Mol. Cell 47, 596–607 (2012).
18. Anuar, N. D. et al. Gene editing of the multi-copy H2A.B gene and its importance for fertility. Genome Biol. 20, 23 (2019).
19. Soboleva, T. A. et al. A new link between transcriptional initiation and pre-mRNA splicing: the RNA binding histone variant H2A.B. PLoS Genet 13, e1006633 (2017).
20. Hoghoughi, N., Barral, S., Vargas, A., Rousseaux, S. & Khochbin, S. Histone variants: essential actors in male genome programming. J. Biochem. 163, 97–103 (2018).
21. Martire, S., Nguyen, J., Sundaresan, A. & Banaszynski, L. A. Differential contribution of p300 and CBP to regulatory element acetylation in mESCs. BMC Mol. Cell Biol. 21, 55 (2020).
22. Sansoni, V. et al. The histone variant H2A.Bbd is enriched at sites of DNA synthesis. Nucleic Acids Res. 42, 6405–6420 (2014).
23. Winkler, C. et al. Hodgkin’s lymphoma RNA-transfected dendritic cells induce cancer/testis antigen-specific immune responses. Cancer Immunol. Immunother. 61, 1769–1779 (2012).
24. Chapuy, B. et al. Molecular subtypes of diffuse large B cell lymphoma are associated with distinct pathogenic mechanisms and outcomes. Nat. Med. 24, 679–690 (2018).
25. Liu, Y. F. et al. Genomic profiling of adult and pediatric B-cell acute lymphoblastic leukemia. EBioMedicine 8, 173–183 (2016).
26. Qian, M. et al. Whole-transcriptome sequencing identifies a distinct subtype of acute lymphoblastic leukemia with predominant genomic abnormalities of EP300 and CREBBP. Genome Res. 27, 185–195 (2017).
27. Yasuda, T. et al. Recurrent DUX4 fusions in B cell acute lymphoblastic leukemia of adolescents and young adults. Nat. Genet. 48, 569–574 (2016). 28. Lilljebjorn, H. et al. Identification of ETV6-RUNX1-like and
DUX4-rearranged subtypes in paediatric B-cell precursor acute lymphoblastic leukaemia. Nat. Commun. 7, 11790 (2016).
29. Barretina, J. et al. The Cancer Cell Line Encyclopedia enables predictive modelling of anticancer drug sensitivity. Nature 483, 603–607 (2012). 30. Xu, J. et al. Free-living human cells reconfigure their chromosomes in the
evolution back to uni-cellularity. Elife 6 e2807 (2017).
31. Fratta, E. et al. The biology of cancer testis antigens: putative function, regulation and therapeutic potential. Mol. Oncol. 5, 164–182 (2011). 32. Whitehurst, A. W. Cause and consequence of cancer/testis antigen activation
in cancer. Annu Rev. Pharm. Toxicol. 54, 251–272 (2014).
33. Corces, M. R. et al. The chromatin accessibility landscape of primary human cancers. Science 362 eaav1898 (2018).
34. Lundegaard, C. et al. NetMHC-3.0: accurate web accessible predictions of human, mouse and monkey MHC class I affinities for peptides of length 8-11. Nucleic Acids Res. 36, W509–W512 (2008).
35. Nielsen, M. et al. Reliable prediction of T-cell epitopes using neural networks with novel sequence representations. Protein Sci. 12, 1007–1017 (2003).
36. Dvinge, H., Kim, E., Abdel-Wahab, O. & Bradley, R. K. RNA splicing factors as oncoproteins and tumour suppressors. Nat. Rev. Cancer 16, 413–430 (2016).
37. Piunti, A. et al. CATACOMB: An endogenous inducible gene that antagonizes H3K27 methylation activity of Polycomb repressive complex 2 via an H3K27M-like mechanism. Sci. Adv. 5, eaax2887 (2019).
38. Jain, S. U. et al. PFA ependymoma-associated protein EZHIP inhibits PRC2 activity through a H3 K27M-like mechanism. Nat. Commun. 10, 2146 (2019). 39. Sarthy, J. F., Henikoff, S. & Ahmad, K. Chromatin bottlenecks in cancer.
Trends Cancer 5, 183–194 (2019).
40. Jimeno-Gonzalez, S. et al. Defective histone supply causes changes in RNA polymerase II elongation rate and cotranscriptional pre-mRNA splicing. Proc. Natl Acad. Sci. USA 112, 14840–14845 (2015).
41. Thomas, J. D. et al. RNA isoform screens uncover the essentiality and tumor-suppressor activity of ultraconserved poison exons. Nat. Genet. 52, 84–94 (2020).
42. Koh, C. M. et al. MYC regulates the core pre-mRNA splicing machinery as an essential step in lymphomagenesis. Nature 523, 96–100 (2015).
43. Siam, A. et al. Regulation of alternative splicing by p300-mediated acetylation of splicing factors. RNA 25, 813–824 (2019).
44. Glaich, O., Leader, Y., Lev Maor, G. & Ast, G. Histone H1.5 binds over splice sites in chromatin and regulates alternative splicing. Nucleic Acids Res. 47, 6145–6159 (2019).
45. Behan, F. M. et al. Prioritization of cancer therapeutic targets using CRISPR-Cas9 screens. Nature 568, 511–516 (2019).
46. Shen, L., Zhang, J., Lee, H., Batista, M. T. & Johnston, S. A. RNA transcription and splicing errors as a source of cancer frameshift neoantigens for vaccines. Sci. Rep. 9, 14184 (2019).
47. Draizen, E. J. et al. HistoneDB 2.0: a histone database with variants–an integrated resource to explore histones and their variants. Database (Oxford) 2016, baw014(2016).
48. Katz, Y., Wang, E. T., Airoldi, E. M. & Burge, C. B. Analysis and design of RNA sequencing experiments for identifying isoform regulation. Nat. Methods 7, 1009–1015 (2010).
49. Li, B. & Dewey, C. N. RSEM: accurate transcript quantification from RNA-Seq data with or without a reference genome. BMC Bioinformatics 12, 323 (2011). 50. Langmead, B., Trapnell, C., Pop, M. & Salzberg, S. L. Ultrafast and memory-efficient alignment of short DNA sequences to the human genome. Genome Biol. 10, R25 (2009).
51. Trapnell, C., Pachter, L. & Salzberg, S. L. TopHat: discovering splice junctions with RNA-Seq. Bioinformatics 25, 1105–1111 (2009).
52. Meyer, L. R. et al. The UCSC Genome Browser database: extensions and updates 2013. Nucleic Acids Res. 41, D64–D69 (2013).
53. Flicek, P. et al. Ensembl 2013. Nucleic Acids Res. 41, D48–D55 (2013).
54. Robinson, M. D. & Oshlack, A. A scaling normalization method for differential expression analysis of RNA-seq data. Genome Biol. 11, R25 (2010). 55. Huber, W. et al. Orchestrating high-throughput genomic analysis with
Bioconductor. Nat. Methods 12, 115–121 (2015).
56. Wickham, H., Francois, R., Henry, L., Muller, K. dplyr: A G 0.7.6https:// CRAN.R-project.org/package=dplyr. (2018).
57. Wickham, H. ggplot2: Elegant Graphics for Data Analysis., (Springer-Verlag, New York, NY, 2016).
58. Cibulskis, K. et al. Sensitive detection of somatic point mutations in impure and heterogeneous cancer samples. Nat. Biotechnol. 31, 213–219 (2013). 59. Colaprico, A. et al. TCGAbiolinks: an R/Bioconductor package for integrative
analysis of TCGA data. Nucleic Acids Res. 44, e71 (2016).
Acknowledgements
We would like to thank R. Eisenman and members of the Malik, Henikoff, and Bradley labs for helpful discussions and comments on this manuscript. J.S. is supported by a Damon Runyon Cancer Research Foundation/Sohn Foundation Pediatric Cancer Research Fellowship, an Alex’s Lemonade Stand Foundation (ALSF) Young Investigator Award and a Northwestern Mutual/ALSF Award for Data Sharing. A.M. is supported by the Damon Runyon Cancer Research Foundation (DRG:2192-14) and by the NIH (R01 GM074108). G.-L.C. is a Mahan Fellow. M.B. is supported by a Stand Up To Cancer Innovative Research Grant, Grant Number SU2C-AACR-IRG 14-17. Stand Up To Cancer is a division of the Entertainment Industry Foundation. R.K.B. is a Scholar of The Leukemia and Lymphoma Society (1344-18). H.S.M. and S.H. are investigators of the Howard Hughes Medical Institute. The results shown here are in part based upon data generated by the TCGA Research Network:https://cancergenome.nih.gov/.
Author contributions
G.C., A.M., and J.S. designed the study and conceived the analyses. G.C., A.M., and M.B. performed the analyses. R.B., H.M., and S.H. provided guidance. A.M. and J.S. provided project leadership. G.C., A.M., and J.S. wrote the paper.
Competing interests
The authors declare no competing interests.
Additional information
Supplementary informationis available for this paper at
https://doi.org/10.1038/s41467-020-20707-x.
Correspondenceand requests for materials should be addressed to A.M. or J.S. Peer review informationNature Communications thanks the anonymous reviewers for their contribution to the peer review of this work. Peer reviewer reports are available. Reprints and permission informationis available athttp://www.nature.com/reprints
Publisher’s note Springer Nature remains neutral with regard to jurisdictional claims in published maps and institutional affiliations.
Open Access This article is licensed under a Creative Commons Attribution 4.0 International License, which permits use, sharing, adaptation, distribution and reproduction in any medium or format, as long as you give appropriate credit to the original author(s) and the source, provide a link to the Creative Commons license, and indicate if changes were made. The images or other third party material in this article are included in the article’s Creative Commons license, unless indicated otherwise in a credit line to the material. If material is not included in the article’s Creative Commons license and your intended use is not permitted by statutory regulation or exceeds the permitted use, you will need to obtain permission directly from the copyright holder. To view a copy of this license, visithttp://creativecommons.org/
licenses/by/4.0/.