HAL Id: hal-02664638
https://hal.inrae.fr/hal-02664638
Submitted on 31 May 2020
HAL is a multi-disciplinary open access
archive for the deposit and dissemination of
sci-entific research documents, whether they are
pub-lished or not. The documents may come from
teaching and research institutions in France or
abroad, or from public or private research centers.
L’archive ouverte pluridisciplinaire HAL, est
destinée au dépôt et à la diffusion de documents
scientifiques de niveau recherche, publiés ou non,
émanant des établissements d’enseignement et de
recherche français ou étrangers, des laboratoires
publics ou privés.
Genomic Consequences of Cytochrome P450 2C9
Overexpression in Human Hepatoma Cells
Céline Narjoz, Laetitia Marisa, Sandrine Imbeaud, Alain Paris, Hervé
Delacroix, Philippe Beaune, Isabelle (de Waziers
To cite this version:
Céline Narjoz, Laetitia Marisa, Sandrine Imbeaud, Alain Paris, Hervé Delacroix, et al.. Genomic
Consequences of Cytochrome P450 2C9 Overexpression in Human Hepatoma Cells. Chemical Research
in Toxicology, American Chemical Society, 2009, 22 (5), pp.779-787. �10.1021/tx800417u�.
�hal-02664638�
Chemical Profile
Genomic Consequences of Cytochrome P450 2C9 Overexpression in
Human Hepatoma Cells
Ce´line Narjoz,
†,‡Laetitia Marisa,
§Sandrine Imbeaud,
§Alain Paris,
|Herve´ Delacroix,
§Philippe Beaune,
†,‡and Isabelle De Waziers*
,†UniVersite´ Paris Descartes and INSERM UMR U775, Paris, APHP, Hoˆpital Europe´en Georges Pompidou, Laboratoire de Biochimie, Paris, Gif/Orsay DNA Microarray Platform (GODMAP), Centre de Ge´ne´tique,
Mole´culaire, UPR 2167, Centre National de la Recherche, Scientifique, 91198 Gif-sur-YVette, UniVersite´ Paris-Sud 11, 91405 Orsay, and UMR 1089, Xe´nobiotiques, INRA/ENVT, 180 ch. de Tournefeuille,
BP 3, 31931 Toulouse Cedex 9, France ReceiVed NoVember 7, 2008
Cytochrome P450 2C9 (P450 2C9) is one of the most important P450 isoforms in the human liver, as it metabolizes numerous exogenous and endogenous substrates. Moreover, it is inducible by several compounds, such as rifampicin, phenobarbital, and NSAIDs (nonsteroidal anti-inflammatories). The aim of this study was to investigate the global cellular consequences of P450 2C9 overexpression at the transcriptional level using an untargeted approach: pangenomic microarrays. Recombinant adenovirus was used to express P450 2C9 instead of an inducer to prevent a per se effect of inducer or its metabolites. P450 2C9 overexpression induced endoplasmic reticulum (ER) stress and regulated genes implicated in the unfolded protein response (UPR) as heat shock protein (HSP) (we studied particurlarly HSPA5 and HSPB1) and in the endoplasmic reticulum associated degradation (ERAD) system as Sec61 and ubiquitin and proteasome pathways. UPR and ERAD are two mechanisms of adaptative response to ER stress. Moreover, activation of Akt was observed in HepG2 cells that overexpress P450 2C9 and might participate in the cellular adaptive response to stress, thus leading to the activation of cell survival pathways. UPR and ERAD should be caused by accumulation of native and misfolded P450 2C9 protein. Our results indicated that P450 2C9 overexpression did not lead to toxicity but induced an ER stress due to protein overexpression rather than mono-oxygenase activity. The ER stress triggered activation of the adaptative response and of pathways leading to cell survival.
Introduction
The cytochrome P450 (P450) family consists of a superfamily of heme proteins that are located on the membrane of the endoplasmic reticulum (ER).1 The 57 human isoforms are
classified into families (designated by an Arabic numeral) and subfamilies (designated by a letter) according to the amino acid sequence similarity of the encoded proteins. P450s cata-lyze monooxygenase reactions that mediate xenobiotic (http:// drnelson.utmem.edu/human.genecount.html) and endogenous compounds metabolism. P450 families 1-3 are mainly involved in the metabolism of xenobiotics such as drugs, smoke compounds, atmospheric pollutants, and dietary compounds and play an important role in the cellular metabolism of these xenobiotics. P450s are also involved in the biosynthesis or
catabolism of cholesterol, vitamins, and steroids. P450s are highly inducible enzymes, and pathophysiological or drug treatments have all been shown to modify the expression levels of human P450s (1, 2).
There is accumulating evidence that indicates that P450 2C9 is one of the most important P450 isoforms present in human liver (accounting for about 25% of the P450s expressed in it). Substrates for P450 2C9 include about 10-15% of all drugs (3, 4), including fluoxetine, losartan, phenytoin, tolbutamide, torsemide, S-warfarin, a number of nonsteroidal anti-inflammatory drugs (NSAIDs) (5, 6), and tienilic acid, which is involved in severe hepatotoxicity (7). P450 2C9 also catalyzes the metabolism of endogenous substrates, such as arachidonate and linoleate epoxygenase in human liver microsomes (8), and the products of this epoxidation reaction may regulate physiopathological phenomena (9). P450 2C9 is known to be highly inducible by rifampicin, carbamazepine, phenobarbital, and linoleic acid in vascular endothelial cells (10), and several regulatory sequences have been identified within the P450 2C9 promoter (HNF4R, GRE, CAR, and PXR) (11–13). Therefore, P450 2C9 expression is subject to complex control mechanisms, allowing great variability in P450 2C9 expression levels to be achieved.
The aim of our study was to investigate the global cellular consequences of P450 2C9 overexpression at the transcriptional
* To whom correspondence should be addressed. E-mail: isabelle.waziers@ univ-paris5.fr.
†Universite´ Paris Descartes and INSERM UMR U775. ‡APHP.
§Gif/Orsay DNA Microarray Platform (GODMAP). |UMR 1089.
1Abbreviations: Ad, adenovirus; MTT, 3-(4,5-dimehtylthiazol-2yl)2,5-diphenyltetrazolium bromide; PLS-DA, partial least-squares with discrimi-nant analysis; HSP, heat shock protein; UPR, unfolded protein response; ER, endoplasmic reticulum; ERAD, endoplasmic reticulum associated degradation.
10.1021/tx800417u CCC: $40.75 2009 American Chemical Society Published on Web 04/09/2009
level in HepG2 cells, which are derived from a human hepatoma and retain several hepatic functions (14). This cell line constitutes a valuable model, largely used in toxicology (15) to study the mechanisms of drugs (16) and gene expression and transcription (17). Understanding the genes regulated by P450 2C9 and their potential role in physiological and pathological processes may lead to a better understanding of the conse-quences of exposure to P450 2C9 inducers. Effects of P450 inducers have been studied in different cell models; however, these inducers have their own effects and often alter the expression of several P450s. Our goal was to study the specific effect of P450 2C9 overexpression. P450 2C9 was overexpressed in HepG2 cells using an adenovirus (Ad) vector (Ad-2C9), and HepG2 cells were also infected with a recombinant Ad coding
β-galactosidase (Ad-LacZ) as a control. A pan-genomic gene
expression profiling approach using microarray technology allowed us to compare global transcriptional patterns in HepG2 cells infected with either Ad-2C9 or Ad-LacZ. Our results indicated that P450 2C9 overexpression did not lead to toxicity but induced ER stress that triggered the activation of pathways leading to cell survival.
Experimental Procedures
Cell Lines. The human hepatoma cell line (HepG2) was grown
in minimal essential medium containing 10% fetal bovine serum (FBS) and supplemented with penicillin (200 UI/mL), streptomycin (50 µg/mL),L-glutamine (0.3 mg/mL), sodium pyruvate (1 mM),
and fungizone (0.5 µg/mL).
Recombinant Ad. The coding sequence of P450 2C9 was cloned
in our laboratory (18). The recombinant Ad Ad-2C9 and Ad-LacZ was performed by the university Hospital of Nantes [supported by the Association Franc¸aise contre les Myopathies (AFM)] (19).
Adenoviral Infection. HepG2 cells were seeded at 106cells/10
cm plate. Twenty-four hours later, the cells were incubated for 4 h with Ad at a concentration of 290 multiplicity of infection (MOI), in cell culture medium containing 2% FBS. This concentration of Ad was sufficient to infect over 90% of the cells (20). After 4 h, the Ad-containing medium was removed and replaced with normal HepG2 medium. Up until 4 days after infection, P450 2C9 expression was measured at the mRNA level using quantitative real-time polymerase chain reaction (RT-PCR) with specific primers (21) and also at the protein level by Western blotting with a polyclonal anti-P450 2C9 antibody (18).
Enzymatic Assay. The P450 2C9 activity was measured using
the P450-GloCYP2C9 assay kit (Promega, Charbonnie`res les Bains, France) (22). This assay employs luciferin H, which is specifically converted by P450 2C9 to luciferin. This in turn reacts with luciferase, and the quantity of light produced is directly proportional to P450 2C9 activity. Luciferin H metabolism was assessed by measurement of luciferase activity according to the manufacturer’s instructions either directly in cell cultures (a) or in cell microsomes (b). (a) HepG2 cells were infected in six well plates at 4 × 10⁵
cells/well with Ad, as described above. Cells were then trypsinized and seeded into 96 well plates at 3× 10⁴cells/well in triplicate.
Cells infected with Ad-LacZ were used as controls. The P450 2C9 activity was evaluated 2-4 days after infection. One hundred micromoles of luciferin H was added to the culture medium, the cells were incubated at 37°C for 4 h, and then, 50 µL of luciferin detection reagent was added to 50 µL of cell culture medium containing luciferin H. Luminescence was recorded 30 min later using a Lumat LB 9507 luminometer (Berthold, Thoiry, France). The results are expressed as relative light units (RLUs). (b) HepG2 cells were infected in 10 cm plates seeded at 106cells and infected
by the Ad as previously described. Cells were trypsinized, and microsomal fractions were obtained by differential centrifugations. The luciferase activity was measured according to the manufac-turer’s instructions using luciferin as a standard. Then, results were
expressed as nmole of luciferin/min/mg of microsomal protein and compared to the activity measured in a pool of liver microsomes.
Quantitative RT-PCR Analysis. Reverse transcription was
performed with a high-capacity cDNA archive kit (Applied systems, Villebon sur Yvette, France), using 2.5 µg of total RNA in a final volume of 25 µL. Analysis of the expression pattern of P450 mRNA isoforms in HepG2 cells was performed as previously described (21) using TATA Binding Protein (TBP), a component of the DNA-binding protein complex TFIID, as an endogenous control (Ct ) 25). Expression patterns were assessed in infected cells and noninfected cells. The sequences of the primers used were as follows: TBP forward 5′-TGCACAGGAGCCAAGAGTGAA-3′ and TBP reverse 5′-CA-CATCACAGCTCCCCACCA-3′ (23). The P450 2C9, P450 2C19, and P450 2S1 nucleotide primer pairs are available from Biopredic International (Rennes, France) (http://www.biopredic.com). Each sample was normalized on the basis of its TBP mRNA content. Specificity and efficiency of CYPC9, CYP2C19, CYP2S1, and TBP were performed in a previous work (21). The mRNA expression of selected genes (n ) 14) and of negative control genes (n ) 5) was also analyzed by Q-PCR using a Taqman low density MicroFluidic card (Applied Biosystems, Foster City, CA), according to the manufacturer’s instructions.
Gene Expression Profiling. Total RNA was extracted using the
RNeasy midi kit and subjected to RNase-free DNase I treatment (Qiagen, Courtaboeuf, France) following the manufacturer’s pro-tocols. The yield and purity of total RNA were assessed by UV measurement using the NanoDrop ND-1000 spectrophotometer (Nanodrop Technologies, Inc., Rockland, ME). The total RNA integrity was evaluated on the 2100 Bioanalyzer (Agilent Technolo-gies, Massy, France).
First strand cDNA was synthesized from 10 µg of total RNA using a SuperScript Indirect cDNA labeling Kit (Invitrogen, Cergy-Pontoise, France) labeled with cyanine 3-dCTP (Cy3) (Amersham Biosciences) and Human Universal Reference Total RNA (Ozyme, Mountain View, United States) labeled with cyanine 5-dCTP (Cy5) (Amersham Biosciences). The quality of the fluorescent dye-labeled cDNAs was checked on a 1.2% agarose gel. To ensure robustness and flexibility in data analysis, a Universal Reference Total RNA, which operates as a baseline for comparisons between different samples, was used. Each Agilent 22K Human 1A (v2) oligo microarray was hybridized with 200 ng of Cy3-labeled cDNA (sample) and 200 ng of Cy5-labeled cDNA (reference) using the in situ Hybridization Kit Plus protocol (Agilent, Santa Clara, CA). Hybridizations were performed for 17 h at 65 °C in a rotating hybridization oven (Agilent Technologies). After hybridization, the slides were washed according to the manufacturer’s wash procedure and scanned using a Genepix 4000B with two Axon lasers to excite Cy3 and Cy5. Images were acquired at a resolution of 10 µm, and the PMT voltage (CY5 680V and Cy3 560 to 580V) was manually adjusted to balance the distribution of the red and green intensities. Images were then analyzed using GenePix Pro 6.0. software (Molecular Devices Corporation, Sunnyvale, CA). Data were processed using the MAnGO (Microarray Analysis at the Gif/Orsay platform) tool suite, which is an R script that allows for the integrated analysis of two-color microarrays (http://bioinfome.cgm. cnrs-gif.fr) (24). The raw data were normalized using the robust-spline method (25), that is, a function that uses an idea similar to print-tip Loess normalization but uses regression splines in place of the Loess curves. Negative controls (1080 genes) and spots with Ameanvalues {Amean) mean[log 2(red × green)/2]} below 7.0 (9828
genes) were excluded from subsequent analysis.
Analysis of Microarrays. Statistical Analysis To Identify Differentially Expressed Genes: Student’s Test. Statistically
significant differential gene expression was measured using moder-ated t statistics performed in the Limma software package (26), which was carried out in the R software environment. Significant regulation of gene expression was defined using the following criteria: a p value<0.05 and 1.5-fold change.
Classification of Genes. Networks associated with these gene
expression changes were defined according to Calvano (27) using the Ingenuity Pathways Analysis (IPA) 5.0 software (Ingenuity Systems;
Mountain View, CA; http://www.ingenuity.com), a commercial da-tabase containing manually annotated data for human protein-protein and functional interactions derived from the literature.
A data set containing gene RefSeq entries and corresponding expression values was uploaded into the application. Each gene identifier was mapped to its corresponding gene object in the Ingenuity Pathways Knowledge Base (IPKB, Ingenuity Systems). The information contained in the IPKB is derived from the scientific literature, and each connection in a network is supported by one or more publications. The genes that could be mapped to genetic networks available in the Ingenuity database, known as “focus genes”, were overlaid onto a global molecular network developed from information contained in the IPKB. Networks of these focus genes were algorithmically generated based on their connectivity and were then ranked by score. The score is the probability that a collection of genes equal to or greater than the number in a network could be achieved by chance alone. In the current study, scores of 20 or higher were used to select highly significant biological networks.
Western Blots. S9, microsomal, or cytosolic fractions (10-40
µg) were subjected to electrophoresis on a SDS-polyacrylamide gel. The proteins were transferred to a nitrocellulose membrane, blocked with polyvinyl-pyrrolidone, and probed with various antibodies: polyclonal anti-P450 2C9 (18), anti-HSPA1 (Aviva system Biology, San Diego, CA), anti-HSPB1 (Aviva system biology), anti-HSPA5 (Santa cruz, Bergheimer, Germany), antiactin
(Sigma, Lyon, France), and anti-Akt antiphospho Akt (cell signal-ing). After the membranes were washed, a secondary antibody linked to horseradish peroxidase was used for detection, and the membranes were developed using an ECL detection kit (Amer-sham).
Results
P450 2C9 Expression (Figure 1). P450 2C9 expression was
obtained by infecting HepG2 cells with a recombinant Ad Ad-2C9, and Ad-lacZ was used as a control. P450 2C9 expression was checked at the mRNA level by quantitative RT-PCR (Figure 1A), at the protein level by Western blotting (Figure 1B), and by measuring the luciferin H hydroxylase activity (22), which is a specific P450 2C9-dependent catalytic activity (Figure 1C). In noninfected HepG2 cells and in cells infected with Ad-LacZ, the endogenous control gene (TBP) was expressed at the same level (Ct ) 25), P450 2C9 mRNA was always below the limit of quantification (Ct > 30), P450 2C9 was undetectable by Western blotting, and the luciferin H hydroxylase activity was also below the limit of detection. In HepG2 cells infected with Ad-2C9, P450 2C9 mRNA was expressed at very high levels (Ct ) 12-13) from the first day after the infection to at least 4 days after infection. The P450 2C9 protein was detectable by
Figure 1. Expression of P450 2C9 in HepG2 cells infected with a recombinant Ad (Ad-2C9). HepG2 cells infected with Ad-LacZ were used as a
control. (A) P450 2C9 mRNA expression was measured by quantitative RT-PCR. (B) Western blotting was performed using 10 µg of microsomal proteins (HepG2, HepG2 Ad-LacZ, HepG2 Ad-2C9, and human liver) and a polyclonal rabbit antihuman P450 2C9 and antihuman Actin antibodies. P450 2C9 protein relative quantification in HepG2 Ad-2C9 and human liver was performed using Image J. (C) The luciferin H hydroxylase activity was measured directly in cell cultures (HepG2 Ad-LacZ and HepG2 Ad-2C9) using a P450 TM-GloCYP2C9 assay (Promega). The results are the means ( SDs of two independent experiments, and each measurement was performed in triplicate. (D) The luciferin H hydroxylase activity was measured in HepG2 Ad-LacZ, HepG2 Ad-2C9, and human liver microsomes using a P450 TM-GloCYP2C9 assay (Promega). The results are means ( SDs of three independent experiments, and each measurement was performed in duplicate.
Western blotting the day after infection and reached a maximum about 72 h after infection (Figure 1B); this pattern was also observed for the luciferin H hydroxylase activity (Figure 1C). Given that the maximum expression of protein P450 2C9 occurred 3 days after infection, DNA microarray analysis was performed at this time point to investigate the consequences of P450 2C9 overexpression upon gene expression. Three days after infection, the level of P450 2C9 protein detected in Western blotting was equal in human liver microsomes (D.O. P450 2C9/ D.O. actin ) 0.787 ( 0.285; n ) 7) and in HepG2 Ad-2C9 (D.O. P450 2C9/D.O. actin ) 0.852 ( 0.180; n ) 7) (Figure 1B), but the luciferin H hydrolase activity was about 40 times higher in human liver microsomes pool than in HepG2 Ad-2C9 (Figure 1D). In sum, after infection with a P450 Ad-2C9 recombinant-Ad, the HepG2 cells expressed an active form of P450 2C9 for at least 4 days.
Gene Expression Profiling. Identification of Modulation of Gene Expression by t Statistic Analysis. Differentially
expressed genes were identified using a modified parametric Student’s t-test. A significant change in expression was deter-mined by the following criteria: p< 0.05 and a 1.5-fold change.
Effects of Ad-LacZ Infection. Ad-LacZ was used as an
infection control. Only four genes were differentially expressed in HepG2 Ad-LacZ as compared to uninfected HepG2 cells (Supporting Information, Table 1). Two genes were up-regulated (AQP1 and PSEN1), and two genes were down-regulated (TGFBR3 and AK3L1). The number and functions of regulated genes demonstrated that LacZ Ad infection had only a poor effect on HepG2 cells.
Effects of P450 2C9 Overexpression Assessed by Oligo-nucleotide Expression Arrays. Before each experiment, the
luciferin H hydroxylase activity was measured to ensure that P450 2C9 was actually expressed in the infected HepG2 cells. Among the 11245 genes expressed in HepG2 cells, 154 were differentially expressed (ratio g (1.5, p < 0.05) in cells infected with Ad-2C9 as compared to cells infected with Ad-LacZ (Supporting Information, Table 2): 134 genes were up-regulated, and 20 were down-regulated. Surprisingly, in the microarray analysis, up-regulation of P450 2C9 mRNA was not observed in HepG2 Ad-2C9 cells, whereas an increase in P450 2C19 mRNA expression was detected. The Ad-2C9 only expressed a coding sequence of this mRNA. The DNA oligoprobe spotted on microarrays for this transcript was designed for the 5 ′-untranslated P450 2C9 mRNA, which prevented hybridization with the mRNA produced by Ad-2C9. However, the P450 2C19 DNA oligoprobe spotted on the microarrays was localized to the coding region of this transcript and was 96% homologous to the P450 2C9 sequence, thus explaining the observed results. RT-PCR analysis confirmed that P450 2C9 mRNA was over-expressed in HepG2 Ad-2C9 cells, whereas P450 2C19 expres-sion was undetectable. However, these results are due to a lack of specificity of some oligoprobes, especially for genes with high degrees of sequence homology.
Functional classification of the 154 genes regulated by P450 2C9 ovexpression was performed using the David bioinformatics database (http://david.abcc.ncifcrf.gov). P450 2C9 overexpres-sion had effects on a number of genes, particularly those involved in protein metabolism (n ) 46) (chaperones, ubiquitin-proteasome proteins) (Table 1), cell growth (n ) 23), metabo-lism (n ) 19), and signal transduction (n ) 15).
Identification of Gene Networks Affected by P450 2C9 Overexpression. The 154 differentially expressed genes were
mainly associated with six different networks in the IPA database. The scores for all of the mapped networks were higher
than 20, indicating that the networks selected were not randomly selected. Several significant pathways were recognized for the genes that were either up- or down-regulated.
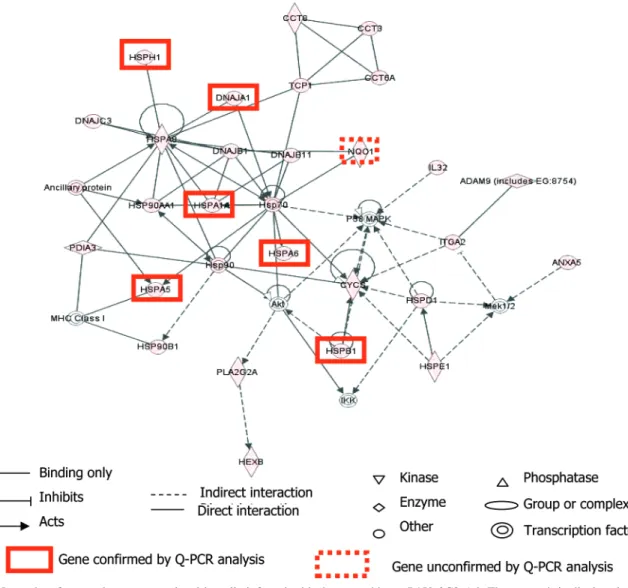
The top-scoring network (Figure 2, score 53, and 27 genes up-regulated) was centered by significantly up-regulated chap-erone proteins (HSP90AA1, HSP90B1, HSPA5, HSPA6, HSPA8, HSPA1A, HSPB1, HSPD1, HSPE1, and HSPH1). The score indicates that the likelihood of the focus genes to be found in this network together due to random chance was less than 10-53. This network includes genes involved in cellular function and maintenance, the ER stress response (1.46× 10⁻⁸< p < 1.79 × 10⁻⁸) and oxidative stress responses (p ) 0.00169), and
post-translational modifications, folding or refolding proteins (8.11 × 10⁻⁸< p < 8.24 × 10⁻³). The Akt and P38 MAPK kinase
complexes appeared to be involved in this network. Their transcription was not regulated, but these complexes were activated by phosphorylation (see below).
While the networks consider all possible interactions, canoni-cal pathway analysis queries genes in predefined and well-characterized biological pathways. Using a canonical pathway analysis, the two pathways that were most significantly associ-ated with P450 2C9 overexpression were the ER stress (p ) 9.44× 10⁻³) and protein ubiquitination pathways (2.68× 10⁻⁷) (data not shown). These two approaches emphasized the role of two pathways involving protein metabolism and degradation with ubiquitin-proteasome pathways and ER stress.
Confirmation of Microarrays Results by Quantitative RT-PCR. The results obtained with microarrays were checked
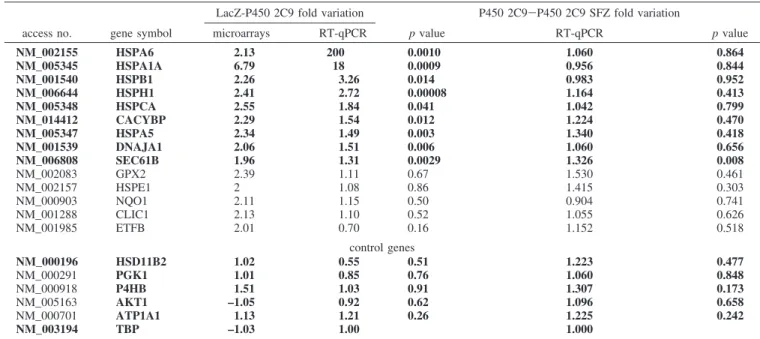
by quantitative RT-PCR using a Taqman low density microf-luidic card. Fourteen genes were selected, and these represented the genes that were most differentially expressed between HepG2 Ad-2C9 cells and HepG2 Ad-LacZ cells (ratio g (2, p < 0,01). These genes, which are presented in Table 2, are involved in protein metabolism (HSPA1A, HSPB1, HSPA5, HSPA6, DNAJA1, HSPH1, HSPCA, HSPE1, CACYBP, and Sec61B), protein transport (CLIC1), and metabolism and energy pathways (ETFB, GPX2, and NQO1). Six of them (HSPA1A, HSPB1, HSPA5, DNAJA1, HSPH1, and HSPCA) were included with the first network. Moreover, five supplementary genes that were expressed at the same levels in cells infected by Ad-2C9 and Ad-LacZ and participated in the same cellular functions as our 14 selected genes were analyzed as negative controls [P4HB (protein metabolism), HSD11B2 and GK1 (metabolism and energy pathways), ATP1A1 (transport), and AKT1 (signal transduction)]. Each sample was normalized on the basis of its TBP (Ct ) 25) mRNA content (23).
From the total RNA preparations used for microarray analysis, quantitative RT-PCR results confirmed that P450 2C9 overex-pression modified the exoverex-pression of 12 out of the 14 selected genes (86%) and did not affect the expression of any of the five control genes. These results were similar for the RT-PCR and microarray analyses for 17 of the 19 genes tested. Five additional cultures were used for independent biological valida-tion of the microfluidic cards, and 14 (nine genes regulated by P450 2C9 overexpression and five control genes) of the 19 genes tested (74%) behaved in a similar manner to the first set of experiments (in bold in Table 2). Of these genes, six encode chaperone proteins. The regulation of genes involved in oxida-tive metabolism (GPX2 and NQO1) and an HSP (HSPE1) was not confirmed in these supplementary experiments.
Furthermore, the RT-PCR-based P450 mRNA assays allowed us to study simultaneously the expression profiles of the human 23 P450 mRNAs belonging to P450 families 1-3 (21). P450 2C9 mRNA overexpression was confirmed in cells infected with
Ad-2C9. However, in contrast to the results that were observed using a microarray analysis, P450 2C19 mRNA expression was not modified by P450 2C9 overexpression, whereas P450 2S1 was up-regulated (2.7-fold). No significant differences in the levels of mRNA expression of the other P450s were observed in HepG2 cells infected with Ad-LacZ or Ad-2C9.
Effects of P450 2C9 Overexpression at the Protein Level. Because changes in mRNA levels do not necessarily
represent changes in protein expression, we analyzed whether the changes in gene expression detected in the microarray analysis correlated with the expression of selected gene products. Of the nine genes whose mRNA expression was significantly modified by P450 2C9 overexpression, there were commercially available antibodies directed against the proteins encoded by three of the genes. In addition, a polyclonal antibody directed against P450 2C9 had previously been produced in our laboratory (18). HSPA5 and P450 2C9 are expressed in the ER, whereas HSPA1A and HSPB1 are cytosolic proteins. Actin was used as a loading control. Western blot analysis indicated that P450 2C9 was overexpressed in cells infected by Ad-2C9 when compared with cells infected with Ad-LacZ (Figures 1B and 3A). P450 2C9 overexpression increased the levels of HSPB1 and HSPA5 protein expression, whereas HSPA1A protein expression was decreased.
To further validate the network (figure 2), the phosphorylation level of Akt was analyzed, since this protein would be expected
to be modified at the post-translational level. Phosphorylation of Akt at Thr308 and Ser473 leads to full activation of Akt. Figure 4 shows that there was a detectable increase in phospho-Akt (at the Ser473 residue) in HepG2 Ad-2C9 cells as compared with HepG2 Ad-LacZ; however, the total Akt levels remained relatively constant. The levels of phosphorylated Akt in HepG2 Ad-2C9 were at a maximum 24 h after infection. These findings confirmed that the Akt signaling pathway was activated upon P450 2C9 overexpression, as predicted by the first network. In our study, we observed an increase in the levels of phospho-Akt in the microsomal fraction of HepG2 Ad-2C9 cells as compared to those in the microsomal fraction of HepG2 Ad-LacZ cells. However, phospho-Akt was not detected in the microsomal fraction of noninfected HepG2 cells or in the pool of microsomes present in the human liver.
Effects of Sulfaphenazole on Genes Regulated by P450 2C9 Overexpression. Sulfaphenazole is a specific competitive
inhibitor of P450 2C9 (28). Four hours after cell infection, the cells were treated with 100 µM sulfaphenazole for 3 days. At 72 h, we checked that sulfaphenazole abolished luciferin H hydroxylase (Figure 5C) without modifying either P450 2C9 mRNA (Figure 5A) or protein expression (Figure 5B). In cells infected with either Ad-2C9 or Ad-LacZ, no effect upon the mRNA expression of the 14 selected genes was observed after sulfaphenazole treatment (Table 2). Likewise, the induction of P450 2S1 and the mRNA levels of control genes remained stable
Table 1. Genes of Protein Metabolism Induced in HepG2 Overexpressing P450 2C9a
Protein Metabolism (43) (30%)
NM_002047 (GARS) glycyl-tRNA synthetase 1.65 9.1 112E-04
NM_004318 (ASPH) aspartate β-hydroxylase 1.74 7.7 348E-04
NM_002131 (HMGA1) high mobility groupAT-hook1 2.44 8.3 350E-06 NM_003135 (SRP19) signal recognition particle 19 kDa 1.59 7.9 307E-04 NM_001969 (EIF5) eukaryotic translation initiation factor 5 1.67 9.0 221E-04 NM_005313 (GRP58) glucose related protein, 58 kDa 1.7 9.1 151E-04 NM_000935 (PLOD2) procollagen-lysine, 2-oxoglutarate 5-dioxygenase (lysine hydroxylase) 2 1.91 7.9 272E-04 NM_003816 (ADAM9) A disintegrin and metalloproteinase domain 9 (meltrin γ) 1.58 7.2 584E-05 NM_006216 (SERPINE2) serine proteinase inhibitor, clade, member 2 1.84 7.4 373E-05 NM_006335 (TIMM17A) translocase of inner mitochondrial membrane 17 homologue A (yeast) 1.5 7.7 676E-05 NM_015920 (RPS27L) ribosomal protein S27-like 1.72 8.8 153E-05
NM_014412 (CACYBP) calcyclin binding protein 2.29 8.4 200E-07
NM_016106 (SCFD1) sec61 family domain containing 1 1.65 8.1 302E-04
NM_006808 (sec 61B) sec61 β subunit 1.96 8.8 400E-07
NM_0014302 (SEC61G) sec61 γ subunit 1.74 8.6 956E-05
NM_000942 (PPIB) cyclophilin B 1.54 9.4 287E-04
Chaperone Activity
NM_006585 (CCT8) chaperonin containing TCP1, subunit 8 (θ) 1.58 8.7 220E-06 NM_001762 (CCT6A) chaperonin containing TCP1, subunit 6A (ζ 1) 1.61 8.6 202E-04 NM_005998 (CCT3) chaperonin containing TCP1, subunit 3 (γ) 1.61 8.9 215E-05
NM_030752 (TCP1) t-complex 1 1.84 9.1 110E-06
NM_002157 (HSPE1) heat shock 10 kDa protein 1 2 9.9 197E-05
NM_001540 (HSPB1) heat shock 27 kDa protein 1 2.26 10.0 762E-05 NM_002156 (HSPD1) heat shock 60 kDa protein 1 (chaperonin) 1.87 10.2 449E-04 NM_006597 (HSPA8) heat shock 70 kDa protein 8 1.94 9.9 111E-04 NM_005345 (HSPA1A) heat shock 70 kDa protein 1A 6.79 8.7 100E-07 NM_005347 (HSPA5) heat shock 70 kDa protein 5 (glucose-related protein 78 kDa) 2.34 10.6 290E-06 NM_002155 (HSPA6) heat shock 70 kDa protein 6 2.13 7.1 992E-05 NM_005348 (HSPCA) heat shock 90 kDa protein 1, R 2.55 9.1 420E-06 NM_006644 (HSPH1) heat shock 105 kDa/110 kDa protein 2.41 8.8 338E-05 NM_001539 (DNJA1) DnaJ (Hsp40) homologue, subfamily A, member 1 2.06 8.8 220E-06 NM_006145 (DNAJB1) DnaJ (Hsp40) homologue, subfamily B, member 1 1.94 7.5 323E-05 NM_016306 (DNAJB11) DnaJ (Hsp40) homologue, subfamily B, member 11 1.76 7.8 278E-05 NM_006260 (DNAJC3) DnaJ (Hsp40) homologue, subfamily C, member 3 1.5 7.8 392E-04
NM_003299 (GRP94) tumor rejection antigen 1 1.89 9.8 740E-06
Ubiquitin Proteasome System Protein
NM_148976 (PSMA1) proteasome (prosome, macropain) subunit, R type, 1 1.58 8.2 398E-05 NM_002790 (PSMA5) proteasome (prosome, macropain) subunit, R type, 5 1.61 8.0 329E-05 NM_152255 (PSMA7) proteasome (prosome, macropain) subunit, R type, 7 1.82 10.0 298E-04 NM_002793 (PSMB1) proteasome (prosome, macropain) subunit, β type, 1 1.5 9.1 318E-04 NM_002796 (PSMB4) proteasome (prosome, macropain) subunit, β type, 4 1.56 8.7 289E-04 NM_002799 (PSMB7) proteasome (prosome, macropain) subunit, β type, 7 1.58 8.3 424E-05 NM_002808 (PSMD2) proteasome (prosome, macropain) 26S subunit 1.59 8.0 126E-04
NM_021009 (UBC) ubiquitin C 1.7 10.7 297E-04
NM_018955 (UBB) ubiquitin B 1.86 12.7 787E-05
aThe expression of genes in HepG2 Ad-LacZ and HepG2 Ad-2C9 cells was compared. Significant changes in the levels of gene expression were
determined using a modified Student’s t test and the following criteria: p < 0.05 and a 1.5-fold change. One hundred thirty-four genes were up-regulated, and 20 were down-regulated; genes involved in protein metabolism represent 30% of the up-regulated genes.
in the HepG2 Ad-LacZ and HepG2 Ad-2C9 treated with sulfaphenazole. Therefore, inhibition of P450 2C9 catalytic activity did not interfere with any of the effects of P450 2C9 overexpression. In conclusion, the transcriptional modifications observed in HepG2 Ad-2C9 cells were not linked to the catalytic activity of P450 2C9 but were associated to overexpression of the P450 2C9 protein.
Discussion
Infection with Ad-2C9 allowed us to express an active form of the P450 2C9 protein in HepG2 cells which do not usually express it (Figure 1). In our untargeted study, molecular signatures of gene expression in response to P450 2C9 over-expression were obtained using pangenomic human microarrays. Ad-LacZ was used as an infection control because adenoviral infection per se may modify gene expression. Our study showed that infection of HepG2 by Ad-LacZ has a very limited impact on global cellular gene expression. Partial least-squares with discriminant analysis (PLS-DA) showed that HepG2 and HepG2 Ad-LacZ were grouped within the same area, meaning that very few genes were modified by this control infection in our model (Supporting Information, Figure 1 and Table 1). No differential transcription of genes involved in the innate and inflammatory host immune responses was observed, contrary to previous
results obtained with Ad-GFP infection of an immortalized human mammary epithelial HB2 cell line (29). However, it is known that the innate and inflammatory host responses are dependent on the dose of Ad (30), and in our current study, cells were infected with 290 MOI vs the 10000 MOI used in Scibetta’s study. In agreement with our results, a previous study concluded that the expression of β-galactosidase had only minor effects on hepatocyte biochemical functions (31).
A modified Student’s t test showed that 155 genes were significantly altered by P450 2C9 overexpression (Supporting Information, Table 2). Functional classification of the regulated genes showed that the selected genes were mainly involved in protein metabolism (Table 1). These results are consistent with those obtained in rabbit P450 2C2 overexpression (32).
The combination of statistical test PLS-DA, t test, and an in silico genomics network analysis (Figure 2) revealed that heat shock proteins (HSP) are affected by overexpression of P450 2C9. The five families of HSP were all represented among the genes that were significantly up-regulated in response to P450 2C9 overexpression. Induction of HSP and particularly of HSPA5 (BIP or HSP78) is a marker of unfolded protein response (UPR) (33, 34). Induction of HSPA5 in cells expressing P450 2C9 was observed at both mRNA (Table 2) and protein levels (Figure 3) in accordance with the results found for HepG2 expressing P450 2C2 (32).
Figure 2. Networks of genes that were regulated in cells infected with the recombinant P450 2C9 Ad. The network is displayed graphically as
nodes (genes/gene products) and edges (the biological relationships between the nodes). Up-regulated genes are shaded red; the intensity of the node color indicates the degree of regulation. Nodes are displayed using various shapes that represent the functional classes of the gene products.
We observed by immunoblot that the amount of P450 2C9 in HepG2 cells infected by Ad-2C9 was comparable to that measured in a pool of human liver microsomes (ratio P450 2C9 protein expression, in HepG2 Ad-2C9/in human liver ) 0.924) (Figure 1B). However, the enzymatic activity of P450 2C9 (luciferin-H hydroxylase) was about 40-fold lower in HepG2 Ad-2C9 microsomes than in human liver microsomes (Figure 1D), leading us to suppose that most of P450 2C9 protein in HepG2 Ad-2C9 was misfolded or damaged and therefore inactive. Moreover, the induction of these HSP proteins was not dependent upon P450 2C9 catalytic activity (Table 2) but was the consequence of P450 2C9 protein overproduction in
HepG2 cells. The system of protein production in HepG2 could be overwhelmed by CYP2C9 overproduction and lead to production of a part of P450 2C9 unfunctional proteins. For exemple, supplementation of cell cultures with hemin (a heme precursor) allowed us to double the catalytic activity of P450 2C9 (data not shown). P450 2C9 overexpression could lead to the accumulation of both native and misfolded or damaged P450 2C9 protein in the ER, causing ER stress and inducing UPR. Thus, HSP induction was a consequence only of P450 2C9 protein synthesis in HepG2 cells.
Several studies have shown that HSP induction, also known as an UPR, is an adaptive cellular response to ER stress (35–37). HSPs play a protective role due to their ability to prevent protein aggregation, to promote protein disaggregation by catalyzing the refolding of damaged or denatured proteins, to degrade unfolded proteins, and to allow cells survival by removing misfolded proteins (38, 39). HSPB1 usually plays a role in the regulation of many cellular functions, such as inhibition of death receptor-mediated apoptosis, refolding of denatured proteins by acting as a molecular chaperone, and regulation of the cytosk-eleton. It has been shown that transfection of HSPB1 into L929 cells protected the cells from heat shock-induced death (40). The induction of HSPB1 (mRNA Table 2 and protein Figure
Table 2. Validation of Microarray Results by RT-qPCR Using Microfluidic Cardsa
LacZ-P450 2C9 fold variation P450 2C9-P450 2C9 SFZ fold variation
access no. gene symbol microarrays RT-qPCR p value RT-qPCR p value
NM_002155 HSPA6 2.13 200 0.0010 1.060 0.864 NM_005345 HSPA1A 6.79 18 0.0009 0.956 0.844 NM_001540 HSPB1 2.26 3.26 0.014 0.983 0.952 NM_006644 HSPH1 2.41 2.72 0.00008 1.164 0.413 NM_005348 HSPCA 2.55 1.84 0.041 1.042 0.799 NM_014412 CACYBP 2.29 1.54 0.012 1.224 0.470 NM_005347 HSPA5 2.34 1.49 0.003 1.340 0.418 NM_001539 DNAJA1 2.06 1.51 0.006 1.060 0.656 NM_006808 SEC61B 1.96 1.31 0.0029 1.326 0.008 NM_002083 GPX2 2.39 1.11 0.67 1.530 0.461 NM_002157 HSPE1 2 1.08 0.86 1.415 0.303 NM_000903 NQO1 2.11 1.15 0.50 0.904 0.741 NM_001288 CLIC1 2.13 1.10 0.52 1.055 0.626 NM_001985 ETFB 2.01 0.70 0.16 1.152 0.518 control genes NM_000196 HSD11B2 1.02 0.55 0.51 1.223 0.477 NM_000291 PGK1 1.01 0.85 0.76 1.060 0.848 NM_000918 P4HB 1.51 1.03 0.91 1.307 0.173 NM_005163 AKT1 –1.05 0.92 0.62 1.096 0.658 NM_000701 ATP1A1 1.13 1.21 0.26 1.225 0.242 NM_003194 TBP –1.03 1.00 1.000
aFold variation corresponds to the ratio of mRNA levels in HepG2 cells infected with Ad-LacZ on mRNA levels in HepG2 cells infected with
Ad-2C9, normalized on the basis of TBP mRNA content, from eight independent experiments. Concordance with the microarray results is indicated in bold. Adjusted p values for RT-qPCR results were computed using t statistics.
Figure 3. Increased expression of GRP78 and HSPB1 protein and
decreased expression of HSPA1A protein in HepG2 Ad-2C9 cells as compared to HepG2 Ad-LacZ cells. (A) HepG2 Ad-LacZ and HepG2 Ad-2C9 total protein extracts were separated by SDS-PAGE and were subjected to Western blotting with anti-GRP78 (Santa Cruz), anti-P450 2C9 (18), and antiactin (Sigma) antibodies. (B) HepG2 Ad-LacZ and HepG2 Ad-2C9 cytosolic protein extracts were separated by SDS-PAGE and subjected to Western blotting with anti-HSPA1A (Santa Cruz), anti-HSPB1 (Santa Cruz), and antiactin (Sigma) antibodies.
Figure 4. Comparison of microsomal protein preparations 24, 48, 72,
and 96 h after infection of HepG2 Ad-2C9 cells and HepG2 Ad-LacZ cells. Microsomal protein fractions from HepG2 Ad-LacZ and HepG2 Ad-2C9 cells were separated by SDS-PAGE and were subjected to Western blotting with anti-Akt, antiphospho Akt (Cell Signaling), and antiactin (Sigma).
3) in the HepG2 cells overexpressing P450 2C9 was in agreement with the absence of cellular toxicity in our experiments. In addition to inducing a UPR, ER stress also activates the endoplasmic reticulum associated degradation (ERAD) system (41, 42). ERAD is a multistep process that translocates the misfolded proteins into the cytosol, where they are labeled with ubiquitin and delivered to the 26S proteasome complex for degradation. Sec61, which contains three transmembrane pro-teins (R, β, and γ), is known to translocate misfolded propro-teins from the ER to the cytosol for proteasomal degradation (43), and this complex is up-regulated by the UPR. In our microarray experiments, three genes coding Sec61 proteins, seven genes encoding components of the proteasome complex, and two genes encoding ubiquitins were significantly induced in the HepG2 Ad-2C9 cells (Table 1). This observation is in agreement with a previous study that demonstrated that the chymotrypsin-like proteolytic activity of the proteasome was higher in HepG2, which constitutively expresses human P450 2E1 than in control cells (44). Induction of Sec61β was confirmed by Q-PCR (microfluidic card) analysis (Table 2). Moreover, in our study (data not shown), ubiquitins are involved in another significant network (score 35). It was clearly shown that expression of P450 2C9 in HepG2 induced an ER stress and activated UPR and ERAD systems. This showed that HepG2 Ad-2C9 cells devel-oped an adaptive response to ER stress leading to cell survival. Indeed, in the most significant network (score 53), almost all genes were modified in our experiment; it indicated that some protein could be phosphorylated such as Akt, which appears to play a central role in this network (Figure 2). Phosphorylation of Akt stimulates Akt catalytic activity, thus leading to the phosphorylation of several proteins that affect cell growth, cell
cycle entry, and cell survival. Therefore, Akt occupies a central position in several signal transduction pathways. Several studies have shown that Akt phosphorylation is up-regulated in response to ER stress in breast, lung, prostate, and glial cell lines, thus leading to suppression of cell death signaling (45, 46). In our study, endogenous Akt was rapidly phosphorylated, reaching a maximal level of activation 24 h after infection with Ad-2C9. The levels of phosphorylated Akt then gradually decreased but remained higher in cells infected with Ad-2C9 than in control cells until day four (Figure 4); the activation of Akt observed in HepG2 overexpressing P450 2C9 could participate in the cell survival pathway activated during ER stress.
Conclusion
When P450 2C9 protein was overexpressed in HepG2 cells, it led to an ER stress, probably caused by the production of misfolded proteins or unfunctional P450 accumulation in the ER. To prevent the deleterious effects of these misfolded proteins, the stressed cells exhibited an adaptative response, which included the up-regulation of chaperone proteins, ubiq-uitin and proteasome components, and Akt phosphorylation, which led to activation of cell survival pathways. The results obtained in our in vitro model should be extrapolated to a process involved in intact liver as a recent in vivo transcriptomic study showing, in mice treated by pyrazole (P450 2A5 inducer), that many genes involved in response to accumulation of unfolded protein in ER and ubiquitin-proteasome pathways were up-regulated (47). These effects were certainly due to the P450 2A5 induction rather than pyrazole per se. This approach validates our in vitro model and leads to the hypothesis confirmed in vivo (47).
Supporting Information Available: S9, cytosolic, and
microsomal preparations, differentially expressed genes in HepG2 Ad-LacZ cells as compared to uninfected cells and in HepG2 Ad-2C9 as compared to HepG2 Ad-LacZ and figure of PLS-DA of expression profiles in three types of cells: HepG2, HepG2 Ad-LacZ, and HepG2 Ad-2C9. This material is available free of charge via the Internet at http://pubs.acs.org.
References
(1) Parkinson, A., Mudra, D. R., Johnson, C., Dwyer, A., and Carroll, K. M. (2004) The effects of gender, age, ethnicity, and liver cirrhosis on cytochrome P450 enzyme activity in human liver microsomes and inducibility in cultured human hepatocytes. Toxicol. Appl. Pharmacol.
199, 193–209.
(2) Kim, S. K., and Novak, R. F. (2007) The role of intracellular signaling in insulin-mediated regulation of drug metabolizing enzyme gene and protein expression. Pharmacol. Ther. 113, 88–120.
(3) Ingelman-Sundberg, M., Sim, S. C., Gomez, A., and Rodriguez-Antona, C. (2007) Influence of cytochrome P450 polymorphisms on drug therapies: Pharmacogenetic, pharmacoepigenetic and clinical aspects. Pharmacol. Ther. 116, 496–526.
(4) Guengerich, F. P. (2008) Cytochrome p450 and chemical toxicology.
Chem. Res. Toxicol. 21, 70–83.
(5) Miners, J. O., and Birkett, D. J. (1998) Cytochrome P4502C9: An enzyme of major importance in human drug metabolism. Br. J. Clin.
Pharmacol. 45, 525–538.
(6) Fuhr, U., Jetter, A., and Kirchheiner, J. (2007) Appropriate phenotyping procedures for drug metabolizing enzymes and transporters in humans and their simultaneous use in the “cocktail” approach. Clin. Pharmacol.
Ther. 81, 270–283.
(7) Dansette, P. M., Bonierbale, E., Minoletti, C., Beaune, P. H., Pessayre, D., and Mansuy, D. (1998) Drug-induced immunotoxicity. Eur. J. Drug
Metab. Pharmacokinet. 23, 443–451.
(8) Draper, A. J., and Hammock, B. D. (2000) Identification of CYP2C9 as a human liver microsomal linoleic acid epoxygenase. Arch.
Biochem. Biophys. 376, 199–205.
(9) Barbosa-Sicard, E., Markovic, M., Honeck, H., Christ, B., Muller, D. N., and Schunck, W. H. (2005) Eicosapentaenoic acid metabolism by cytochrome P450 enzymes of the CYP2C subfamily. Biochem.
Biophys. Res. Commun. 329, 1275–1281. Figure 5. Effects of sulfaphenazole on P450 2C9 expression in HepG2
cells overexpressing P450 2C9, 3 days after Ad-2C9 infection. (A) P450 2C9 mRNA expression was measured by quantitative RT-PCR. (B) Western blotting was performed using 10 µg of microsomal proteins and polyclonal rabbit antihuman P450 2C9 and antihuman actin antibodies. (C) Luciferin H hydroxylase activity was measured using a P450 TM-GloCYP2C9 assay (Promega) directly in cells cultures. The results are means ( SDs of four independent experiments, and each measurement was performed in triplicate.
(10) Viswanathan, S., Hammock, B. D., Newman, J. W., Meerarani, P., Toborek, M., and Hennig, B. (2003) Involvement of CYP 2C9 in mediating the proinflammatory effects of linoleic acid in vascular endothelial cells. J. Am. Coll. Nutr. 22, 502–510.
(11) Martinez-Jimenez, C. P., Castell, J. V., Gomez-Lechon, M. J., and Jover, R. (2006) Transcriptional activation of CYP2C9, CYP1A1, and CYP1A2 by hepatocyte nuclear factor 4alpha requires coactivators peroxisomal proliferator activated receptor-gamma coactivator 1alpha and steroid receptor coactivator 1. Mol. Pharmacol. 70, 1681–1692. (12) Gerbal-Chaloin, S., Daujat, M., Pascussi, J. M., Pichard-Garcia, L., Vilarem, M. J., and Maurel, P. (2002) Transcriptional regulation of CYP2C9 gene. Role of glucocorticoid receptor and constitutive androstane receptor. J. Biol. Chem. 277, 209–217.
(13) Chen, Y., Ferguson, S. S., Negishi, M., and Goldstein, J. A. (2004) Induction of human CYP2C9 by rifampicin, hyperforin, and phe-nobarbital is mediated by the pregnane× receptor. J. Pharmacol. Exp.
Ther. 308, 495–501.
(14) Roe, A. L., Snawder, J. E., Benson, R. W., Roberts, D. W., and Casciano, D. A. (1993) HepG2 cells: an in vitro model for P450-dependent metabolism of acetaminophen. Biochem. Biophys. Res.
Commun. 190, 15–19.
(15) Knasmuller, S., Parzefall, W., Sanyal, R., Ecker, S., Schwab, C., Uhl, M., Mersch-Sundermann, V., Williamson, G., Hietsch, G., Langer, T., Darroudi, F., and Natarajan, A. T. (1998) Use of metabolically competent human hepatoma cells for the detection of mutagens and antimutagens. Mutat. Res. 402, 185–202.
(16) Ma, K. L., Ruan, X. Z., Powis, S. H., Chen, Y., Moorhead, J. F., and Varghese, Z. (2007) Sirolimus modifies cholesterol homeostasis in hepatic cells: a potential molecular mechanism for sirolimus-associated dyslipidemia. Transplantation 84, 1029–1036.
(17) Yamamoto, Y., and Negishi, M. (2008) The anti-apoptotic factor GADD45B regulates the nuclear receptor CAR-mediated transcription.
Drug Metab. Dispos. 36, 1189–1193.
(18) Belloc, C., Baird, S., Cosme, J., Lecoeur, S., Gautier, J. C., Challine, D., de Waziers, I., Flinois, J. P., and Beaune, P. H. (1996) Human cytochromes P450 expressed in Escherichia coli: Production of specific antibodies. Toxicology 106, 207–219.
(19) He, T. C., Zhou, S., da Costa, L. T., Yu, J., Kinzler, K. W., and Vogelstein, B. (1998) A simplified system for generating recombinant adenoviruses. Proc. Natl. Acad. Sci. U.S.A. 95, 2509–2514. (20) Tychopoulos, M., Corcos, L., Genne, P., Beaune, P., and de Waziers,
I. (2005) A virus-directed enzyme prodrug therapy (VDEPT) strategy for lung cancer using a CYP2B6/NADPH-cytochrome P450 reductase fusion protein. Cancer Gene Ther. 12, 497–508.
(21) Girault, I., Rougier, N., Chesne, C., Lidereau, R., Beaune, P., Bieche, I., and de Waziers, I. (2005) Simultaneous measurement of 23 isoforms from the human cytochrome P450 families 1 to 3 by quantitative reverse transcriptase-polymerase chain reaction. Drug Metab. Dispos.
33, 1803–1810.
(22) Cali, J. J., Ma, D., Sobol, M., Simpson, D. J., Frackman, S., Good, T. D., Daily, W. J., and Liu, D. (2006) Luminogenic cytochrome P450 assays. Expert Opin. Drug Metab. Toxicol. 2, 629–645.
(23) Girault, I., Lerebours, F., Tozlu, S., Spyratos, F., Tubiana-Hulin, M., Lidereau, R., and Bieche, I. (2002) Real-time reverse transcription PCR assay of CYP19 expression: Application to a well-defined series of post-menopausal breast carcinomas. J. Steroid Biochem. Mol. Biol.
82, 323–332.
(24) Marisa, L., Ichante, J. L., Reymond, N., Aggerbeck, L., Delacroix, H., and Mucchielli-Giorgi, M. H. (2007) MAnGO: An interactive R-based tool for two-colour microarray analysis. Bioinformatics 23, 2339–2341.
(25) Workman, C., Jensen, L. J., Jarmer, H., Berka, R., Gautier, L., Nielser, H. B., Saxild, H. H., Nielsen, C., Brunak, S., and Knudsen, S. (2002) A new non-linear normalization method for reducing variability in DNA microarray experiments. Genome Biol.
3research0048.1research0048.16.
(26) Smyth, G. (2005) Limma: Linear Models for Microarrays Data, Springer, New York.
(27) Calvano, S. E., Xiao, W., Richards, D. R., Felciano, R. M., Baker, H. V., Cho, R. J., Chen, R. O., Brownstein, B. H., Cobb, J. P., Tschoeke, S. K., Miller-Graziano, C., Moldawer, L. L., Mindrinos, M. N., Davis, R. W., Tompkins, R. G., and Lowry, S. F. (2005) A
network-based analysis of systemic inflammation in humans. Nature
(London) 437, 1032–1037.
(28) Mancy, A., Dijols, S., Poli, S., Guengerich, P., and Mansuy, D. (1996) Interaction of sulfaphenazole derivatives with human liver cytochromes P450 2C: Molecular origin of the specific inhibitory effects of sulfaphenazole on CYP 2C9 and consequences for the substrate binding site topology of CYP 2C9. Biochemistry 35, 16205–16212. (29) Scibetta, A. G., Copier, J., Barrett, A., Chaplin, T., and
Taylor-Papadimitriou, J. (2005) Gene expression changes induced by a recombinant E1-/E3- adenovirus type 5 vector in human mammary epithelial cells. InterVirology 48, 350–361.
(30) Minter, R. M., Rectenwald, J. E., Fukuzuka, K., Tannahill, C. L., La Face, D., Tsai, V., Ahmed, I., Hutchins, E., Moyer, R., Copeland, E. M., and Moldawer, L. L. (2000) TNF-alpha receptor signaling and IL-10 gene therapy regulate the innate and humoral immune responses to recombinant adenovirus in the lung. J. Immunol. 164, 443–451. (31) Castell, J. V., Hernandez, D., Gomez-Foix, A. M., Guillen, I., Donato,
T., and Gomez-Lechon, M. J. (1997) Adenovirus-mediated gene transfer into human hepatocytes: Analysis of the biochemical func-tionality of transduced cells. Gene Ther. 4, 455–464.
(32) Szczesna-Skorupa, E., Chen, C. D., Liu, H., and Kemper, B. (2004) Gene expression changes associated with the endoplasmic reticulum stress response induced by microsomal cytochrome p450 overproduc-tion. J. Biol. Chem. 279, 13953–13961.
(33) Little, E., Ramakrishnan, M., Roy, B., Gazit, G., and Lee, A. S. (1994) The glucose-regulated proteins (GRP78 and GRP94): Functions, gene regulation, and applications. Crit. ReV. Eukaryotic Gene Expression
4, 1–18.
(34) Thuerauf, D. J., Marcinko, M., Gude, N., Rubio, M., Sussman, M. A., and Glembotski, C. C. (2006) Activation of the unfolded protein response in infarcted mouse heart and hypoxic cultured cardiac myocytes. Circ. Res. 99, 275–282.
(35) Harding, H. P., Calfon, M., Urano, F., Novoa, I., and Ron, D. (2002) Transcriptional and translational control in the mammalian unfolded protein response. Annu. ReV. Cell DeV. Biol. 18, 575–599. (36) Zhang, K., and Kaufman, R. J. (2004) Signaling the unfolded protein
response from the endoplasmic reticulum. J. Biol. Chem. 279, 25935– 25938.
(37) Schroder, M., and Kaufman, R. J. (2005) The mammalian unfolded protein response. Annu. ReV. Biochem. 74, 739–789.
(38) Pandey, P., Farber, R., Nakazawa, A., Kumar, S., Bharti, A., Nalin, C., Weichselbaum, R., Kufe, D., and Kharbanda, S. (2000) Hsp27 functions as a negative regulator of cytochrome c-dependent activation of procaspase-3. Oncogene 19, 1975–1981.
(39) Lewis, M. L., and Hughes-Fulford, M. (2000) Regulation of heat shock protein message in Jurkat cells cultured under serum-starved and gravity-altered conditions. J. Cell Biochem. 77, 127–134.
(40) Rane, M. J., Pan, Y., Singh, S., Powell, D. W., Wu, R., Cummins, T., Chen, Q., McLeish, K. R., and Klein, J. B. (2003) Heat shock protein 27 controls apoptosis by regulating Akt activation. J. Biol. Chem. 278, 27828–27835.
(41) Tsai, B., Ye, Y., and Rapoport, T. A. (2002) Retro-translocation of proteins from the endoplasmic reticulum into the cytosol. Nat. ReV.
Mol. Cell Biol. 3, 246–255.
(42) Meusser, B., Hirsch, C., Jarosch, E., and Sommer, T. (2005) ERAD: The long road to destruction. Nat. Cell Biol. 7, 766–772.
(43) Romisch, K. (2005) Endoplasmic reticulum-associated degradation.
Annu. ReV. Cell DeV. Biol. 21, 435–456.
(44) Kessova, I. G., and Cederbaum, A. I. (2005) The effect of CYP2E1-dependent oxidant stress on activity of proteasomes in HepG2 cells.
J. Pharmacol. Exp. Ther. 315, 304–312.
(45) Hu, P., Han, Z., Couvillon, A. D., and Exton, J. H. (2004) Critical role of endogenous Akt/IAPs and MEK1/ERK pathways in counteract-ing endoplasmic reticulum stress-induced cell death. J. Biol. Chem.
279, 49420–49429.
(46) Hosoi, T., Hyoda, K., Okuma, Y., Nomura, Y., and Ozawa, K. (2007) Akt up- and down-regulation in response to endoplasmic reticulum stress. Brain Res. 1152, 27–31.
(47) Nichols, K. D., and Kirby, G. M. (2008) Microarray analysis of hepatic gene expression in pyrazole-mediated hepatotoxicity: Identification of potential stimuli of Cyp2a5 induction. Biochem. Pharmacol. 75, 538–551.