HAL Id: hal-02284511
https://hal.archives-ouvertes.fr/hal-02284511
Submitted on 11 Sep 2019
HAL is a multi-disciplinary open access
archive for the deposit and dissemination of sci-entific research documents, whether they are pub-lished or not. The documents may come from teaching and research institutions in France or abroad, or from public or private research centers.
L’archive ouverte pluridisciplinaire HAL, est destinée au dépôt et à la diffusion de documents scientifiques de niveau recherche, publiés ou non, émanant des établissements d’enseignement et de recherche français ou étrangers, des laboratoires publics ou privés.
NAC family under drought and heat stresses in bread
wheat (T. aestivum L.)
Claire Guerin, Jane Roche, Vincent Allard, Catherine Ravel, Saïd Mouzeyar,
Fouad-Mohammed Bouzidi
To cite this version:
Claire Guerin, Jane Roche, Vincent Allard, Catherine Ravel, Saïd Mouzeyar, et al.. Genome-wide analysis, expansion and expression of the NAC family under drought and heat stresses in bread wheat (T. aestivum L.). PLoS ONE, Public Library of Science, 2019, 14 (3), pp.e0213390. �10.1371/jour-nal.pone.0213390�. �hal-02284511�
Genome-wide analysis, expansion and
expression of the NAC family under drought
and heat stresses in bread wheat (T. aestivum
L.)
Claire Gue´rin, Jane RocheID*, Vincent Allard, Catherine Ravel, Said Mouzeyar, Mohamed Fouad Bouzidi
UMR 1095 Ge´ne´tique, Diversite´ et Ecophysiologie des Ce´re´ales, Universite´ Clermont Auvergne, INRA, Clermont–Ferrand, France
*jane.roche@uca.fr
Abstract
The NAC family is one of the largest plant-specific transcription factor families, and some of its members are known to play major roles in plant development and response to biotic and abiotic stresses. Here, we inventoried 488 NAC members in bread wheat (Triticum
aesti-vum). Using the recent release of the wheat genome (IWGS RefSeq v1.0), we studied
dupli-cation events focusing on genomic regions from 4B-4D-5A chromosomes as an example of the family expansion and neofunctionalization of TaNAC members. Differentially expressed
TaNAC genes in organs and in response to abiotic stresses were identified using publicly
available RNAseq data. Expression profiling of 23 selected candidate TaNAC genes was studied in leaf and grain from two bread wheat genotypes at two developmental stages in field drought conditions and revealed insights into their specific and/or overlapping expres-sion patterns. This study showed that, of the 23 TaNAC genes, seven have a leaf-specific expression and five have a grain-specific expression. In addition, the grain-specific genes profiles in response to drought depend on the genotype. These genes may be considered as potential candidates for further functional validation and could present an interest for crop improvement programs in response to climate change. Globally, the present study provides new insights into evolution, divergence and functional analysis of NAC gene family in bread wheat.
Introduction
As sessile organisms, plants have developed diverse strategies to modulate their development and growth according to environmental signals such as day/night alternation or daily tempera-ture variations [1]. At the molecular and cellular levels, the early mechanisms of response to these stimuli include signal perception by receptors, followed by signalling cascades involving changes in membrane permeability, protein phosphorylations by protein kinases or regula-tions of the target protein expression by transcription factors (TFs) [2]. About 6–8% of the
a1111111111 a1111111111 a1111111111 a1111111111 a1111111111 OPEN ACCESS
Citation: Gue´rin C, Roche J, Allard V, Ravel C,
Mouzeyar S, Bouzidi MF (2019) Genome-wide analysis, expansion and expression of the NAC family under drought and heat stresses in bread wheat (T. aestivum L.). PLoS ONE 14(3): e0213390.https://doi.org/10.1371/journal. pone.0213390
Editor: Maoteng Li, Huazhong University of
Science and Technology, CHINA
Received: October 15, 2018 Accepted: February 19, 2019 Published: March 6, 2019
Copyright:© 2019 Gue´rin et al. This is an open access article distributed under the terms of the
Creative Commons Attribution License, which permits unrestricted use, distribution, and reproduction in any medium, provided the original author and source are credited.
Data Availability Statement: All relevant data are
within the manuscript and its Supporting Information files.
Funding: The authors received no specific funding
for this work.
Competing interests: The authors have declared
plant genome is allocated to the coding of more than 1,500 TFs [3] of which 45% belong to plant-specific families [4]. Among more than 80 TF families, AP2/EREBP, bZIP, MYB/MYC, NAC and WRKY families are known to be strongly involved in the response to biotic or abi-otic stresses in plants [5–16]. The NAC (NAM (No Apical Meristem)–ATAF (Arabidopsis Transcription Activation Factor)–CUC (Cup-shaped Cotyledons)) family is one of the largest groups of plant specific TFs, and has been described in several plant species. In the model plants, Arabidopsis and rice, this family includes 117 and 151 members, respectively [17]. NAC family members have also been reported inBrachypodium distachyon (118 members)
[18], soybean (101 genes) [19], maize (157 members) [20], durum wheat (168 members) [21], and more recently in Fragaria× ananassa fruits (112 members) [22].
A typical NAC protein contains a highly conserved DNA-binding domain, measuring ~150 amino acids, and located in the N-terminal region. This domain is subdivided into five subdo-mains named A to E [23]. Subdomains A, C, and D are highly conserved. Subdomains C and D are probably involved in the binding of the NAC protein to its DNA target [24]. An addi-tional poorly conserved transcription regulatory region is present in the C-terminal region of the protein and acts as a transcriptional activator [25] or repressor [26] of target genes. The C-terminal regulatory region often contains simple amino acid repeats and regions rich in serine and threonine, proline and glutamine, or acidic residues [27]. While the majority of the NAC TFs were found as soluble proteins in the nucleus, some NAC have been identified as mem-brane-bound TFs. They are classified as membrane-related and named NTL (NTM1-like or ‘NAC with transmembrane motif 1’-Like) TFs. For example, nine NTL were identified in durum wheat [21] and at least 85 and 45 in Arabidopsis and rice respectively [28].
Expression of NAC family genes is modulated during plant development and in response to biotic and abiotic stresses [27]. NACs are one of the largest families of genes with very diverse functions. The firstNAC gene was described as related to the shoot apical meristem
develop-ment and the position determination of meristems and primordia [29]. The NAC family regu-lates many developmental and growth processes including flowering [30], root development [25], leaf senescence [31], secondary cell wall biosynthesis [32], cell division [33], and seed development [34]. The NAC family is also related to grain yield and quality. For example, a reduced expression ofOsNAP in rice and TaNAC-S in wheat increases the grain yield by
delay-ing leaf senescence [35–38]. Moreover, NAC proteins have also been shown to be involved in response to biotic stresses such as pathogen infection [39], hypersensitive response-like cell death [40], and abiotic stresses including salt, drought, and temperature [41–43]. Due to their key role in abiotic stress signalling in plants, NAC TFs could be used to improve crop plant tol-erance to unfavourable environmental conditions. This is particularly important for bread wheat (Triticum aestivum) because the yield of this major crop, which constitutes the diet basis
of millions of people, is constrained by abiotic stresses.
Bread wheat is a hexaploid species. Its genome is composed ofthree subgenomes AA (origi-nated fromT. urartu), BB (from Aegilops speltoides) and DD (from Ae. tauschii) [44]. In a recent publication, Borrillet al. [45] carried out an inventory of the TF coding genes in wheat using published TGAC gene models [46], with an emphasis on the NAC family. They identi-fied 574 (453 high and 121 low-confidence)NAC genes belonging to eight subfamilies. More
recently, a high-quality version of the wheat genome (cv Chinese Spring) assembly was released by the International Wheat Genome Sequencing Consortium (IWGSC) [47]. In this study, we used this last version to analyse the genomic organization and the expansion of the NAC family. We identified 488 (460 high and 28 low-confidence)NAC genes, named TaNAC,
in the three subgenomes A, B, and D of bread wheat. We established the correspondence (one-to-one) between the two annotations (488vs 574) yielding a consensus subset containing 361
monitored in different tissues (grains, spikes, leaves and roots) or in response to different abi-otic stresses (heat, drought, and heat + drought combination), based on the data available on thewww.wheat-expression.complatform [48]. In addition, 23 representativeTaNAC genes
were selected to investigate their response to drought stress using two contrasting wheat culti-vars at two developmental stages (220 and 450 degree days (˚Cd) after anthesis). Our results provide valuable information aboutTaNAC candidate genes to improve drought stress
toler-ance in wheat.
Materials & methods
Meta-analysis of the NAC family in bread wheat
Survey ofTaNAC in the wheat sequence. For TaNAC retrieval, the annotated proteins in
the database of the International Wheat Genome Sequencing Consortium (IWGS RefSeq v1.0) [47] were searched using the HMMER2 program implemented in Unipro UGENE 1.25 [49] and by querying the NAM motif (PF02365, generated by alignment of 587 seed sequences) downloaded from Pfam.
The full-length sequences obtained with an E-value cut-off e-1were scanned for NAC domain superfamily (IPR036093) using InterProScan (http://www.ebi.ac.uk/interpro/search/ sequence-search,S1 Table) [50]. The combination of HMMER2 and InterProScan searches led to a final set of 488 TaNAC proteins, whose 460 are high-confidence and 28 are low-confidence. TheTaNAC genes were mapped on the wheat pseudomolecule from the IWGS
Consortium to determine their chromosomal coordinates and visualized using MapGen-e2Chromosome V2 (http://mg2c.iask.in/mg2c_v2.0/). Homoeologous genes were determined using their chromosomal coordinates.
To create a high quality consensus set ofTaNAC genes, a reciprocal homology search was
performed between the TGACv1 [46] and the IWGS RefSeq v1.0 [47] cDNA databases (including high and low-confidence sequences), using Usearch program [51]. This query led to the identification of common sequences between theTaNAC gene set of Borrill et al. [45] extracted from TGACv1 cDNA database and the set of 488TaNAC sequences extracted from
IWGS RefSeq V1.0. To minimize the fortuitous detection of homology, the final set of protein-coding sequences in both annotations was used as a query. When reciprocal homology search identified the same pair ofTaNAC genes in both directions, they were considered as
homologs.
The NAC family structuration in bread wheat. To study the structuration of the TaNAC family and confirm the homoeologous groups, a phylogenetic study was performed. The maxi-mum likelihood method available in MEGA7 software [52] was used to construct an unrooted phylogenetic tree based on the alignment of the amino acid sequences of the common set of sequences established. Alignment was performed using the MUSCLE alignment algorithm [53]. The tree obtained was the consensus of 500 single trees provided by bootstraps, gaps/ missing data treatment: partial deletion, model/method LG model, rates among sites: gamma distributed with invariant sites (G).
To explore the contribution of gene duplication to the expansion of the NAC family in bread wheat, we focused on flanking sequences of eachTaNAC gene. For each locus
contain-ing aTaNAC gene, 25 Kb on either side of the gene were collected. When several TaNAC
genes are separated by less than 25 Kb, the window for sequence retrieval was extended to the 25 Kb beyond the leftmost and rightmostTaNAC genes. Homologies between nucleotide
sequences were obtained using YASS, a Blast-like tool [54] with an e-value threshold of e-30. The homology search results were then parsed and sequences with at least 80% identity over
more than 2 Kb were considered duplicates. Figures showing these duplications were gener-ated using CIRCA (OMGenomics,http://omgenomics.com/circa/).
To monitor the correlation between expression profiles of duplicated genes, Pearson corre-lation coefficients betweenTaNAC genes were calculated using the R software ( http://www.R-project.org, R development Core Team, 2008).
Expression ofTaNAC genes. The expression profiles of TaNAC genes were monitored in
different tissues (grains, spikes, leaves, and roots) [55] or in response to different abiotic stresses in leaves (heat shock, polyethylene glycol-induced drought, and a combination of both at a young stage) [56], based on the RNA seq data available on thewww.wheat-expression.com
platform [48]. Briefly, raw expression data were downloaded and analysed using the R package limma [57]. Raw expression data corresponding to the entire wheat genome were first filtered to remove weakly expressed genes (genes are retained if they are expressed at a counts-per-mil-lion (CPM) > 0.5 in at least two samples). The expression of retained genes were then normal-ized using TMM and Voom methods. Finally, expressions were compared between samples and those genes that displayed an absolute log Fold Change (logFC) >1 with an adjusted p-value < 0.05 were deemed Differentially Expressed and noted DEG. Finally,TaNAC genes
were retrieved from this set of DEG genes. Hierarchical Clustering ofTaNAC DEG was
con-ducted using Mev software [58] with euclidean distance and average linkage.
On the basis of this meta-analysis, 23TaNAC genes which displayed large fold changes in
their expression were selected to assess their response in wheat plants cultivated in field condi-tions and submitted to drought.
Expression analysis of 23
TaNAC candidate genes in field-grown stressed
wheat plants
To gain insights into the function of wheatNAC genes in response to abiotic stresses, we
decided to assess the expression patterns of 23 selectedTaNAC genes in plants subjected to
drought stress in field.
Plant material and field drought treatment. Field drought treatment was performed on the Pheno3C plant phenotyping platform. This four automatic rain shelters facility is able to generate contrasted water regimes by protecting four “stressed” plots from rainfall, while four “control” plots are managed under natural weather and irrigated if necessary to prevent water stress. The eight plots are distributed over a homogeneous three hectares area and minimum distance between two plots is 30 m. Each plot (22 m x 25 m) is subdivided into 96 micro-plots (1.9 m x 1.2 m) where different genotypes were sown. Among those genotypes and based on local expert knowledge and previous trials, two modern bread wheat genotypes (Allez-y (2011, Limagrain) and Altigo (2007, Limagrain) were selected as stress sensitive and stress tolerant cultivars respectively on the basis of yield impact under dry conditions. Soil volumetric water content (SWC) was recorded hourly with CS 655 (Cambell Scientific, Logan, UT, USA) sen-sors installed at four depth (10, 35, 50 and 75 cm) at three locations per plot. Total soil water content was calculated by integrating sensor values up to 100 cm depth (average soil depth of the plots). Average soil field capacity and available water capacity are respectively 570 and 280 mm. From those values and daily measurements of SWC, a water stress factor (Ks) was calcu-lated from Allenet al. (1998) [59]. A Ks value below 1 is considered as an indicator of water stress that increases in terms of severity when the Ks value decreases.
All plots were sown on 11/04/2016, and managed following local agronomic practices. The stress was applied starting on 03/24/2017 by sheltering the stressed plots. At anthesis (05/20/ 2017), control plots had received 130 mm more rain than stressed plots, leading to a Ks of 0.85 and 0.36 in the control and stressed plots respectively, defining a very moderate stress in the
control and a severe stress in the stress plots. Converted degree-days (˚Cd) were calculated as the sum of mean daily temperature (base 0) from anthesis. For the present experiment, three micro-plots per genotype and per hydric conditions (biological triplicates) located in two adja-cent blocks were used at both sampling dates. The samplings occurred at 250˚Cd after anthesis (end of grain cell division) and 450˚Cd after anthesis (middle of the linear phase of grain fill-ing). At 250˚Cd, water stresses were very moderate (Ks = 0.91) and very severe (Ks = 0.27) in the control and stressed plots respectively. At 450˚Cd, water stresses were moderate (Ks = 0.6) and very severe (Ks = 0.2) in the control and stressed plots respectively. For each sample, three spikes and three leaves were taken randomly and frozen immediately in liquid nitrogen prior to subsequent RT-qPCR analysis. Yield components of each plot were also assessed. Spike number per m2, which is determined before anthesis [60], is a good indicator of the plant stress response before flowering, reflecting the stress impact on the plant tillering. This variable was determined manually by counting all spikes on two 1.9 m rows per micro-plot. Grain yield was measured at maturity with an experimental plot combine harvester.
RNA isolation and relative quantification of candidate genes. To quantify the expres-sion of the 23 candidate genes, a total RNA extraction was performed on the collected samples, using the protocol described by Capronet al. [61] for grain samples, and the TRIzol protocol according to the manufacturer’s instructions (Invitrogen) for leaf samples. Reverse-transcrip-tion (RT) was performed on 2.5μg of total RNA, using the Thermo Scientific Maxima First Strand cDNA Synthesis Kit according to the manufacturer’s instructions. A RNAse H (Thermo Scientific 18021–071) treatment was performed after the reverse transcription.
When selecting the 23TaNAC genes, only one member per homoeologous group was
retained. Then, their specific expression profile was studied using Real Time-quantitative Poly-merase Chain Reaction (RT-qPCR) and by designing primers specific to the coding sequence of the considered homoeolog (listed inS2 Table), with PrimerQuest (https://eu.idtdna.com/ PrimerQuest). Amplification efficiencies of primer pairs designed were tested to keep only those with an efficiency comprised between 90 and 110% (S2 Table).
Real Time-quantitative Polymerase Chain Reactions (RT-qPCR) were carried out in a 15μl volume containing 25 ng of cDNA, 7.5 nM gene-specific primers and 7.5μl of LightCycler 480 SYBR Green I Master (Roche Diagnostics #04887352001), on a LightCycler 480 system (Roche) on the Gentyane platform, INRA de Croue¨l, France (http://gentyane.clermont.inra.fr/). The thermal cycle used was done as follows: a pre-incubation at 95˚C for 10 min, 40 amplifications cycles of 95˚C for 10s, optimal temperature of the primer for 15s, and 72˚C for 15s.
Relative target gene expression was determined by the 2-ΔΔCtmethod [62] using Ta2776 (RNase L inhibitor-like protein) for normalization [61]. A principal component analysis was carried out using the expression data of the whole set of 23 genes across all samples and the R package ggfortify [63]. For each gene, a Kruskal-Wallis test was performed to uncover differ-ences between samples.
Results
Inventory and description of the NAC TF family in bread wheat using the
IWGS RefSeq v1.0 database
The HMM profile of the Pfam NAC domain (PF02365) was used as a query to identifyTaNAC
genes in the most recent version of the annotated wheat genome released by the IWGSC RefSeq v1.0, which contains the latest assembly of the wheat cvChinese Spring pseudomolecule.
The initial HMM search identified 501 putative TaNAC sequences that were manually curated for the presence of the NAC domain (IPR036093) signature using the Interproscan platform. Thirteen sequences were discarded, giving a whole set of 488 full-length sequences
(460 high-confidence and 28 low-confidence sequences) containing the NAC domain (S1 Table).
This set was compared with the sequences identified by Borrillet al. [45] using the TGAC database. This analysis provided a robust subset of 361 common sequences, showing a single hit between the two databases (S3 Table). The combination of the two annotations improved the knowledge on theTaNAC genes present in this subset, particularly in terms of
chromo-somal location. For example, no information on the chromochromo-somal location of the TraesC-SU01G137200 gene was available from the IWGS RefSeq v1.0 database, but it was found to be identical to the TRIAE_CS42_2AL_TGACv1_093618_AA0283710 gene in the TGAC database mapped on the chromosome 2A. Similarly, among the 13 non-mapped sequences of the TGAC database, 12 were identical to already mapped IWGS sequences. Finally, 359TaNAC
genes among the 361 consensus sequences have been mapped on the 21 bread wheat chromo-somes, the two remaining sequences did not have chromosomal location information. Chro-mosomes 2 and 7 contain the highest numbers ofTaNAC genes with 89 and 81 members
respectively, which represent 24.8% and 22.6% of the total. On the contrary, chromosome 1 carries the lowest number ofTaNAC sequences, with only 17 genes (4.7%) (S1 Fig). The
TaNAC genes are evenly distributed among the subgenomes A, B, and D with a similar
pro-portions (34.5%, 33.5%, and 32.0% respectively) indicating that the expansion of the NAC fam-ily predates the bread wheat appearance through interspecific hybridization.
TaNAC genes are mostly distributed next to the telomeric regions vs centromeric one (S1 Fig). Furthermore, most of these genes are tightly linked and lay within clusters. For example, TraesCS4B01G328600, TraesCS4B01G328700, TraesCS4B01G328800, TraesCS4B01G328900, and TraesCS4B01G329100 are close on chromosome 4B within 347 Kb. Similarly, theTaNAC
genes denoted TraesCS4A01G419900, TraesCS4A01G420000, TraesCS4A01G420100, TraesC-S4A01G420200, TraesCS4A01G420900, TraesCS4A01G421000, TraesCS4A01G421100, TraesCS4A01G421200, and TraesCS4A01G421300 are tightly linked and lay within 796 Kb.
The genomic length of the sequences within the whole set of 488TaNAC genes, ranged from
273 to 15074 base pairs, corresponding to protein sequences from 91 (TraesCS2B01G556700LC.1) to 1030 amino acids (TraesCS5B01G550800.1) with a mean length of 370 amino acids. One-fifth of the sequences (i.e. 100 sequences out of 488) are intronless. On the other hand, one
sequence (TraesCS5B01G550800.1) contains 16 exons. The majority (214 sequences, 44%) con-tain three exons (S2 Fig). It is interesting to note that eight sequences, representing three homo-eologous groups, contain two NAC domains (TraesCS2A01G363700, TraesCS2B01G381700, TraesCS2D01G361500; TraesCS3A01G269900, TraesCS3B01G303800, TraesCS3D01G269600; and TraesCS2A01G328100, TraesCS2D01G334800) (S1 Table).
Evolution by duplication of the TaNAC family
The evolution of the TaNAC family was evaluated by studying the phylogenetic relationships betweenTaNAC genes. A phylogenetic tree based on multiple sequence alignment of the
com-mon set including 361 full-length proteins was constructed (Fig 1), using the Maximum Likeli-hood method.
The phylogenetic tree showed that, in general, sequences contained in the clades belong to the same homoeologous groups. Based on sequences alignment, 156TaNAC genes belonging
to A, B, and D genomes were grouped into 52 complete homoeologous groups in the phyloge-netic tree, representing 43% of the totalTaNAC genes. Another 56 incomplete homoeologous
groups containing only two members were identified and represent 31% of the totalTaNAC
to note that several sequences with the same exon-intron structuration and clustered on the wheat genome are grouped together in the phylogenetic tree.
In addition, these clades contain genes originating from non-homoeologous chromosomes. These observations suggest that the expansion of the TaNAC family might be the result of both local and interchromosomal duplication events. To test this hypothesis, we retrieved the geno-mic sequences of 50 Kb loci spanningTaNAC genes and carried out pairwise alignments using
the YASS algorithm [54].
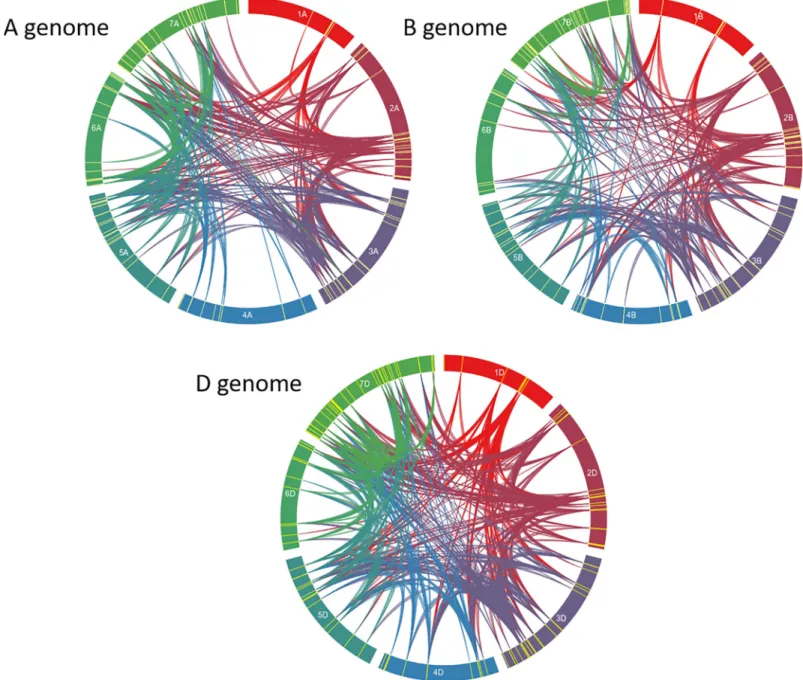
For the purpose of simplicity, we first considered duplications within each subgenome. Fragments displaying at least 90% identity over at least 3 Kb were retained. Using these crite-ria, 318 duplicated fragments were identified within the subgenome A, with mean-length = 5.75 Kb and median-length = 5.255 Kb. The largest fragment was 13.093 Kb. Concerning the subge-nome B, 207 duplicated fragments were detected, with mean-length = 5.546 Kb and median-length = 5.146. The largest duplicated fragment was 10.009 Kb. Concerning the subgenome D, 428 duplicated fragments were detected, with mean-length = 5.639 Kb and
median-length = 5.332. The largest duplicated fragment was 9.947 Kb (Fig 2,S4 Table).
To complete that first analysis and provide also insight into duplications between subge-nomes and consequently into the expansion pattern of the TaNAC family, we carefully sur-veyed one robust clade containingTaNAC genes originating from each wheat subgenome.
Fig 1. Maximum likelihood phylogeny of the 361 common complete protein sequences. The zoom focused on the clade studied as a case of duplication. Colors
indicate the number of exons in each sequence.
This clade (pointed out inFig 1and boxed in blue inS3 Fig) was chosen because it contained severalTaNAC belonging to A (2 sequences from chromosome 5), B (5 sequences from
chro-mosome 4), and D genomes (2 sequences from chrochro-mosome 4). Careful examination of regions containing the nine genes of this clade indicated thatTaNAC genes from a given
chro-mosome are physically tightly linked (separated by maximum one gene). To avoid homoeol-ogy relationships between subgenomes, which may obscure duplications, the subgenome 4D containing twoTaNAC genes was not further considered. By using a 25 Kb window around
the most distalTaNAC genes within each locus, we retained a first 396.990 Kb long
(619563787 to 619960777 bp) locus from the chromosome 4B containing the fiveTaNAC
Fig 2. Circos diagram of the seven chromosomes of genomes A, B, and D. Yellow features indicate the presence of a TaNAC. Bands link two chromosomal regions
with more than 90% of homology and a minimal length of 3 Kb.
genes and a second 209.278 Kb long (666499425 to 666708703 bp) locus from the 5A contain-ing fourTaNAC genes. Over the four NAC sequences found on this chromosome, only
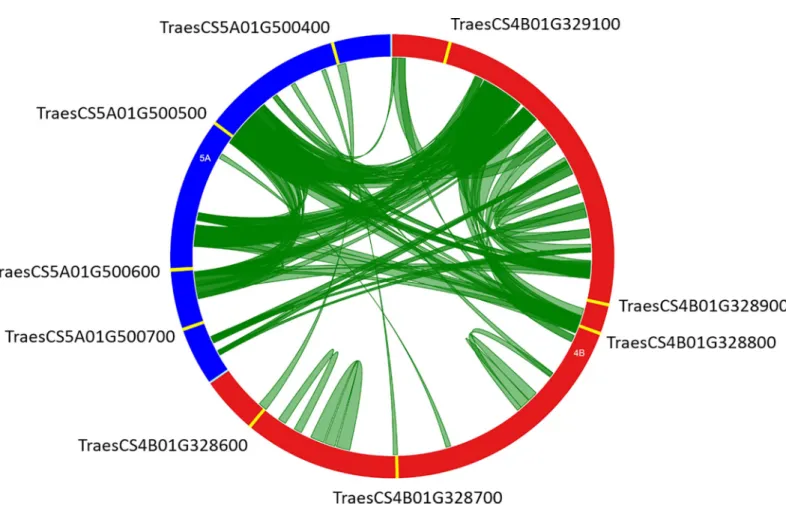
TraesCS5A01G500400 and TraesCS5A01G500700 genes were present in the set of 361 sequences and studied for duplication. A dot plot of these two genomic regions (S4 Fig) highlighted numerous duplicated fragments in sense and antisense orientations. To clarify the nature and the extent of duplications, we identified all the duplicated fragments with a mini-mal length of 2 Kb and at least 80% identity. A total of 119 non-overlapping duplicated frag-ments were identified, of which 54 fragfrag-ments correspond to intrachromosomal duplications (31 on chromosome 4B and 23 on 5A). The remaining 65 duplicated fragments correspond to interchromosomal duplications. The majority of these duplications (66.7%) represents a length less than 4 Kb, but a fragment has the maximum size of 9,006 bp. Duplications between loci of these genomic regions are presented inFig 3. About 41% of these fragments (49) are dupli-cated in the sense orientation (S5 Table).
To test whether some duplicated genes could evolve differently, we compared the normal-ized expression patterns of duplicated genes in five wheat organs during three developmental stages: root (harvested at seedling, three leaves and meiosis), stem (harvested at spike at 1 cm, two nodes and anthesis), leaf (seedling, three tillers avec 50˚Cd after anthesis), spike (harvested at two nodes, meiosis and anthesis), and grain (harvested at 50˚Cd, 350˚Cd and 700˚Cd after anthesis [55]. In parallel, the expression profiles of the same genes were compared in response to abiotic stresses (heat, drought, and combined heat-drought) [56]. Only genes that were
Fig 3. Circos diagram of chromosomes 4B (red, 396.990 Kb) and 5A (blue, 209.278 Kb) genomic regions containing nineTaNAC genes (yellow features). Green
bands link two chromosomal regions with more than 80% of homology and a minimal length of 2 Kb.
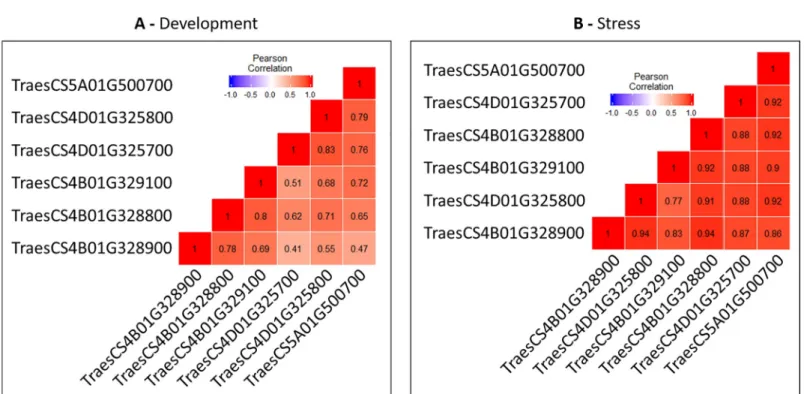
expressed in both studies were retained for comparison. The correlation (Pearson coefficient) was computed between pairs of genes (Fig 4).
During development, the Pearson coefficient ranged from 0.41 (between TraesCS4D01G325700 and TraesCS4B01G328900) to 0.83 (between TraesCS4D01G325800 and TraesCS4D01G325700). In contrast, correlations were higher during responses to stress and ranged from 0.77 to 0.94. These results indicate that the members of this duplication display similar expression profiles in response to the abiotic stresses tested but a substantial variation in expression profiles is observed during development between the same members as shown by the behavior of the two paralogs TraesCS4D01G325700 and TraesCS4B01G328900 (Fig 4).
In a similar way, an examination of a second duplication (boxed in red in the phylogenetic tree provided inS3 Fig) was performed. In this case, the expression profiles of the paralogs were highly correlated during development while they could be weakly correlated during responses to abiotic stresses (i.e. between TraesCS2B01G118500 and TraesCS2A01G101100)
(S5 Fig).
In silico analysis of the expression of TaNAC genes during development or
in response to abiotic stresses
In order to monitor the expression of wheatTaNAC genes during development and in
response to several abiotic stresses, we took advantage of valuable resources publicly available. In particular, we used a compendium of RNA-seq reads corresponding to various experiments and mapped to the wheat genome by Borrillet al. [45]. Raw counts corresponding to five organs at three developmental stages [55] or to abiotic stress treatments [56] were downloaded, normalized using TMM and voom methods, then Differentially Expressed Genes (DEG) were identified using an absolute logFC = 1 and an adjusted p = 0.05 as thresholds (R package limma) [57].
Fig 4. Pearson correlations between duplicated genes of the studied 4B-4D-7B-5A chromosomal regions during development (A) and stress (B).
Responses ofTaNAC genes to abiotic stresses. We identified differentially expressed
wheat genes in one or several comparisons. TheTable 1shows the details of this analysis where DEG are denoted up- or down-regulated genes in comparison with the non-treated control sample. Among the whole set of DEG genes, 162 were annotated asTaNAC genes and
dispatched as follows: 109 uniqueTaNAC genes were identified in heat treatments, 100 in
drought treatments and 114 in heat-and-drought treatments. Some of them are common in two or more conditions (Fig 5).Table 1andS6 Tableshow the distribution of these differen-tially expressedTaNAC genes alongside their logFC and the associated adjusted p-value.
Expression ofTaNAC genes during development. The TaNAC genes have been shown
to be involved in plant development with expression profiles that can vary between organs and
Fig 5. Venn diagram of the 162 differentially expressedTaNAC genes in response to heat, drought, and heat
+ drought stress.
https://doi.org/10.1371/journal.pone.0213390.g005
Table 1. Number of differentially expressed genes in response to two abiotic stresses.
Heat stress (40˚C) 1h Heat stress (40˚C) 6h Drought 1h Drought 6h Heat + Drought 1h Heat + Drought 6h Number of down-regulated genes 6763 11420 339 6426 7018 11288
Number of down-regulatedTaNAC genes 24 39 5 28 28 41
Number of up-regulated genes 9837 11195 3117 6352 11796 11629
Number of up-regulatedTaNAC genes 43 31 40 54 43 43
during organ development. In order to detect preferentially expressedTaNAC genes in certain
wheat organs and at certain stages, we used the RNA-seq data of Chouletet al. [55], compris-ing five organs and three developmental stages per organ. We then also selected the most dif-ferentially expressedTaNAC genes compared to other tissues using a logFC threshold of +12.
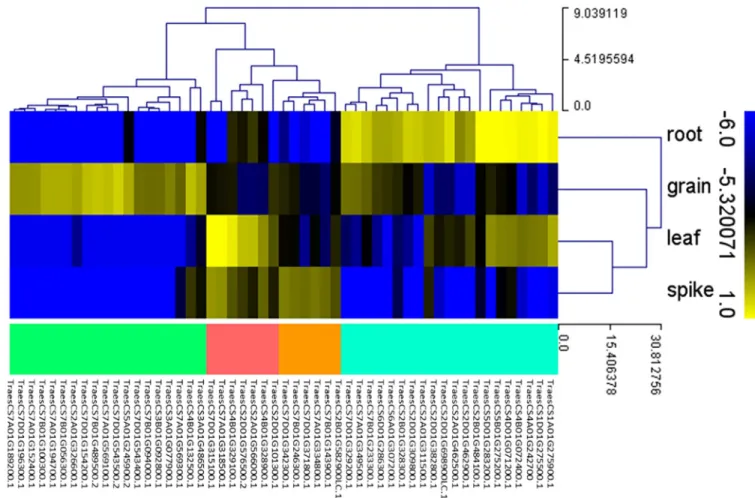
Using these relatively stringent criteria, we identified 52TaNAC genes with a highly preferred
expression pattern distributed as follows: 19 in the grain, 7 in the leaf, 20 in the root, 6 in the spike and none in the stem (Table 2,Fig 6).
TaNAC expression analysis in field under drought stress
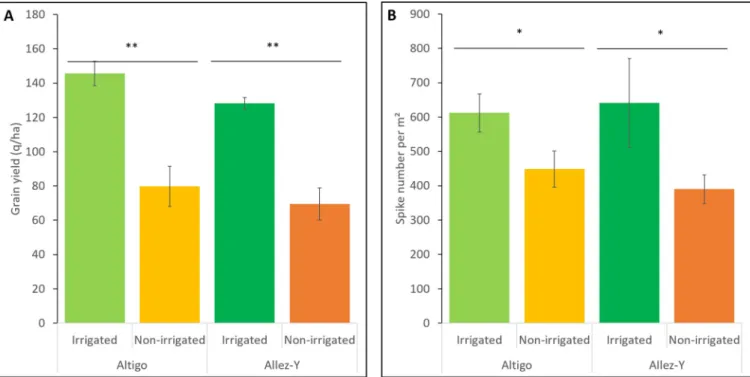
Grain yield and spike number per m2were used to characterize the effect of the water stress generated in the drought trial. Under non-irrigated treatment, yield losses of 45.2% and 45.8% were observed for Altigo and Allez-y genotypes respectively. In the same way, a decrease of the spike number per m2was observed (-26.6% for Altigo and -39.1% for Allez-y) (Fig 7). which translates to a high level of water stress that affected plant growth [60].
TaNAC gene expression profile under irrigated conditions. The in silico analysis
resulted in a set ofTaNAC genes tagged as DEG. A subset of 23 TaNAC displaying high fold
changes in their expression were selected and analyzed in plants grown in the field under agro-nomic conditions. Their expression was monitored in two organs (leaf and grain) at two stages representative of grain development: cell division (220˚Cd) and grain filling (450˚Cd) in Altigo and Allez-y.
The 23TaNAC genes tested in irrigated fields exhibited statistically differential transcript
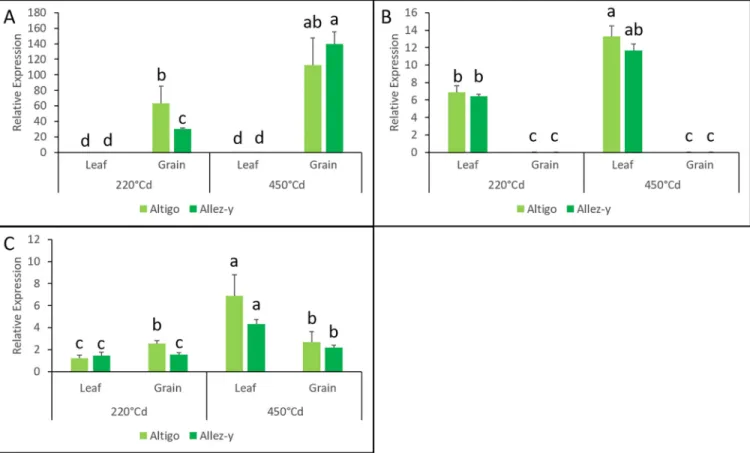
levels between organs (leaves and grains), regardless of the genotype or the stage. Seven genes appeared to be preferentially expressed in the grain and 16 in the leaf. The gene TraesC-S5A01G245900 showed the highest expression in the grain compared to the leaf (10 018 times more) whereas TraesCS7D01G315100 was the most expressed gene in the leaf (332 times more than in the grain) (Fig 8A and 8B).
In addition, someTaNAC gene expressions varied depending on the developmental stage
(220˚Cd vs 450˚Cd). One gene (TraesCS2A01G566300.1) appeared to be preferentially expressed at 220˚Cd while 15 genes were preferentially expressed at 450˚Cd. For example, the expression level of TraesCS2A01G101100 gene was found to be 4.19 times more in leaves at 450˚Cd compared to 220˚Cd (Fig 8C).
Expression ofTaNAC genes under drought stress. The expression data of the 23 selected
genes in drought field conditions were presented in a principal component analysis (S6 Fig). The first two Principal Components (PC1 and PC2) explained respectively 83.5% and 10.8% of the total variation. Cumulatively, these two PCs contributed to 94.3% of the total variation of gene expression in response to drought, organ, genotype, and stage conditions. The first axis is explained by gene expression in the leaves under drought conditions at the later stage, 450˚Cd (S6 Fig). The second axis is mainly explained by an organ x stage effect. Indeed, grain samples at 450˚Cd were plotted in the lowest part of theS6 Fig. In the grain subset, the samples corre-sponding to early and late grain developmental stages (full form– 220˚Cd and empty form– 450˚Cd) constitute distinct groups along the second axis (PC2). In addition, considering only the data from grain at 450˚Cd, it can be noticed that the two genotypes are plotted into two dif-ferent groups.
In leaves, the highest difference under drought stress was observed at 450˚Cd compared to 220˚Cd, regardless of the genotype (Fig 9A). A genotype effect was observed in response to drought only in grains compared to leaves. More precisely, grain-specific genes were differen-tially expressed at a different stage depending on the genotype. Indeed, a down-regulation under drought treatment was observed at 220˚Cd in Altigo for five grain-specific genes. In
Table 2. Number of differentially expressed genes (A) and list of preferentially expressedTaNAC genes (B) in five wheat organs.
A Grain Leaf Spike Stem Root
Number of down-regulated genes 6505 5815 6533 6356 6362 Number of up-regulated genes 6862 5508 4468 5117 8447
B
Transcript Organ with a preferential expression of the gene logFC Adjusted P.Value
TraesCS2D01G576500.2 Leaf 18.178 0.0009 TraesCS4B01G329100.1 Leaf 17.573 0.0121 TraesCS2D01G101300.1 Leaf 17.472 0.0231 TraesCS4B01G328900.1 Leaf 17.299 0.0298 TraesCS7A01G318500.1 Leaf 16.701 0.0074 TraesCS7D01G315100.1 Leaf 16.4 0.0356 TraesCS2A01G566000.1 Leaf 16.21 0.0377 TraesCS7B01G489500.2 Grain 24.77 0.0026 TraesCS7D01G543500.2 Grain 24.394 0.007 TraesCS7A01G569100.1 Grain 24.269 0.0038 TraesCS2A01G326600.1 Grain 24.025 0 TraesCS7B01G100300.1 Grain 23.802 0.0025 TraesCS7A01G189200.1 Grain 23.73 0.0002 TraesCS7B01G056300.1 Grain 23.723 0.005 TraesCS7D01G154200.1 Grain 23.719 0.007 TraesCS7A01G194700.1 Grain 23.663 0.0059 TraesCS7D01G196300.1 Grain 23.432 0.0031 TraesCS7B01G094000.1 Grain 23.334 0.0005 TraesCS7A01G152400.1 Grain 23.258 0.0009 TraesCS3B01G092800.1 Grain 23.077 0.0007 TraesCS4B01G132500.1 Grain 22.886 0 TraesCS7D01G543400.1 Grain 22.879 0.0004 TraesCS5A01G245900.2 Grain 22.67 0.0147 TraesCS7A01G569300.1 Grain 21.729 0.0011 TraesCS3A01G486500.1 Grain 20.566 0 TraesCS3A01G077900.1 Grain 20.52 0.0329 TraesCS2D01G309800.1 Root 23.596 0 TraesCS2A01G462500.1 Root 23.17 0 TraesCS2A01G311500.1 Root 22.266 0 TraesCS1D01G275500.1 Root 21.745 0 TraesCS2D01G462900.1 Root 21.084 0.0002 TraesCS6A01G307200.1 Root 20.627 0 TraesCS2B01G328300.1 Root 20.483 0 TraesCS2B01G484100.1 Root 20.365 0.0002 TraesCS6D01G286300.1 Root 20.325 0 TraesCS2D01G698900LC.1 Root 19.923 0 TraesCS7D01G329200.1 Root 19.261 0.0007 TraesCS7B01G233300.1 Root 19.259 0.0001 TraesCS7A01G349500.1 Root 19.001 0.0009 TraesCS1A01G275900.1 Root 18.528 0.0001 TraesCS4A01G242700 Root 18.32 0.0008 TraesCS4B01G072400.1 Root 18.291 0.0003 TraesCS5B01G275200.1 Root 18.04 0.0021 (Continued )
Table 2. (Continued)
A Grain Leaf Spike Stem Root
Number of down-regulated genes 6505 5815 6533 6356 6362 Number of up-regulated genes 6862 5508 4468 5117 8447
B
Transcript Organ with a preferential expression of the gene logFC Adjusted P.Value
TraesCS5D01G283200.1 Root 17.985 0.0045 TraesCS2D01G382800.1 Root 17.401 0.0022 TraesCS4D01G071200.1 Root 16.877 0.0136 TraesCS7D01G371800.1 Spike 19.526 0.0002 TraesCS7B01G143900.1 Spike 18.488 0.0025 TraesCS7A01G334800.1 Spike 18.372 0.0042 TraesCS7B01G246300.1 Spike 18.219 0.0053 TraesCS2B01G582900LC.1 Spike 17.862 0.005 TraesCS7D01G342300.1 Spike 17.198 0.0151
ATaNAC gene is preferentially expressed in a tissue if i) its logFC is the highest in this tissue vs the others and ii) the logFC threshold is � 12.
https://doi.org/10.1371/journal.pone.0213390.t002
Fig 6. Heat map of 52TaNAC genes expression profile in four organs (grain, spike, leaf, and root), using the RNAseq data of Choulet et al. [55]. These 52
TaNAC genes have a highly preferred expression pattern distributed as follows: 19 in the grain (green branches), 7 in the leaf (red branches), 20 in the root
(blue branches), and 6 in the spike (orange branches). This figure was generated using MeV software. Hierarchical clustering was performed for the transcript abundance from all conditions.
Allez-y, four of these transcripts (TraesCS3A01G077900.1, TraesCS5A01G245900.2, TraesCS7B01G056300.1 and TraesCS7B01G100300.1) were down-regulated and the last one was up-regulated (TraesCS7A01G569100 .1) only at 450˚Cd (Fig 9B,Fig 9C).
Discussion
The sequence availability of the whole bread wheat genome and expression data among differ-ent wheat genotypes, organs, and conditions are rich resources for systematic analysis of gene transcriptional regulation. Particularly, these data provide useful information for the identifi-cation of candidate genes involved in wheat development and its stress response.
Among transcription factors, the NAC family is one of the largest families and they are studied in a plethora of cereals [18,20,21] particularly in response to abiotic stresses [42,64,65], but only scarce information is available on bread wheat.
However, valuable resources and studies have recently been released. Particularly, Borrill
et al. [45] identified 453 high confidenceTaNAC retrieved from TGAC database [48]. In addi-tion, large RNA-seq expression data exist on several wheat genotypes, in different organs [55] and abiotic stresses (heat shock or drought) [56] and are available to the scientific community. Based on these data, we studied the organisation of the NAC family in bread wheat and its expansion that could have occurred during evolution through potential duplication events. These resources were also used to identify differentially expressedTaNAC genes in wheat
grown under drought conditions in field and to validate the potential specialization of some TaNAC members.
TaNAC genes: A large family
First, we identified 488 members of the NAC family in bread wheat using the IWGS RefSeq v1.0 database [47], whereas only 117 members were identified in Arabidopsis, 151 in rice [17]
Fig 7. Drought effect on the grain yield (q/ha) (A) and spike number per m2(B) of two genotypes (Altigo and Allez-y). Mean values and standard
deviation were obtained from three replicates (Student’s T test,�indicates a P < 0.05 and��indicates a P < 0.01).
or 168 in durum wheat [21]. This high number is due to the presence of three subgenomes in bread wheat. After improving our dataset with TGAC sequences retrieved by Borrillet al. [45], we ended up with 361 sequences representing a high quality consensus subset. Considering the hexaploidy of wheat, one copy of each gene is expected to be carried by each of the three genomes (A, B, and D) creating homoeologous groups among the consensus subset. In this family, 43% of the TaNAC members can be gathered in complete homoeologous groups, 31% form incomplete homoeologous groups and 26% are not linked to a group. A divergence of sequences due to several mutations or a lack of sequences present in the subset could explain the incomplete homoeologous groups. This result has already been observed in other TF fami-lies, such as the bZIP family [66].
Similar to what has been described in other plant species such as maize [67] and rice [17], theTaNAC gene distribution among the chromosomes was uneven. On the contrary, the three
subgenomes carry the same proportion ofTaNAC genes, which is consistent with the
distribu-tion observed in durum wheat, a diploid species [21]. This result suggests thatTaNAC family
expansion was likely prior to a polyploidization event in bread wheat.
Expansion of the wheat
TaNAC genes family due to small-scale duplications
Several recent studies have proposed different mechanisms to explain the duplication events and gene expansion in plants. These proposals included, for instance, retrotransposition, duplicated DNA transposition, unequal crossing-over, and polyploidization [68–70]. InFig 8. RT-qPCR analysis of threeTaNAC genes (TraesCS5A01G245900.2 (A), TraesCS7D01G315100.1 (B), and TraesCS2A01G101100.1 (C)) in leaves
and grains at 220˚Cd and 450˚Cd in irrigated conditions. Mean values and standard deviation were obtained from three replicates. According to a
Kruskal-Wallis test, the same letter indicates no significant difference.
addition to these mechanisms, Wickeret al. [71] then Gloveret al. [72] proposed another mechanism leading to gene movement and expansion. In particular, Gloveret al. [72] showed that massive small-scale interchromosomal gene duplications occurred in the bread wheat genome after double-strand DNA break repair. Consequently, many non-syntenic genes have high sequence similarity. Regardless of the mechanisms involved in gene duplication, this may eventually lead to a pseudogenization, a conservation of the gene function, a subfunctionaliza-tion or a neofuncsubfunctionaliza-tionalizasubfunctionaliza-tion of duplicate genes [73].
In this study, we noticed that several clades in the phylogenetic tree contained sequences that were either physically tightly linked on the same chromosome or mapped to a non-homo-eologous group, suggesting that both intra and inter-chromosomal duplication events occurred. To test the possibility of small-scale duplications, we focused on three genomic regions on the chromosomes 4B, 4D, and 5A that encompass 11TaNAC genes, which display highly similar
sequences and similar genomic structures (2 exons). By aligning the sequences at the vicinity of these genes, we uncovered a high homology between the genomic regions (Fig 3). This finding support the hypothesis evoked by Gloveret al. [72] about the expansion of the multi-genes fam-ily that is partially due to small-scale duplication driven by repetitive sequences.
Expansion of the wheat
TaNAC genes family due to retroposition
Of the 361 high-quality sequences, 68TaNAC genes (19%) are intronless, which is a
character-istic of retroposons [74]. The subfamily NAC-h includes 65 of these 68 genes that are grouped
Fig 9. RT-qPCR expression analysis of TraesCS5A01G143200.1 (A), TraesCS5A01G245900.2 (B), and TraesCS7A01G569100.1 (C). The 2-ΔΔCtmethod was used to calculate the ratio of their relative expression levels in drought conditions with the one in irrigated conditions. Mean values and standard deviation were obtained from three replicates (Student’s T test,�indicates a P < 0.05 and��indicates a P < 0.01).
in the same clade of the phylogenetic tree. However, in addition to an absence of intron, the presence of a poly(A) tract at the 3’end and a TSD (Target Site Duplication) in a gene sequence constitutes a hallmark of a retroposition event [74]. However, we failed to identify any of these signatures in these sequences. These signatures were possibly obscured by multiple mutations during evolution to such extent that they are no longer recognisable. Furthermore, several intronlessTaNAC genes of this clade are grouped into homoeologous groups suggesting that
retroposition/duplication events probably occurred prior to wheat polyploidization.
Interestingly, the distribution ofTaNAC intronless genes among chromosomes was found
not to be equivalent to the one observed for the whole TaNAC family. For example, although the gene proportions of the whole TaNAC family on the chromosome 3 and 5 are close (13 and 16% respectively), a higher proportion of intronlessTaNAC genes was noticed on
chro-mosome 3 (29% of the total intronless genes) whereas no intronless genes were observed on chromosome 5.
Taken together, these results indicate that both small-scale duplication and retroposition phenomena led to the expansion of this family of genes. Furthermore, these mechanisms could act in combination,i.e. a gene retroposition could be followed by small-scale duplications
driven by repetitive sequences at the very vicinity of the gene.
For example, TraesCS2A01G328100, TraesCS2A01G328200, TraesCS2A01G328300 and TraesCS2A01G328500 are intronless and tightly linked genes, and could be an example of the retroposition/duplication events that could have occurred during evolution.
Expression of
TaNAC genes under drought field conditions
As a major widely spread environmental stress, drought is known to significantly affect wheat yields worldwide. Interactions between plant development and stress response are complex, especially in the field, where crops are submitted to a combination of environmental variables (such as water availability and temperature). Although a few NAC TFs have been studied in wheat compared with the model plants Arabidopsis and rice, it has been shown that they may also be involved in response to environmental conditions [5]. SomeTaNAC genes have already
been studied in bread wheat. For example, Arabidopsis overexpressingTaNAC2, TaNAC29, or TaNAC67 display improved tolerance to multiple abiotic stresses [16,42,75]. In the same way,
TaNAC2a, TaNAC2D, TaNAC4a, TaNAC6, TaNAC7, TaNAC13, and TaNTL5 were induced
by water stress, high salinity, and/or low temperature, at different intensities [76,77]. Recently,
TaRNAC1 was found to enhance drought tolerance leading to higher biomass, grain yield, and
root length [78]. In addition, transgenic wheat overexpressingTaNAC47 showed a
drought-tolerant phenotype that may be induced in response to ABA [79].
Here, we have studied 23TaNAC genes that we identified as the most up-regulated
(p-value < 0.05) in specific organs (leaf or grain) or in response to treatments (drought and heat) (S7 Table). Among the 23 selected genes, 20 belong to the subfamilies NAC-a to d, which have been described as Stress Related NAC containing subfamilies [80] (S3 Table).
SomeTaNAC genes exhibit an extreme level of transcript abundance specifically
depending on the organ. NAC genes are recognized to be largely involved in many
develop-mental and growth processes, such as the differentiation of major organs [81]. Our study highlighted genes that are preferentially expressed in the leaf (16) or in the grain (7) regardless of the genotype, the grain developmental stage, or the field conditions.
Interestingly, of those genes, seven leaf-specific and five grain-specific genes were found, with an expression level at least 10 times higher than in the other organ (S7 Table), suggesting their specific implication in the leaf or grain development. For example, TraesCS7A01G305200.1 gene up-regulated in leaves either in the earliest grain developmental stage (220˚Cd) and the
grain filling stage (450˚Cd), was found to be similar to TaNAC1/TaNACS already described by Zhaoet al. [37]. In this work, the authors highlighted an increase in nitrogen concentration in wheat grains from lines over-expressing the TaNAC-S protein (TaNAC1) and a stay-green phe-notype. These authors concluded that NAC TFs, expressed mainly in the leaves, may participate to delay post-anthesis foliar senescence (stay-green phenotype) through a better remobilization of the nutrients during senescence. Another gene responding mainly in leaf in our experiment (TraesCS4D01G176000.1) is homologous to aNAC gene in the rose, RhNAC100, that has been
characterized as a repressor of cellular expansion of rose petals [82], suggesting its involvement in the determination of cell size.
Among the seven up-regulatedTaNAC grain-specific genes, one gene (TraesCS7A01G569100.1)
was found to be homologous to ONAC20 and ONAC026 described in rice [24]. In this latter study, the authors showed that threeNAC genes (ONAC020, ONAC026 and ONAC023) are
expressed specifically during seed development at a very high level, suggesting a potential role of these genes,via their heteromerization capability, in the regulation of the grain size/weight.
Another gene, TraesCS3A01G077900.1, was found to be homologous to a barleyHvNAC019
gene which is preferentially expressed in grain, indicating that this gene could regulate seed development in association with two other genes (HvNAC017 and HvNAC018) [83].
Leaf-specificTaNAC genes are up-regulated at the grain filling stage in response to
drought. Sixteen genes were found differentially expressed in both leaves and grains between the early grain developmental stage (cell division) and the grain filling stage, and mainly up-regulated at 450˚Cd (15 genes).
Drought stress during grain filling stimulates leaf senescence and enhances remobilization of water-soluble carbohydrates to the grains [84]. Interestingly, we found a set of eightTaNAC
genes that were preferentially expressed in leaves during grain filling in response to drought. This finding may indicate that these genes could participate in the resource remobilization from the leaves to the grains. For example, the three members of the same homoeologous group, located on chromosome 5 (TraesCS5A01G143200.1 (Fig 9A), TraesCS5B01G142100.1 and TraesCS5D01G148800.1) were found similar toTaNAC69. This gene has been
well-char-acterized as a drought stress regulator [85], and was shown to improve grain yield. However, its expression was found mainly in roots compared to leaves [65,85,86]. It is worthy to note that, in our study, the genome A copy-gene was expressed at a higher level than the two other homoeologous copies in leaves. This finding may suggest that the B and D copies could be related to the root-specific expression that has not been measured in this study. The homolo-gous gene in rice (OsNAC10) has also been demonstrated to be involved in drought adaptation
mainly by enhancing the level of stress-protection genes, such as chitinase, ZIM family gene, and glyoxalase I family gene; and increases grain yield significantly under field drought condi-tions [87]. Also, two members of the same homoeologous group (TraesCS4D01G176000, TraesCS4B01G174000) are homologs to the rice geneONAC39 (OSCUC1/ONAC039) that has
also been described by Jeonget al. [87] as a drought responsive gene (fold change: 9.44). The genes of this homoeologous group in wheat may have similar functions and indicates that these genes may be associated with drought stress.
Another wheat gene (TraesCS2A01G101100,Fig 8C) was up-regulated in leaves under drought at 450˚Cd in our field conditions. In contrast, its homolog,TaGRAB2, which was
involved in response to biotic stress (a plant DNA virusGeminiviridae), showed an expression
pattern barely detectable in leaves [39]. These findings suggest that the same gene could be expressed or not in leaves, depending on the stress.
Finally, no characterized homolog has been found in the literature for TraesCS3B01G303800.1 and TraesCS6D01G390200.1. These genes may be interesting candidates for field drought toler-ance and require further investigations.
Grain-specificTaNAC genes respond differentially to drought according to the
geno-type. FiveTaNAC genes (TraesCS3A01G077900.1, TraesCS5A01G245900.2,
TraesC-S7A01G569100.1, TraesCS7B01G056300.1, and TraesCS7B01G100300.1) are grain-specific. Interestingly, their behavior in response to drought varies according to the genotype. They are down-regulated under drought treatment during the early grain developmental stage (cell divi-sion) in the genotype which exhibited the highest number of spikes/m2(Fig 7B) (Altigo); whereas they are down-regulated (4 genes) or up-regulated later during the grain filling stage (TraesCS7A01G569100.1), in the other genotype (Allez-y) (Fig 9B,Fig 9C). These results sug-gest that, depending on the genetic background, those genes may harbor different alleles that could affect their drought tolerance.
Four of these five genes (TraesCS7A01G569100.1, TraesCS5A01G245900.2, TraesCS7B01G056300.1, and TraesCS7B01G100300.1) have been found previously differentially expressed in grain in response to a moderate warming of +8˚C applied during the grain cell division stage [88]. These results suggest that these fourTaNAC genes may be
involved in response to close abiotic stresses (drought and high temperature), such as other
NAC genes like MlNAC9, SlNAC3, ONAC022, GmNAC3 and GmNAC4, that were described
involved in several environmental stresses [19,89–91].
Conclusion
In conclusion, we performed a comprehensive study of NAC TFs in the bread wheat genome (T. aestivum), cultivar Chinese Spring. We identified a high quality set of 361 TaNAC genes in
common with those described in Borrillet al. [45]. We provided evidences as to how small scale duplications and retroposition contributed to the expansion of this family of genes. Finally, the expression patterns of 23TaNAC genes in two organs at two stages under drought
in the field, combined with our study of duplication events, revealed a functional diversifica-tion of this gene family’s members. Further funcdiversifica-tional characterizadiversifica-tions of five grain specific
TaNAC genes are in process to identify their role in the wheat grain development and in
abi-otic stress responses.
Supporting information
S1 Fig. Chromosomal distribution of theTaNAC gene family in bread wheat. Using their
chromosomal location information, 451 sequences have been mapped on the seven chromo-somes of the three wheat subgenomes A (red), B (green), and D (blue). The first seven letters of the sequence names have been removed (e.g. 4B01G328600 refers to TraesCS4B01G328600,
located on the chromosome 4B according to the IWGSC annotation). The position of each
TaNAC can be estimated using the scale on the left. The two circles show the chromosomal
regions studied as an example of duplication. (TIF)
S2 Fig. Exon number in the genomic sequence of the 488 TaNAC members. The percentage of sequences is indicated at the top of each histogram.
(TIF)
S3 Fig. Maximum likelihood phylogeny of the 361 consensus sequences using complete protein sequences. The blue and red boxes focused on the clades studied as case of duplica-tion. The number of exons is represented by a red (1 exon), pink (2 exons), yellow (3 exons), green (4 exons), clear blue (5 exons), dark blue (6 exons), or violet (7 and more exons) circle. (PDF)
S4 Fig. Structural conservation between the two regions of chromosomes 4B and 5A geno-mics sequences, revealed by dot plot analysis. Each gene location is indicated on the x- and y-axis by a blue arrow. Green and red dots indicate sense and antisense homologies respec-tively.
(TIF)
S5 Fig. Pearson correlations between duplicated genes of the studied 2A-2B-2D chromosomal regions during development (A) and stress (B).
(TIF)
S6 Fig. Biplot showing the first two variables of the principal component analysis (PC1 and PC2). Expression of the 23TaNAC genes in leaves and grains of Altigo (square) and
Allez-y (circle) genotypes at 220˚Cd (full form) and 450˚Cd (empty form) in irrigated (blue) and drought (red) conditions.
(TIF)
S1 Table. Blast results using Blast2Go software [92] on 488 TaNAC sequences. (XLSX)
S2 Table. List of primers used in this study. (XLSX)
S3 Table. TaNAC sequences and structural information extracted from the IWGS RefSeq v1.0 database and their TGAC correspondence.
(XLSX)
S4 Table. Duplicated fragments contained within the three genomes of the bread wheat, with a minimal length of 3 Kb and at least 90% of identity.
(XLSX)
S5 Table. Duplicated fragments contained between genomic regions of 4B and 5A chromo-somes of the bread wheat, with a minimal length of 2 Kb and at least 80% of identity. (XLSX)
S6 Table. Distribution of the differentially expressedTaNAC genes in response to heat and
drought stresses, alongside their logFC and the associated adjusted p-value. (XLSX)
S7 Table. Specific expression of 23TaNAC genes studied by RT-qPCR and their
ortholo-gues in other species [24,37,39,40,65,82,83,85,87,93–96]. The preferential expression have been verified by a Student Test, with an e-value threshold at 0.05.
(XLSX)
Acknowledgments
We would like to thank C. Dupuits and the Gentyane Plateform for their technical assistance.
Author Contributions
Conceptualization: Claire Gue´rin, Jane Roche, Said Mouzeyar, Mohamed Fouad Bouzidi. Data curation: Jane Roche, Catherine Ravel.
Formal analysis: Claire Gue´rin, Jane Roche, Mohamed Fouad Bouzidi. Methodology: Said Mouzeyar.
Resources: Vincent Allard.
Supervision: Mohamed Fouad Bouzidi.
Writing – original draft: Claire Gue´rin, Jane Roche, Vincent Allard, Said Mouzeyar, Mohamed Fouad Bouzidi.
Writing – review & editing: Claire Gue´rin, Catherine Ravel, Said Mouzeyar.
References
1. Harmer SL. The circadian system in higher plants. Annu Rev Plant Biol. 2009; 60:357–77.https://doi. org/10.1146/annurev.arplant.043008.092054PMID:19575587
2. Khan S-A, Li M-Z, Wang S-M, Yin H-J. Revisiting the Role of Plant Transcription Factors in the Battle against Abiotic Stress. Int J Mol Sci. 31 mai 2018; 19(6).
3. Franco-Zorrilla JM, Lo´pez-Vidriero I, Carrasco JL, Godoy M, Vera P, Solano R. DNA-binding specifici-ties of plant transcription factors and their potential to define target genes. Proc Natl Acad Sci USA. 11 fe´vr 2014; 111(6):2367–72.https://doi.org/10.1073/pnas.1316278111PMID:24477691
4. Riechmann JL, Heard J, Martin G, Reuber L, Jiang C, Keddie J, et al. Arabidopsis transcription factors: genome-wide comparative analysis among eukaryotes. Science. 15 de´c 2000; 290(5499):2105–10. PMID:11118137
5. Gahlaut V, Jaiswal V, Kumar A, Gupta PK. Transcription factors involved in drought tolerance and their possible role in developing drought tolerant cultivars with emphasis on wheat (Triticum aestivum L.). Theor Appl Genet. nov 2016; 129(11):2019–42.https://doi.org/10.1007/s00122-016-2794-zPMID:
27738714
6. Riechmann JL, Meyerowitz EM. The AP2/EREBP family of plant transcription factors. Biol Chem. juin 1998; 379(6):633–46. PMID:9687012
7. Uno Y, Furihata T, Abe H, Yoshida R, Shinozaki K, Yamaguchi-Shinozaki K. Arabidopsis basic leucine zipper transcription factors involved in an abscisic acid-dependent signal transduction pathway under drought and high-salinity conditions. Proc Natl Acad Sci USA. 10 oct 2000; 97(21):11632–7.https://doi. org/10.1073/pnas.190309197PMID:11005831
8. Jakoby M, Weisshaar B, Dro¨ge-Laser W, Vicente-Carbajosa J, Tiedemann J, Kroj T, et al. bZIP tran-scription factors in Arabidopsis. Trends Plant Sci. mars 2002; 7(3):106–11. PMID:11906833
9. Abe H, Urao T, Ito T, Seki M, Shinozaki K, Yamaguchi-Shinozaki K. Arabidopsis AtMYC2 (bHLH) and AtMYB2 (MYB) Function as Transcriptional Activators in Abscisic Acid Signaling. The Plant Cell. 1 janv 2003; 15(1):63–78.https://doi.org/10.1105/tpc.006130PMID:12509522
10. Fujita M, Fujita Y, Maruyama K, Seki M, Hiratsu K, Ohme-Takagi M, et al. A dehydration-induced NAC protein, RD26, is involved in a novel ABA-dependent stress-signaling pathway. Plant J. sept 2004; 39 (6):863–76.
11. Tran L-SP, Nakashima K, Sakuma Y, Simpson SD, Fujita Y, Maruyama K, et al. Isolation and functional analysis of Arabidopsis stress-inducible NAC transcription factors that bind to a drought-responsive cis-element in the early responsive to dehydration stress 1 promoter. Plant Cell. sept 2004; 16(9):2481–98.
12. Tran L-SP, Nakashima K, Sakuma Y, Osakabe Y, Qin F, Simpson SD, et al. Co-expression of the stress-inducible zinc finger homeodomain ZFHD1 and NAC transcription factors enhances expression of the ERD1 gene in Arabidopsis. Plant J. janv 2007; 49(1):46–63.https://doi.org/10.1111/j.1365-313X. 2006.02932.xPMID:17233795
13. Yanhui C, Xiaoyuan Y, Kun H, Meihua L, Jigang L, Zhaofeng G, et al. The MYB Transcription Factor Superfamily of Arabidopsis: Expression Analysis and Phylogenetic Comparison with the Rice MYB Family. Plant Mol Biol. 1 janv 2006; 60(1):107–24.https://doi.org/10.1007/s11103-005-2910-yPMID:
16463103
14. Lata C, Prasad M. Role of DREBs in regulation of abiotic stress responses in plants. J Exp Bot. oct 2011; 62(14):4731–48.https://doi.org/10.1093/jxb/err210PMID:21737415
15. Zhu X, Liu S, Meng C, Qin L, Kong L, Xia G. WRKY Transcription Factors in Wheat and Their Induction by Biotic and Abiotic Stress. Plant Molecular Biology Reporter. oct 2013; 31(5):1053–67.
16. Huang Q, Wang Y, Li B, Chang J, Chen M, Li K, et al. TaNAC29, a NAC transcription factor from wheat, enhances salt and drought tolerance in transgenic Arabidopsis. BMC Plant Biol. 4 nov 2015; 15:268.
https://doi.org/10.1186/s12870-015-0644-9PMID:26536863
17. Nuruzzaman M, Manimekalai R, Sharoni AM, Satoh K, Kondoh H, Ooka H, et al. Genome-wide analysis of NAC transcription factor family in rice. Gene. 1 oct 2010; 465(1–2):30–44.https://doi.org/10.1016/j. gene.2010.06.008PMID:20600702
18. Zhu G, Chen G, Zhu J, Zhu Y, Lu X, Li X, et al. Molecular Characterization and Expression Profiling of NAC Transcription Factors in Brachypodium distachyon L. PLOS ONE. 7 oct 2015; 10(10):e0139794.
https://doi.org/10.1371/journal.pone.0139794PMID:26444425
19. Pinheiro G, Marques C, Costa M, A.B. Reis P, Alves M, Carvalho C, et al. Complete inventory of soy-bean NAC transcription factors: Sequence conservation and expression analysis uncover their distinct roles in stress response. Gene. 1 juill 2009; 444:10–23.https://doi.org/10.1016/j.gene.2009.05.012
PMID:19497355
20. Lu M, Sun Q-P, Zhang D-F, Wang T-Y, Pan J-B. Identification of 7 stress-related NAC transcription fac-tor members in maize (Zea mays L.) and characterization of the expression pattern of these genes. Bio-chem Biophys Res Commun. 26 juin 2015; 462(2):144–50.https://doi.org/10.1016/j.bbrc.2015.04.113
PMID:25937463
21. Saidi MN, Mergby D, Brini F. Identification and expression analysis of the NAC transcription factor fam-ily in durum wheat (Triticum turgidum L. ssp. durum). Plant Physiol Biochem. mars 2017; 112:117–28.
https://doi.org/10.1016/j.plaphy.2016.12.028PMID:28064119
22. Moyano E, Martı´nez-Rivas FJ, Blanco-Portales R, Molina-Hidalgo FJ, Ric-Varas P, Matas-Arroyo AJ, et al. Genome-wide analysis of the NAC transcription factor family and their expression during the development and ripening of the Fragaria×ananassa fruits. PLOS ONE. 3 mai 2018; 13(5):e0196953.
https://doi.org/10.1371/journal.pone.0196953PMID:29723301
23. Ooka H, Satoh K, Doi K, Nagata T, Otomo Y, Murakami K, et al. Comprehensive analysis of NAC family genes in Oryza sativa and Arabidopsis thaliana. DNA Res. 31 de´c 2003; 10(6):239–47. PMID:
15029955
24. Mathew IE, Das S, Mahto A, Agarwal P. Three Rice NAC Transcription Factors Heteromerize and Are Associated with Seed Size. Front Plant Sci. 2016; 7:1638.https://doi.org/10.3389/fpls.2016.01638
PMID:27872632
25. Xie Q, Frugis G, Colgan D, Chua NH. Arabidopsis NAC1 transduces auxin signal downstream of TIR1 to promote lateral root development. Genes Dev. 1 de´c 2000; 14(23):3024–36. PMID:11114891
26. Hao Y-J, Wei W, Song Q-X, Chen H-W, Zhang Y-Q, Wang F, et al. Soybean NAC transcription factors promote abiotic stress tolerance and lateral root formation in transgenic plants. Plant J. oct 2011; 68 (2):302–13.https://doi.org/10.1111/j.1365-313X.2011.04687.xPMID:21707801
27. Olsen AN, Ernst HA, Leggio LL, Skriver K. NAC transcription factors: structurally distinct, functionally diverse. Trends Plant Sci. fe´vr 2005; 10(2):79–87.https://doi.org/10.1016/j.tplants.2004.12.010PMID:
15708345
28. Kim S-G, Lee S, Seo PJ, Kim S-K, Kim J-K, Park C-M. Genome-scale screening and molecular charac-terization of membrane-bound transcription factors in Arabidopsis and rice. Genomics. janv 2010; 95 (1):56–65.https://doi.org/10.1016/j.ygeno.2009.09.003PMID:19766710
29. Souer E, van Houwelingen A, Kloos D, Mol J, Koes R. The no apical meristem gene of Petunia is required for pattern formation in embryos and flowers and is expressed at meristem and primordia boundaries. Cell. 19 avr 1996; 85(2):159–70. PMID:8612269
30. Sablowski RW, Meyerowitz EM. A homolog of NO APICAL MERISTEM is an immediate target of the flo-ral homeotic genes APETALA3/PISTILLATA. Cell. 9 janv 1998; 92(1):93–103. PMID:9489703
31. Guo Y, Gan S. AtNAP, a NAC family transcription factor, has an important role in leaf senescence. Plant J. mai 2006; 46(4):601–12.https://doi.org/10.1111/j.1365-313X.2006.02723.xPMID:16640597
32. Mitsuda N, Seki M, Shinozaki K, Ohme-Takagi M. The NAC transcription factors NST1 and NST2 of Arabidopsis regulate secondary wall thickenings and are required for anther dehiscence. Plant Cell. nov 2005; 17(11):2993–3006.https://doi.org/10.1105/tpc.105.036004PMID:16214898
33. Kim Y-S, Kim S-G, Park J-E, Park H-Y, Lim M-H, Chua N-H, et al. A membrane-bound NAC transcrip-tion factor regulates cell division in Arabidopsis. Plant Cell. nov 2006; 18(11):3132–44.https://doi.org/ 10.1105/tpc.106.043018PMID:17098812
34. Kim S-G, Lee A-K, Yoon H-K, Park C-M. A membrane-bound NAC transcription factor NTL8 regulates gibberellic acid-mediated salt signaling in Arabidopsis seed germination. Plant J. juill 2008; 55(1):77– 88.https://doi.org/10.1111/j.1365-313X.2008.03493.xPMID:18363782
35. Uauy C, Distelfeld A, Fahima T, Blechl A, Dubcovsky J. A NAC Gene regulating senescence improves grain protein, zinc, and iron content in wheat. Science. 24 nov 2006; 314(5803):1298–301.https://doi. org/10.1126/science.1133649PMID:17124321
36. Liang C, Wang Y, Zhu Y, Tang J, Hu B, Liu L, et al. OsNAP connects abscisic acid and leaf senescence by fine-tuning abscisic acid biosynthesis and directly targeting senescence-associated genes in rice. Proc Natl Acad Sci USA. 8 juill 2014; 111(27):10013–8.https://doi.org/10.1073/pnas.1321568111