HAL Id: hal-01365546
https://hal.sorbonne-universite.fr/hal-01365546
Submitted on 13 Sep 2016
HAL is a multi-disciplinary open access
archive for the deposit and dissemination of
sci-entific research documents, whether they are
pub-lished or not. The documents may come from
teaching and research institutions in France or
abroad, or from public or private research centers.
L’archive ouverte pluridisciplinaire HAL, est
destinée au dépôt et à la diffusion de documents
scientifiques de niveau recherche, publiés ou non,
émanant des établissements d’enseignement et de
recherche français ou étrangers, des laboratoires
publics ou privés.
Distributed under a Creative Commons Attribution| 4.0 International License
Function in Adult and Results in a Resistance to High
Fat Diet-Induced Obesity
Céline Jousse, Yuki Muranishi, Laurent Parry, Christophe Montaurier, Patrick
Even, Jean-Marie Launay, Valérie Carraro, Anne-Catherine Maurin, Julien
Averous, Cédric Chaveroux, et al.
To cite this version:
Céline Jousse, Yuki Muranishi, Laurent Parry, Christophe Montaurier, Patrick Even, et al.. Perinatal
Protein Malnutrition Affects Mitochondrial Function in Adult and Results in a Resistance to High Fat
Diet-Induced Obesity. PLoS ONE, Public Library of Science, 2014, 9 (8), pp.e104896.
�10.1371/jour-nal.pone.0104896�. �hal-01365546�
Function in Adult and Results in a Resistance to High Fat
Diet-Induced Obesity
Ce´line Jousse1*, Yuki Muranishi1, Laurent Parry1, Christophe Montaurier1, Patrick Even2,
Jean-Marie Launay3, Vale´rie Carraro1, Anne-Catherine Maurin1, Julien Averous1, Ce´dric Chaveroux1, Alain Bruhat1, Jacques Mallet4, Be´atrice Morio1, Pierre Fafournoux1*
1 UMR1019 Nutrition Humaine, Institut National de la Recherche Agronomique (INRA), Universite´ Clermont 1, Saint Gene`s Champanelle, France, 2 Institut National de la Recherche Agronomique (INRA), AgroParisTech, UMR914 Nutrition Physiology and Ingestive Behavior, Paris, France,3 Service de Biochimie et Biologie Mole´culaire/Equipe Associe´e (EA) 3621, Assistance Publique des Hoˆpitaux de Paris (AP-HP), Hoˆpital Lariboisie`re, Faculte´ de Pharmacie, Universite´ Paris Descartes, Paris, France,4 Laboratoire de Ge´ne´tique Mole´culaire de la Neurotransmission et des Processus Neurode´ge´ne´ratifs, UMR7091, Universite´ Pierre et Marie Curie (UPMC) Paris Universite´/CNRS, Hoˆpital de la Pitie´-Salpeˆtrie`re, Paris, France
Abstract
Epidemiological findings indicate that transient environmental influences during perinatal life, especially nutrition, may have deleterious heritable health effects lasting for the entire life. Indeed, the fetal organism develops specific adaptations that permanently change its physiology/metabolism and that persist even in the absence of the stimulus that initiated them. This process is termed ‘‘nutritional programming’’. We previously demonstrated that mothers fed a Low-Protein-Diet (LPD) during gestation and lactation give birth to F1-LPD animals presenting metabolic consequences that are different from those observed when the nutritional stress is applied during gestation only. Compared to control mice, adult F1-LPD animals have a lower body weight and exhibit a higher food intake suggesting that maternal protein under-nutrition during gestation and lactation affects the energy metabolism of F1-LPD offspring. In this study, we investigated the origin of this apparent energy wasting process in F1-LPD and demonstrated that minimal energy expenditure is increased, due to both an increased mitochondrial function in skeletal muscle and an increased mitochondrial density in White Adipose Tissue. Importantly, F1-LPD mice are protected against high-fat-diet-induced obesity. Clearly, different paradigms of exposure to malnutrition may be associated with differences in energy expenditure, food intake, weight and different susceptibilities to various symptoms associated with metabolic syndrome. Taken together these results demonstrate that intra-uterine environment is a major contributor to the future of individuals and disturbance at a critical period of development may compromise their health. Consequently, understanding the molecular mechanisms may give access to useful knowledge regarding the onset of metabolic diseases.
Citation: Jousse C, Muranishi Y, Parry L, Montaurier C, Even P, et al. (2014) Perinatal Protein Malnutrition Affects Mitochondrial Function in Adult and Results in a Resistance to High Fat Diet-Induced Obesity. PLoS ONE 9(8): e104896. doi:10.1371/journal.pone.0104896
Editor: Herve´ Guillou, INRA, France
Received February 10, 2014; Accepted July 17, 2014; Published August 13, 2014
Copyright: ß 2014 Jousse et al. This is an open-access article distributed under the terms of the Creative Commons Attribution License, which permits unrestricted use, distribution, and reproduction in any medium, provided the original author and source are credited.
Funding: The study was funded by a grant from ANR (French Agency for Research, Epidiabesity). The Centre National pour la Recherche Scientifique (CNRS) provided salaries for CJ and PF. The funders had no role in study design, data collection and analysis, decision to publish, or preparation of the manuscript. Competing Interests: The authors have declared that no competing interests exist.
* Email: celine.jousse@clermont.inra.fr (CJ); pierre.fafournoux@clermont.inra.fr (PF)
Introduction
Metabolic diseases, including obesity and Type II Diabetes Mellitus (T2DM) are among the leading causes of disability in industrialized countries. These diseases have multifactorial causes that involve genetic and environmental factors and they often represent the tip of an iceberg of composite syndromes. Extensive epidemiological findings indicate that a key feature characteristic of these diseases is that transient environmental influences during perinatal life may have deleterious heritable health effects lasting for the entire life [1]. Among these environmental factors, nutrition plays a major role especially during critical windows of development. Indeed, the fetal organism is able to respond to nutritional stresses by specific adaptations at the cellular and molecular levels that permanently change the physiology and the metabolism of the organism and persist even in the absence of the
stress/stimulus that initiated them. This process is termed ‘‘nutritional programming’’.
There is a large number of well-established animal models that indicates a link between perinatal growth and phenotype in the adulthood. Currently, the most widely used animal model of nutritional programming is maternal under-nutrition. For exam-ple, female rats fed a Low Protein Diet (LPD) during gestation give birth to pups that exhibit a lower weight at birth but that catch up quickly during the early days of life. In their adulthood, they will be prone to develop glucose intolerance, especially when fed a high fat diet after weaning [2]. These adverse adult health outcomes are associated with permanent changes in the expression of genes involved in glucose homeostasis [3,4]. In that case, they display a higher vulnerability to obesity and diabetes reflecting an inappropriate match between metabolic programming by the diet
received during fetal life and the diet actually consumed after birth.
In a previous work, we reported that perinatal under-nutrition during both gestation and lactation affects the extent of methylation of the leptin promoter in adults and that this methylation is correlated with changes in leptin regulation [5]. However, regarding metabolic parameters, our findings are at variance with those described above highlighting the importance of the time window during which the maternal nutritional stress is applied. Indeed, our data demonstrated that maternal undernu-trition during gestation and lactation (F1-LPD animals) leads to metabolic consequences later in adulthood that are different from those observed when nutritional stress is applied during gestation only. Compared to control mice, F1-LPD animals have a lower body weight and exhibit a higher food intake suggesting that maternal protein under-nutrition during gestation and lactation affects the energy metabolism of F1-LPD offspring. In the present study, we investigated the origin of this apparent energy wasting process in F1-LPD mice and demonstrated that minimal energy expenditure is increased in F1-LPD animals, due to both an increased mitochondrial function in skeletal muscle and an increased mitochondrial density in White Adipose Tissue. Importantly, once adult, these mice are protected against high fat diet-induced obesity.
Methods and Materials Ethics Statement
Maintenance of the mice and all experiments were conducted according to the guidelines formulated by the European Com-munity for the use of experimental animals (L358-86/609/EEc) and were approved by the Institut National de la Recherche Agronomique (INRA, France). INRA animal facilities were approved by the French veterinary department (C634514).
Animal protocols
Balb/c mice (obtained from Charles River Laboratory) were used, and all animals were individually housed in plastic cages and subjected to a 12 h light/dark cycle at a temperature of 22uC (except otherwise indicated). All animals had ad libitum access to food and water at all times, unless otherwise indicated.
Experimental procedure
Twenty virgin 4-month old female Balb/c mice were used. Pairs of female mice were mated with a single male and, at plug date, were allocated into 2 groups fed either a diet containing 22% of protein (control diet; CD) or a diet containing 10% of protein (low protein diet; LPD) throughout gestation and lactation. Only litters of four to eight pups were included in subsequent experiments. At weaning at 4 weeks of age, the male offspring (called F1-CD and F1-LPD) were single-housed and were given standard chow diet (A03; SAFE) throughout life. The diets compositions have been previously described [5]. For each experiment, at least 6 representative males from at least 4 different litters were selected in each group.
High Fat diet challenge procedure
When indicated, at 5 months of age and for each experimental group, 8 male mice were switched to High Fat Diet (HFD) (D12451, Research Diet containing 24% Protein, 41% Carbohy-drates, 24% Fat), and 8 male mice were fed on Chow diet for 7 months.
Measurement of food intake
Mice were given ad libitum access to a known amount of pellets for 1 week. At the end of the test, left over food was weighed and the daily amount of food consumed was calculated as the mean intake in grams per day. The food intake is expressed in grams per day per g of Body Weight (BW) or per g of Lean Body Mass (LBM). When indicated, the food intake is expressed in daily Kcal intake calculated according to the nutritional values of each diet (3.2 kCal/g for Chow diet and 4.73 kCal/g for HFD).
Fat and lean mass determination
The individual mice were placed into restrain tube and inserted into the mouse EchoMRI-100 instrument (Echo Medical Systems LLC, Houston TX, USA) to determine both fat and lean mass (g). Total body weight was measured using a standard top-loading laboratory balance. Adiposity is expressed as a percentage of fat relative to total body weight.
Measurement of metabolites and hormones
The plasma glucose concentration was measured by using a glucose reagent strip and a glucometer (Glucotouch, Lifescan, Milpitas, CA). Insulin was measured by using an enzyme-linked immunosorbent assay kit purchased from Alpco Diagnostics (Salem, USA). Fasting plasma lipids (ie, triglycerides, total cholesterol and HDL cholesterol) were measured in plasma samples by using an automated system (Konelab 20; Thermo-Electron Corporation).
Indirect calorimetry and spontaneous activity
Dioxygen consumption (VO2), carbon dioxide production
(VCO2) and activity of F1-CD and F1-LPD mice were measured
under Lab Chow diet using a four-cage TSE System Pheno-Master/LabMaster (Bad Homburg, Germany). Energy expendi-ture was calculated using Weir’s equation (EE = 16.3 V02+4.57 VCO2) [6] from measurements of gas exchanges computed for each cage from data sampled every 5 min. Spontaneous activity was measured using a three dimensions meshing of light beams. Each cage has a volume of 4.9 l and the flow-rate was set to 0.4 l/ min. The O2 and CO2 analyzer were calibrated before each
measurement period. Ambient temperature was maintained at 28uC to reach the animal thermo-neutrality and the light was on from 08am to 08pm. During an adaptation period of twenty-four hours prior to data collection, mice were placed in separate calorimetry cages, with free access to food and water. Then VO2,
VCO2 and activity were monitored during 24 h while fed ad
libitum and thereafter, during 16 h while fasting. Daily energy expenditure and activity were computed from the 24 h period when animals were fed. Minimal energy expenditure was calculated as the mean value of the 4 last values at the end of the fasting period. The RQ was calculated as the ratio of VCO2to
VO2.
Body Temperature
Body temperature (degrees Celsius) was measured by using a rectal thermo-probe.
Tissue Collection
At 7 months of age, overnight starved male offspring were killed by pentobarbital overdose, blood was collected by decapitation and various tissues were isolated, frozen in Liquid Nitrogen and stored at 280uC until use. Epididymal white adipose tissue (WAT) was collected from areas surrounding the epididymis and testis, Brown adipose tissue (BAT) was collected from the interscapular
region and separated from the attached white adipose tissue, and Gastrocnemius was dissected.
Measurement of enzyme activities
Maximum activity of complexes II, III and IV (cytochrome c oxidase, COX) was assessed spectrophotometrically on tissue homogenates, as previously described by Barrientos et al. [7]. Citrate synthase activity was measured as described by Shepherd [8]. Complex I activity was measured on muscle homogenates using the Complex I Enzyme Activity Dipstick Assay Kit (MitoSciences #MS130). Briefly Complex I is immunocaptured and immuno-precipitated in active form on the dipstick. Secondly, the dipstick is immersed in Complex I activity buffer solution containing NADH as a substrate and nitrotetrazolium blue (NBT)
as the electron acceptor. Immunocaptured Complex I oxidizes NADH and the resulting H+ reduces NBT to form a blue-purple precipitate at the Complex I line on the dipstick. The signal intensity of this precipitate corresponds to the level of Complex I enzyme activity in the sample. The signal intensity is analyzed by a standard imaging system.
Mitochondrial density measurement
Total DNA was extracted from white adipose tissue and from gastrocnemius using phenol/chloroform/isoamyl alcohol (25:24:1) followed by ethanol precipitation. The content of mtDNA was calculated using real-time quantitative PCR by measuring the threshold cycle ratio (DCt) of a mitochondrial-encoded gene (COX1, forward 59-ACTATACTACTACTAACAGACCG-39,
Figure 1. Phenotypic characterization of F1 mice. A) Body weight of 7-mo-old F1-CD and F1-LPD male mice. Results are expressed in grams as means 6SEMfor at least 10 mice/group. *p#0.05. B) Body composition parameters of 7-mo-old F1-CD and F1-LPD male mice. Adiposity is expressed
as a percentage of fat relative to total body weight. Lean mass is expressed in grams. Brown Adipose Tissue weight is expressed as weight in mg relatively to the weight of each mouse. All values are means 6SEMfor at least 10 mice/group. *p#0.05. C) Food intake of 7-mo-old male F1-CD and
F1-LPD mice was measured as described in Materials and Methods. Values represent the weight of food consumed daily relatively to the total body weight (BW) or to the Lean Body Mass (LBM) of each mouse and are expressed as means 6SEMfor at least 10 mice/group. *p#0.05.
reverse 59-GGTTCTTTTTTTCCGGAGTA-39) versus a nucle-ar-encoded gene (cyclophilin A, forward 59-ACACGCCA-TAATGGCACTGG-39, reverse 59-CAGTCTTGGCAGTGCA-GAT-39).
Analysis of gene expression using real time RT-PCR
Total RNA was prepared using a RNeasy mini kit (Qiagen) and treated with DNase I, Amp Grade (InVitrogen, Carlsbad, CA, USA) prior to cDNA synthesis. RNA integrity was electrophoret-ically verified by ethidium bromide staining. RNA (0.5mg) was reverse transcribed with 100 U of Superscript II plus RNase H-Reverse Transcriptase (InVitrogen) using 100mM random hexa-mer prihexa-mers (Ahexa-mersham Biosciences, Piscataway, NJ, USA), according to the manufacturer’s instructions. Real-time quantita-tive PCR was carried out on a Bio-Rad CFX-96 detection system with quantitative Q-PCR SYBR Green reagents (Bio-Rad, Hercules, CA, USA) and with a primer concentration of 0.5mM. PCR conditions were standardized to 40 cycles of 95uC for 10 s and 59uC for 30 s with the primers for specific mouse mRNA sequences (For a list of primer sequences, see Table S1). To control for RNA quality and cDNA synthesis, b-actin or Nono mRNA was also amplified. The abundance of each RNA normalized to the HPRT1 or Nono signal depending on the tissue are expressed as the mean 6 SEM of at least 6 samples.
Protein Analyses by SDS-PAGE Western Blotting
Total proteins were extracted from various tissues using a lysis buffer consisting in 150 mM NaCl, 50 mMTris pH 7,4, 2.5 mM EGTA, 1% Triton X-100, 0.15% CHAPS, 0.5% DOC, 1 mM DTT with the addition of protease and phosphatase inhibitors (Sigma-Aldrich #P8340 and #P0044). Alternatively, for anti-UCP2 western Blotting, proteins were extracted using a High Salt buffer consisting in 25 mM HEPES, 0.4 M NaCl, 1.5 mM MgCl2,
0.2 mM EDTA, 1% NP40 with the addition of protease and phosphatase inhibitors (Sigma-Aldrich #P8340 and #P0044). Measurement of protein concentration was performed using the Bradford protein assay kit (BioRad#500-0006). Total protein extracts containing 20mg of protein were suspended in Laemmli buffer (final concentration: 60 mM Tris-HCl pH 6.8, 2% SDS, 10% glycerol, 0.01% bromophenol blue, 10 mM dTT), and boiled for 5 min. Proteins were separated by electrophoresis and
transferred to polyvinylidene fluoride membranes. The mem-branes were incubated for 1 hour at room temperature with 5% fat-free milk Tris-buffered saline containing 0.1% Tween-20 (TBS-T). The membranes were then incubated overnight at 4uC with the primary antibody diluted 1/1000e in 5% BSA containing TBS-T: anti-CoxIV (Molecular probes #A21348), anti-Porin (Biovision #3594-100), anti-UCP2 (BioLegend #615901), anti-b-Actin (Santa Cruz Biotechnology #sc-47778). After washing in TBS-T, membranes were incubated for 1 hour at room temper-ature with the secondary antibody diluted 1/5000e in 5% fat-free milk TBS-T (Santa Cruz: goat anti-mouse IgG-HRP sc-2031 for anti-CoxIV and anti-b-Actin and goat anti-rabbit IgG-HRP sc-2030 for anti-Porin and anti-UCP2). After washing in TBS-T, Luminata western HRP substrate (Millipore) and a chemilumi-nescence imager (G:Box, Syngene) were used to detect the signals.
Statistical Analysis
Results are reported as mean 6 SEM. Unpaired t-tests were used to analyze perinatal undernutrition effect (CD versus F1-LPD). P lower than 0.05 was considered as significant.
Results
Maternal malnutrition affects energy expenditure in adult offspring
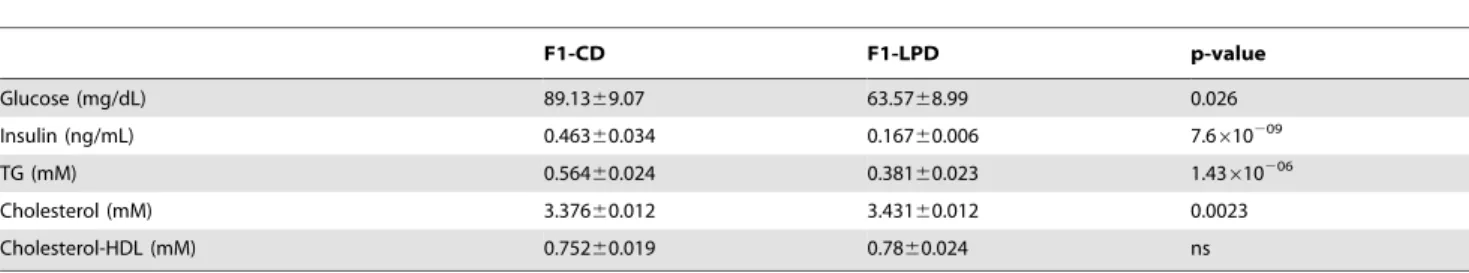
Pregnant and suckling female Balb/c mice were fed either a control diet (CD) or a low protein diet (LPD). After weaning, the F1-CD and F1-LPD male offspring, born respectively to CD- or LPD-fed mothers were fed on a Lab Chow Diet [5]. Figure 1 shows that, once adult, the F1-LPD mice have paradoxical metabolic characteristics. Compared to the F1-CD, adult F1-LPD mice have a lower body weight (Figure 1A), and a lower adiposity and lean mass (Figure1 B) but similar brown adipose tissue weight comparatively to total body weight. However, the food intake of the F1-LPD males is significantly increased compared to F1-CD (Figure 1C) no matter the normalization (total Body weight or Lean Body Mass). Moreover several physiological parameters are affected in F1-LPD mice as detailed in Table 1. Glucose, insulin and triglycerides levels are significantly decreased in plasma of F1-LPD mice. Overall, these results suggest that maternal protein undernutrition during gestation and lactation affects feed
efficien-Figure 2. Calorimetric parameters of F1 mice. A) Minimum Energy Expenditure, Daily Energy Expenditure and Respiratory Quotient (RQ) of 7-mo-old male F1-CD and F1-LPD mice were measured by indirect calorimetry as described in Materials and Methods. Energy Expenditure is expressed as kJ per day relatively to the total body weight (BW) or to the Lean Body Mass (LBM) of each mouse. Values are the mean 6SEMfor 6 mice/group.
*p#0.05. B) Body temperature (uC) of 7-mo-old male F1-CD and F1-LPD mice were measured using a rectal thermoprobe. Values are expressed as the mean temperature 6SEMfor at least 10 mice/group. *p#0.05. C) Spontaneous locomotor activity of 7-mo-old male F1-CD and F1-LPD mice were measured in the home cage using infrared light-beam. Values are expressed as the mean distance (10+03cm) 6SEMfor 6 mice/group. *p#0.05.
doi:10.1371/journal.pone.0104896.g002
Table 1. Physiological parameters.
F1-CD F1-LPD p-value Glucose (mg/dL) 89.1369.07 63.5768.99 0.026 Insulin (ng/mL) 0.46360.034 0.16760.006 7.6610209 TG (mM) 0.56460.024 0.38160.023 1.43610206 Cholesterol (mM) 3.37660.012 3.43160.012 0.0023 Cholesterol-HDL (mM) 0.75260.019 0.7860.024 ns
Plasma metabolites and hormones parameters of 7-mo-old male F1-CD and F1-LPD mice were measured in plasma of over-night starved animals and are expressed as means 6SEMfor n = 10 (Glucose) or n = 25 (Insulin, TG, Cholesterol, Cholesterol-HDL).
cy (i.e. the body weight gain per unit of energy consumed) as well as glucose and lipid homeostasis. Therefore, we quantified the components of total energy expenditure in F1-CD and F1-LPD animals by performing indirect calorimetry experiments. Fig-ure 2A shows that both minimal energy expenditFig-ure and daily energy expenditure are significantly increased in F1-LPD com-pared to F1-CD animals, no matter the normalization (total Body weight or Lean Body Mass). Moreover, respiratory quotient (RQ) was lower in F1-LPD compared to F1-CD mice indicating an increased fat oxidation. Energy expenditure referring to the amount of energy used for thermogenesis, physical activity and performance of cellular and organ function, we thus measured body temperature and activity. Figure 2 clearly shows that both rectal temperature (Figure 2B) and activity (Figure 2C) are significantly increased in F1-LPD mice compared to F1-CD animals. It is noticeable that it is the diurnal activity of the mice that is mainly affected.
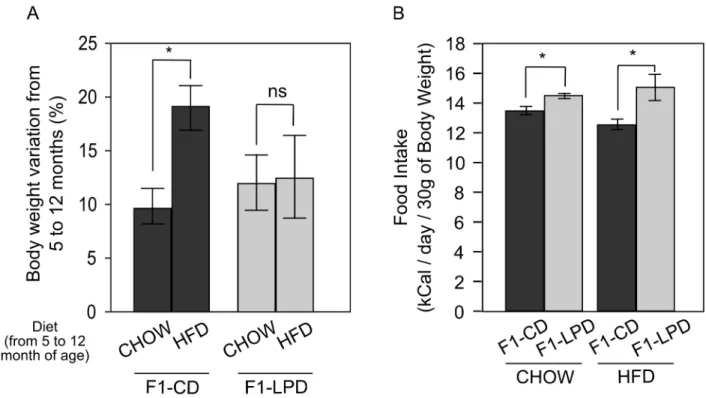
F1-LPD mice are resistant to high fat diet-induced obesity
According to the phenotype described above, one could hypothesize that F1-LPD mice may be resistant to High Fat Diet (HFD)-induced obesity. At the age of 5 months, CD and F1-LPD males were fed either a Chow Diet (Chow) or HFD for 7 months. Figure 3A shows that HFD caused a significant increase in body weight of the F1-CD mice compared to Chow-fed animals. The same nutritional challenge did not increase the body weight gain of F1-LPD mice over the same period of time. These data show that F1-LPD mice are resistant to HFD-induced obesity. It is also noticeable that the higher food intake observed in Chow-fed F1-LPD compared to Chow-fed F1-CD mice is still
measured in HFD-fed F1-LPD compared to HFD-fed F1-CD mice (Figure 3B). These results suggest that the resistance of F1-LPD mice to HFD-induced obesity is not due to a modification of food intake but rather to an adaptative increase in energy expenditure.
Effects of perinatal malnutrition on mitochondrial function
We next hypothesized that the metabolic origin of the phenotype described above in F1-LPD mice could be due to adaptations in mitochondrial functions. In order to investigate this hypothesis, we measured by qRT-PCR the expression of several genes encoding proteins involved in the mitochondrial function in epididymal White Adipose Tissue (WAT), Brown Adipose Tissue (BAT), andgastrocnemius muscle from either F1-CD or F1-LPD 7-months-old adult males fed a Chow-Diet since weaning. These tissues were chosen on the basis of their importance regarding the regulation of energy expenditure.
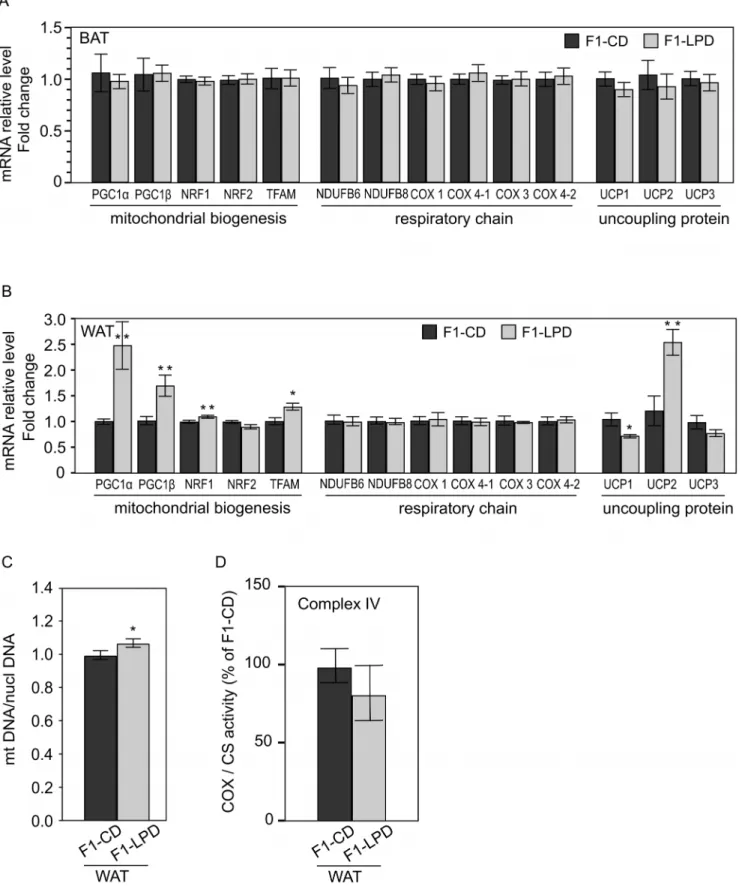
Figure 4A shows that no modification was found in the expression of genes tested in BAT, and Figure 4B shows that, in WAT, none of the genes encoding respiratory subunits that have been measured presented any modification of expression. This is coherent with the lack of modification of COX/CS activity observed (Figure 4C). However in WAT, we found that PGC1a, PGC1b, NRF1 and TFAM gene expression are increased in F1-LPD mice (Figure 4B) suggesting that mitochondrial biogenesis may be affected. These results are coherent with the increased in mitochondrial DNA relative to nuclear DNA in the same tissue (Figure 4D). To strengthen this result, we performed, in WAT, a quantification of protein commonly used as markers of mitochon-drial density like Porin protein level (by Western Blot) and citrate
Figure 3. Weight gain and food intake of F1 mice subjected to HFD. Five-mo-old F1-CD and F1-LPD male mice were fed for 7 months with either a Chow diet or a HFD. A) Body weight variation was determined at the end of the diet challenge as a percentage of the initial body weight and is expressed as a mean 6SEMfor at least 8 mice/group. *p#0.05. B) Food intake of 12-mo-old Chow or HFD-fed F1-CD and F1-LPD male mice was measured as described in Materials and Methods. Values represent the weight of food consumed daily (kCal) relatively to the weight of each mouse and are expressed as means 6SEMfor at least 8 mice/group. *p#0.05.
Figure 4. mRNA expression levels in Brown and White Adipose Tissue, Cytochrome C Oxidase and Citrate Synthase Activities and Mitochondrial DNA content in White Adipose Tissue of F1 mice. A, B) mRNA expression levels of genes encoding proteins involved in the mitochondrial function in (A) Brown Adipose Tissue (BAT) and (B) White Adipose Tissue (WAT) from 7-months-old F1-CD and F1-LPD males mice. mRNA relative levels are normalized relatively to Nono expression level and expressed as fold change relative to the control value measured in F1-CD. Values are means 6SEMfor at least 8 mice/group. **p#0.05, *p#0.08. C) Cytochrome C Oxidase (COX = Complex IV) and Citrate Synthase (CS) activities are measured in WAT from 7-months-old F1-CD and F1-LPD males mice and expressed as a percentage of the COX/CS ratio of F1-CD mice. Values are means 6SEMfor at least 8 mice/group. D) Mitochondrial density is estimated by measuring the mitochondria DNA (mtDNA) content
synthase (enzymatic activity). We found that F1-LPD mice tend to have both a higher expression of Porin (Figure S1A and B) and a higher Citrate synthase activity (Figure S2). However, even thought these differences failed to reach significativity, these results tend to confirm and are coherent with the overall results presented in Figures 4B and 4C. It is also noticeable that UCP2 gene expression (Figure 4B) and protein level (Figure S1A and B) was found to be strongly increased. This higher expression of UCP2 could play a role in the resistance to obesity as suggested by Fleury et al. [9]. Moreover the lack of expression of UCP1 in WAT suggests that no beige Adipose Tissue can be detected in the WAT of F1-LPD mice.
Thereafter, we chose to explore thegastrocnemius muscle for several reasons: firstly because it is a quantitatively important tissue and secondly because it is a mixed muscle, which metabolism can be considered as representative of the whole body musculature. In gastrocnemius, the mRNA expression of several of the tested COX subunit (Cytochrome-c Oxidase) is specifically induced in F1-LPD mice (Figure 5A), suggesting a modification of the expression of complex IV. To confirm this hypothesis, we measured the activity of the mitochondrial Complex I, II, III and IV in gastrocnemius extract from F1-CD and F1-LPD animals. Whereas the activity of the Complex I, II and III are not significantly affected by perinatal malnutrition (Figure 5C), we found that complex IV activity was indeed significantly increased in the F1-LPD muscle (Figure 5D, right panel). This result was confirmed by a western blot analysis against the sub-unit IV (COX-IV) of the complex IV and we found that, indeed, the protein level is increased in F1-LPD animals compared to F1-CD animals (Figure 5D-left panel and Figure S1C and D). Surprisingly, we found that mitochondrial DNA relative to nuclear DNA ratio shows a significant decrease in muscle mitochondrial content (Figure 5B) indicating a decrease in mitochondrial density in the muscle. To strengthen this result, we performed, in gactrocnemius, a quantification of protein commonly used as markers of mitochondrial density like Porin protein level (by Western Blot) and citrate synthase (enzymatic activity). We found that F1-LPD mice tend to have both a lower expression of Porin (Figure S1C and D) and a lower Citrate synthase activity (Figure S2). However, even thought these differences failed to reach significativity, these results tend to confirm the decrease in mitochondrial content shown in Figure 5B. Even thought his finding is striking, it could be hypothesized that it is related to an increased respiratory chain decoupling [10,11] (i.e. to slip induction/trigger in COX) and to an enhanced thermogenesis [12]. Such an observation suggests that mitochondrial adaptations in F1-LPD muscle may be a cause of energy wasting. This has been rarely described in physiological situations [11,12], but it is in agreement with the enhanced body temperature and minimal energy expenditure observed in LPD mice compared to F1-CD.
To explore more extensively the hypothesis of an increase in muscle oxidative capacity, we quantified, the proportion of the different type of fibers in gastrocnemius of 7-months-old F1-CD and F1-LPD males. mRNA level of the 4 different types of Myosin Heavy Chain (MHC-I, MHC-IIa, MHC-IIb, MHC-IIx) was assessed by qRT-PCR. As shown Figure 5E, F1-LPD mice exhibit a significant increase in type I muscle fibers in the gastrocnemius muscle compared to F1-CD mice. Data from literature suggest
that a greater proportion of type I fibers may be associated with a greater capacity for fat oxidation, which would favor resistance to body fat accumulation [13]. Overall, these data support the F1-LPD resistance against a HFD-induced obesity.
Discussion
Metabolic diseases have multiple origins, including genetic and environmental factors and their patho-physiological characteristics are diverse and complex. Transient environmental influences, such as a nutritional stress during perinatal life, may have deleterious long lasting health effects that may last for the entire life of affected individuals [1], suggesting a fetal origin of metabolic diseases, a field that have been of growing interest in the last years. Moreover, the association of Type II diabetes with obesity and inactivity suggests an important link between energy homeostasis and the onset of metabolic disease [14]. Given the central role for mitochondria in energy metabolism, disordered mitochondrial function at the cellular level can impact whole-body metabolic homeostasis. Thus, the hypothesis that defective or insufficient mitochondrial function might play a potentially pathogenic role in mediating risk of T2DM and obesity has emerged in recent years. It is of great interest to note that different experimental paradigms of perinatal exposure to under-nutrition or over-nutrition may be associated 1) with different phenotype in the adult offspring regarding energy expenditure, food intake and body weight 2) with different susceptibilities to various symptoms associated with the metabolic syndrome. For example, when female mice are subjected to under-nutrition only during gestation (and not during lactation), offspring have a lower birth weight and catch up quickly during early days of life (personal unpublished data and for review, see [15]). In the present study, however, we used a mouse model of adult offspring whose mothers have been fed a Low Protein Diet (F1-LPD) during gestation and lactation. We have previously shown that these animals have a lower body weight compared to the control and that they do not experience catch up growth even thought they increase their food intake [5]. However, it is important to note that results may vary depending on the specie (Rats vs mice) and on the exact nature of the diet. This may explain the apparent contradiction of our results with those of other publications showing an increase in visceral adipose tissue in a rat model of maternal protein restriction [16]. In the contrary, our results are coherent with epidemiological studies showing that two different famines produced different phenotype in the descendants depending on whether catch-up growth during early childhood occurred (Netherland cohort) or not (Leningrad cohort) as reviewed in [17].
Considering the blood parameters measured, our results are coherent with a resistance to the development of metabolic syndrome, as stated in the medical definition of this syndrome (Metabolic syndrome corresponds to elevated fasting plasma glucose, high serum triglycerides, low high-density cholesterol (HDL) levels). Importantly, we also showed that, once adult, these mice are protected against a high fat diet-induced obesity later in life. We thus investigated the hypothesis of an energy wasting process observed in these animals. We showed that the energy wasting process could be explained by an increase in energy expenditure in F1-LPD animals associated with a higher fat oxidation. The increased spontaneous activity related to foraging
relatively to the nuclear DNA (nuclDNA) content in White Adipose Tissue. mtDNA/nuclDNA ratio was calculated as the ratio of COX1 to cyclophilin A DNA levels, determined by real-time PCR, in DNA extracted from White Adipose Tissue of 7-months-old F1-CD and F1-LPD males mice. Results were normalized by the mean value of the control condition set to 1 unit. *p#0.05.
of the F1-LPD animals probably does not significantly participate to the increased energy expenditure because we also observed a significantly higher elevated body temperature and minimal energy expenditure that both suggest that an elevated resting metabolic rate is probably the main factor responsible for the elevated total energy expenditure and consequently to the resistance to an obesogenic diet. In that context, we showed that the increased energy expenditure is most likely due to specific mitochondrial adaptations in WAT and skeletal muscle, which potentially result in enhanced decoupling and thermogenesis. Altogether, our investigations showed that mitochondrial function is affected by perinatal undernutrition in WAT and muscle. Even thought the mRNA expression of none of the genes that has been tested was found to be modified in F1-LPD BAT, it would be interesting to further address, by using specific experiments, the role of this tissue in the phenotype of F1-LPD mice.
It has been shown that UCP2 have significant effects on obesity in mice, and that its mechanism of action may include alterations of lipid metabolism and metabolic rate [18]. In WAT, we observed a marked induction of UCP2 in F1-LPD animals, which can leads to two consequences. Firstly, a high UCP2 activity can prevent lipid storage by facilitating fatty acid oxidation. We indeed observed a reduced RQ reflecting a relatively higher rate of lipid oxidation in F1-LPD mice that can explain the low adiposity of these animals. Secondly, it could also be expected that, by uncoupling the oxidative phosphorylation (OXPHOS), the higher expression of UCP2 could participate to the observed increase in energy expenditure. Enhanced UCP2 gene and/or protein expression has been reported in several animal models of resistance to obesity [19–24]. These mechanisms are also supported by findings from Horvath et al [25] using mice moderately overexpressing UCP2.
In muscle, maternal under-nutrition differently affects mito-chondrial function compared to what is observed in WAT. Strikingly, we observed a higher activity of the mitochondrial complex IV in F1-LPD compared to F1-CD. This finding was specific to complex IV since the maximal activity of the complexes I, II and III was similar between F1-LPD and F1-CD. It is of importance to note that Capaldi et al [26] reported that Complex IV is found in <5 fold excess over the other electron transport complexes of the mitochondria, which may indicate the physio-logical significance of excess complex IV [27]. This adaptation can be related to enhanced slipping processes within complex IV, which may be related to an energetic wasting process associated with an enhanced energy expenditure and an increased thermo-genesis [12]. This observation is striking since mitochondrial density seems to be reduced in F1-LPD compared to F1-CD, thus
suggesting that a unique adjustment of muscle mitochondrial function occurs in response to perinatal protein malnutrition. Such adaptations have been rarely described in physiological situations, but were reported in vitro for example in response to high doses of the local anesthetic bupivacaine [10,11], or in response to long-term treatment with dexamethasone [28]. The increased mRNA expression of complex IV subunits reported in the present study implies a coordinated stimulation of transcription of both nuclear and mitochondrial genomes, but the molecular mechanisms involved in those effects are poorly understood. From in vitro approaches, Desquiret et al. [28] reported that the specific increase in complex IV enzymatic activity was mediated through the cytosolic glucocorticoid receptor in response to dexamethasone treatment, but the involvement of such a mechanism is not known to date in the context of maternal under-nutrition. Complex IV is the key regulator of the respiratory chain activity; it possesses a low capacity of reserve but exerts a large control on endogenous respiration rate [29]. Its increased activity in our study indicates a compensatory adaptation to uncoupled conditions and decreased oxidative phosphorylation efficiency. This is in agreement with the enhanced body temperature and minimal energy expenditure observed in F1-LPD mice compared to F1-CD. It also supports the F1-LPD resistance against a high fat diet-induced obesity. In the same way, our results regarding type I fiber increase in gastrocnemius of F1-LPD animals is coherent with the conclusion of Abou Mradet al. stating that preexisting differences in muscle fiber composition may play a role in determining susceptibility to dietary obesity [13].
Our findings are consistent with the hypothesis that epigenetic modifications acquired during the early life may condition mitochondrial function in several tissues in later life. We have already shown that in the same nutritional model, the leptin gene regulation is affected by perinatal undernutrition via a modifica-tion in its promoter methylamodifica-tion. Further studies are now required to understand the epigenetic imprinting caused by perinatal nutrition on key genes regulating mitochondrial biogenesis and function. It has been previously demonstrated that mitochondrial function can be modified by a nutritional challenge. Indeed, changes in mitochondrial number and function in skeletal muscle and WAT in response to a high-fat-diet have been previously published [30–32]. Several studies revealed that mitochondria might be a target for fetal programming [33–37]. All these studies were conducted using a rat model of maternal malnutrition leading to a phenotype associated with catch up growth. For example, it was shown that malnutrition during the gestation period affects the mitochondrial function in pancreatic islets of the adult offspring leading to loss of pancreatic islet function and
Figure 5. mRNA expression levels, Mitochondrial DNA content, Complex I, II and III activities, COX-IV protein content, Cytochrome C Oxidase and Citrate Synthase Activities and mRNA expression levels of Myosin Heavy Chain types in Gastrocnemius of F1 mice. A) mRNA expression levels of genes encoding proteins involved in the mitochondrial function in Gastrocnemius from 7-months-old CD and F1-LPD males mice. mRNA relative levels are normalized relatively to HPRT1 expression level and expressed as fold change relative to the control value measured in F1-CD. Values are means 6SEMfor at least 8 mice/group. *p#0.05. B) Mitochondrial density is estimated by measuring the mitochondria DNA (mtDNA) content relatively to the nuclear DNA (nuclDNA) content in Gastrocnemius from 7-months-old F1-CD and F1-LPD males mice. mtDNA/ nuclDNA ratio was calculated as the ratio of COX1 to cyclophilin A DNA levels, determined by real-time PCR, in DNA extracted from gastrocnemius of 7-months-old F1-CD and F1-LPD males mice. Results were normalized by the mean value of the control condition set to 1 unit. *p#0.05. C) Complex I, II and III and Citrate Synthase (CS) activities are measured in gastrocnemius from 7-months-old F1-CD and F1-LPD males mice and expressed as a percentage of the Cplx/CS ratio of F1-CD mice. Values are means 6SEMfor at least 8 mice/group. D) Left panel: Cytochrome C Oxidase Sub-Unit IV
(COX-IV) protein level was assessed by western blotting in gastrocnemius from 7-months-old F1-CD and F1-LPD males mice. Histograms shown represent a densitometrical quantification after Porin normalization. Values are means 6 SEMfor at least 4 mice/group. *p#0.05. Right panel:
Cytochrome C Oxidase (COX) and Citrate Synthase (CS) activities are measured in gastrocnemius from 7-months-old F1-CD and F1-LPD males mice and expressed as a percentage of the COX/CS ratio of F1-CD mice. Values are means 6SEMfor at least 8 mice/group. *p#0.05. E) mRNA expression levels of the 4 different types of Myosin Heavy Chain (MHC-I, MHC-IIa, MHC-IIb, MHC-IIx) in Gastrocnemius from 7-months-old F1-CD and F1-LPD males mice. mRNA relative levels are normalized relatively to HPRT1 expression level and expressed as fold change relative to the control value measured in F1-CD. Values are means 6SEMfor at least 8 mice/group. *p#0.05.
finally to insulin resistance [38]. In our mouse model of maternal undernutrition, however, we generate mice exhibiting an opposite phenotype (resistance to diet-induced-obesity, no insulin resis-tance). We indeed also observed a mitochondrial function modification in our model but this modification leads to a higher oxidative capacity in muscle, correlated with an increased energy expenditure, which is coherent with our phenotype. Clearly, different paradigms of exposure to under-nutrition or over-nutrition may be associated with different metabolisms of energy expenditure, food intake, weights and different susceptibilities to various symptoms associated with the metabolic syndrome. Taken together these results demonstrate that intra-uterine environment is a major contributor to the future of individuals and disturbance at a critical period of development may compromise their health. Consequently, understanding the molecular mechanisms may give access to useful knowledge regarding the onset of metabolic diseases.
Supporting Information
Figure S1 Western Blot and densitometrical quantifica-tion in Muscle and WAT for Porin, b-Actin, COX IV and UCP2. A) Western Blot analysis of UCP2, Porin and b-Actin protein level in WAT from 7-months-old F1-CD and F1-LPD males mice. B) Densitometrical intensity ratio of Porin and UCP2 protein level normalized to b-Actin. Values are means 6SEMfor
at least 4 mice/group. *p#0.05. C) Western Blot analysis of
COX-IV, Porin and b-Actin protein level in Gasctrocnemius from 7-months-old F1-CD and F1-LPD males mice. D) Densitometrical intensity ratio of Porin and COX-IV protein level normalized to b-Actin. Values are means 6SEMfor at least 4 mice/group. *p#
0.05. (TIF)
Figure S2 Citrate Synthase activity in muscle and WAT. Citrate Synthase activity is measured in WAT and Gastrocnemius from 7-months-old F1-CD and F1-LPD males mice and expressed in mmol/min/mg. Values are means 6SEMfor at least 8 mice/
group. (TIF)
Table S1 Sequences of mouse qPCR primers. Sequences of mouse-specific primers used for qPCR analysis.
(PDF)
Acknowledgments
The authors thank Anne Terrisse for animal care, Fre´de´ric Capel and Je´rome Salles for helpful discussion and for providing reagents and Jennifer Rieusset for providing reagents.
Author Contributions
Conceived and designed the experiments: CJ PF BM. Performed the experiments: CJ YM LP PE JML VC. Analyzed the data: CJ YM LP CM PE ACM JA CC AB. Wrote the paper: CJ JM BM PF PE.
References
1. Barker DJ (1995) Intrauterine programming of adult disease. Mol Med Today 1: 418–423.
2. Desai M, Byrne CD, Meeran K, Martenz ND, Bloom SR, et al. (1997) Regulation of hepatic enzymes and insulin levels in offspring of rat dams fed a reduced-protein diet. Am J Physiol 273: G899–G904.
3. Holness MJ, Langdown ML, Sugden MC (2000) Early-life programming of susceptibility to dysregulation of glucose metabolism and the development of Type 2 diabetes mellitus. Biochem J 349 Pt 3: 657–665.
4. Ozanne SE, Smith GD, Tikerpae J, Hales CN (1996) Altered regulation of hepatic glucose output in the male offspring of protein-malnourished rat dams. Am J Physiol 270: E559–E564.
5. Jousse C, Parry L, Lambert-Langlais S, Maurin A-C, Averous J, et al. (2011) Perinatal undernutrition affects the methylation and expression of the leptin gene in adults: implication for the understanding of metabolic syndrome. FASEB J 25: 3271–3278. doi:10.1096/fj.11-181792.
6. Weir JB (1990) New methods for calculating metabolic rate with special reference to protein metabolism. 1949. J Physiol 6: 213–221.
7. Barrientos A, Fontanesi F, Dı´az F (2009) Evaluation of the mitochondrial respiratory chain and oxidative phosphorylation system using polarography and spectrophotometric enzyme assays. Curr Protoc Hum Genet Chapter 19: Unit19.3. doi:10.1002/0471142905.hg1903s63.
8. Shepherd D, Garland PB (1969) [2] Citrate synthase from rat liver. Meth Enzymol 13: 11–16. doi:10.1016/0076-6879(69)13006-2.
9. Fleury C, Neverova M, Collins S, Raimbault S, Champigny O, et al. (1997) Uncoupling protein-2: a novel gene linked to obesity and hyperinsulinemia. Nature Genetics 15: 269–272. doi:10.1038/ng0397-269.
10. Sztark F, Ouhabi R, Dabadie P, Mazat JP (1997) Effects of the local anesthetic bupivacaine on mitochondrial energy metabolism: change from uncoupling to decoupling depending on the respiration state. Biochem Mol Biol Int 43: 997– 1003.
11. van Dam K, Shinohara Y, Unami A, Yoshida K, Terada H (1990) Slipping pumps or proton leaks in oxidative phosphorylation. The local anesthetic bupivacaine causes slip in cytochrome c oxidase of mitochondria. FEBS Lett 277: 131–133.
12. Kadenbach B, Hu¨ttemann M, Arnold S, Lee I, Bender E (2000) Mitochondrial energy metabolism is regulated via nuclear-coded subunits of cytochrome c oxidase. Free Radical Biology and Medicine 29: 211–221. doi:10.1007/978-1-4614-3573-0.
13. Abou Mrad J, Yakubu F, Lin D, Peters JC, Atkinson JB, et al. (1992) Skeletal muscle composition in dietary obesity-susceptible and dietary obesity-resistant rats. Am J Physiol 262: R684–R688.
14. Patti M-E, Corvera S (2010) The role of mitochondria in the pathogenesis of type 2 diabetes. Endocr Rev 31: 364–395. doi:10.1210/er.2009-0027. 15. Morrison JL, Duffield JA, Muhlhausler BS, Gentili S, McMillen IC (2010) Fetal
growth restriction, catch-up growth and the early origins of insulin resistance
and visceral obesity. Pediatr Nephrol 25: 669–677. doi:10.1007/s00467-009-1407-3.
16. Guan H, Arany E, van Beek JP, Chamson-Reig A, Thyssen S, et al. (2005) Adipose tissue gene expression profiling reveals distinct molecular pathways that define visceral adiposity in offspring of maternal protein-restricted rats. Am J Physiol Endocrinol Metab 288: E663–E673. doi:10.1152/ajpendo. 00461.2004.
17. Stanner SA, Yudkin JS (2001) Fetal programming and the Leningrad Siege study. Twin Res 4: 287–292. doi:10.1375/1369052012498.
18. Oh KS, Kim M, Lee J, Kim MJ, Nam YS, et al. (2006) Liver PPARalpha and UCP2 are involved in the regulation of obesity and lipid metabolism by swim training in genetically obese db/db mice. Biochem Biophys Res Commun 345: 1232–1239. doi:10.1016/j.bbrc.2006.04.182.
19. Wang C, Huang Z, Du Y, Cheng Y, Chen S, et al. (2010) ATF4 regulates lipid metabolism and thermogenesis. Cell Res 20: 174–184. doi:10.1038/cr.2010.4. 20. Watson E, Fargali S, Okamoto H, Sadahiro M, Gordon RE, et al. (2009)
Analysis of knockout mice suggests a role for VGF in the control of fat storage and energy expenditure. BMC Physiol 9: 19. doi:10.1186/1472-6793-9-19. 21. Lee M-S, Kim C-T, Kim Y (2009) Green tea (-)-epigallocatechin-3-gallate
reduces body weight with regulation of multiple genes expression in adipose tissue of diet-induced obese mice. Ann Nutr Metab 54: 151–157. doi:10.1159/ 000214834.
22. Wong KE, Szeto FL, Zhang W, Ye H, Kong J, et al. (2009) Involvement of the vitamin D receptor in energy metabolism: regulation of uncoupling proteins. Am J Physiol Endocrinol Metab 296: E820–E828. doi:10.1152/ajpendo. 90763.2008.
23. Anedda A, Rial E, Gonza´lez-Barroso MM (2008) Metformin induces oxidative stress in white adipocytes and raises uncoupling protein 2 levels. Journal of Endocrinology 199: 33–40. doi:10.1677/JOE-08-0278.
24. Nakae J, Cao Y, Oki M, Orba Y, Sawa H, et al. (2008) Forkhead transcription factor FoxO1 in adipose tissue regulates energy storage and expenditure. Diabetes 57: 563–576. doi:10.2337/db07-0698.
25. Horvath TL, Diano S, Miyamoto S, Barry S, Gatti S, et al. (2003) Uncoupling proteins-2 and 3 influence obesity and inflammation in transgenic mice. Int J Obes Relat Metab Disord 27: 433–442. doi:10.1038/sj.ijo.0802257. 26. Capaldi RA (1982) Arrangement of proteins in the mitochondrial inner
membrane. Biochim Biophys Acta 694: 291–306.
27. Methylene Blue Induces Mitochondrial Complex IV and Improves Cognitive and Function and Grip Strength in old Mice (2011) Methylene Blue Induces Mitochondrial Complex IV and Improves Cognitive Function and Grip Strength in old Mice. Neurodegenration: Theory, Disorders. pp. 63–85. Available: https://www.novapublishers.com/catalog/product_info.php?products_ id = 24925&osCsid = 6e51b2a230f110203982a2975218db2e.
28. Desquiret V, Gueguen N, Malthie`ry Y, Ritz P, Simard G (2008) Mitochondrial effects of dexamethasone imply both membrane and cytosolic-initiated pathways
in HepG2 cells. Int J Biochem Cell Biol 40: 1629–1641. doi:10.1016/ j.biocel.2007.12.010.
29. Piccoli C, Scrima R, Boffoli D, Capitanio N (2006) Control by cytochrome c oxidase of the cellular oxidative phosphorylation system depends on the mitochondrial energy state. Biochem J 396: 573–583. doi:10.1042/BJ20060077. 30. Chanseaume E, Morio B (2009) Potential mechanisms of muscle mitochondrial dysfunction in aging and obesity and cellular consequences. Int J Mol Sci 10: 306–324.
31. Galgani JE, Moro C, Ravussin E (2008) Metabolic flexibility and insulin resistance. Am J Physiol Endocrinol Metab 295: E1009–E1017. doi:10.1152/ ajpendo.90558.2008.
32. van den Broek NMA, Ciapaite J, De Feyter HMML, Houten SM, Wanders RJA, et al. (2010) Increased mitochondrial content rescues in vivo muscle oxidative capacity in long-term high-fat-diet-fed rats. FASEB J 24: 1354–1364. doi:10.1096/fj.09-143842.
33. Park HK, Jin CJ, Cho YM, Park DJ, Shin CS, et al. (2004) Changes of mitochondrial DNA content in the male offspring of protein-malnourished rats. Ann N Y Acad Sci 1011: 205–216. doi:10.1196/annals.1293.021.
34. Park KS, Kim SK, Kim MS, Cho EY, Lee JH, et al. (2003) Fetal and early postnatal protein malnutrition cause long-term changes in rat liver and muscle mitochondria. J Nutr 133: 3085–3090.
35. Peterside IE, Selak MA, Simmons RA (2003) Impaired oxidative phosphory-lation in hepatic mitochondria in growth-retarded rats. Am J Physiol Endocrinol Metab 285: E1258–E1266. doi:10.1152/ajpendo.00437.2002.
36. Selak MA, Storey BT, Peterside I, Simmons RA (2003) Impaired oxidative phosphorylation in skeletal muscle of intrauterine growth-retarded rats. Am J Physiol Endocrinol Metab 285: E130–E137. doi:10.1152/ajpendo. 00322.2002.
37. Taylor PD, McConnell J, Khan IY, Holemans K, Lawrence KM, et al. (2005) Impaired glucose homeostasis and mitochondrial abnormalities in offspring of rats fed a fat-rich diet in pregnancy. Am J Physiol Regul Integr Comp Physiol 288: R134–R139. doi:10.1152/ajpregu.00355.2004.
38. Theys N, Bouckenooghe T, Ahn M-T, Remacle C, Reusens B (2009) Maternal low-protein diet alters pancreatic islet mitochondrial function in a sex-specific manner in the adult rat. AJP: Regulatory, Integrative and Comparative Physiology 297: R1516–R1525. doi:10.1152/ajpregu.00280.2009.