HAL Id: tel-01829674
https://hal.archives-ouvertes.fr/tel-01829674
Submitted on 4 Jul 2018HAL is a multi-disciplinary open access
archive for the deposit and dissemination of sci-entific research documents, whether they are pub-lished or not. The documents may come from teaching and research institutions in France or abroad, or from public or private research centers.
L’archive ouverte pluridisciplinaire HAL, est destinée au dépôt et à la diffusion de documents scientifiques de niveau recherche, publiés ou non, émanant des établissements d’enseignement et de recherche français ou étrangers, des laboratoires publics ou privés.
Probing interaction and dispersion of carbon nanotubes
in metal and polymer matrices
Ekaterina Pavlenko
To cite this version:
Ekaterina Pavlenko. Probing interaction and dispersion of carbon nanotubes in metal and polymer matrices. Physics [physics]. Université Toulouse 3 Paul Sabatier (UT3 Paul Sabatier), 2014. English. �NNT : 2014TOU30234�. �tel-01829674�
TH `
ESE
TH `
ESE
En vue de l’obtention du
DOCTORAT DE L’UNIVERSIT´
E DE TOULOUSE
D´elivr´e par : l’Universit´e Toulouse 3 Paul Sabatier (UT3 Paul Sabatier)
Pr´esent´ee et soutenue le jeudi 25 septembre 2014 par :
Ekaterina PAVLENKO
Probing interaction and dispersion of carbon nanotubes
in metal and polymer matrices
JURY
Philippe COLOMBAN Directeur de recherche, UPMC (Paris) Rapporteur Christophe LAURENT Professeur, CIRIMAT (Toulouse) Pr´esident du Jury C´ecile ZAKRI Professeur, CRPP (Pessac) Examinatrice Victoria TISHKOVA-L ´EONI Maˆıtre de conf´erences, CINaM (Marseille) Examinatrice Rozenn LE PARC Maˆıtre de conf´erences, L2C (Montpellier) Examinatrice Wolfgang BACSA Professeur, CEMES (Toulouse) Directeur de Th`ese
´
Ecole doctorale et sp´ecialit´e :
SDM : Physique de la mati`ere - CO090
Unit´e de Recherche :
Centre d’ ´Elaboration de Mat´eriaux et d’Etudes Structurales (CEMES) UPR8011 CNRS
Directeur de Th`ese :
Wolfgang BACSA - Professeur, CEMES (Toulouse)
Pascal PUECH - Maˆıtre de conf´erences, CEMES (Toulouse)
Rapporteur :
Philippe COLOMBAN - Directeur de recherche, UPMC (Paris) Jean-Yves CAVAILL ´E - Professeur, INSA (Lyon)
Acknowledgements
First and above all, I would like to express my deepest gratitude to my supervisors Wolfgang Bacsa and Pascal Puech. It was a great pleasure to work with them both professionally and personally throughout the entire duration of my PhD. I am sincerely indebted for their bountiful advice, guidance, and the time spent helping me to improve upon this thesis. I was continuously surrounded by their support, immense knowledge, and enthusiasm, demonstrated best by Pascal’s ardency to work late on Friday nights; the true value of which became wholly apparent as time passed (had it not been recognized initially)! I was incredibly fortunate to have supervisors who cared so much about my work. I cannot imagine having better! Thank you so much!
I also gratefully acknowledge Victoria Tishkova-Léoni for giving me inspiration, clear and patient explanations, valuable advice, and especially for her friendship!
Besides my advisors and Victoria, I would like to thank the rest of my thesis committee: the two referees Philippe Colomban and Jean-Yves Cavaillé, the President of the jury Christophe Laurent, and Cécile Zakri and Rozenn Le Parc for their careful reading of the manuscript, thoughtful and detailed comments and suggestions.
I am also thankful to all members of the Carbon group for providing an excellent atmosphere, foremost, the group leader Marc Monthioux for encouraging me to give an oral presentation in French, and to Claudine Puech for her translating assistance.
Furthermore, I would like to thank the technical staff of CEMES: Antoine Zwick, Frédéric Neumayer and Sébastien Moyano for their help with the Raman experiments; Sébastien Joulie and Floran Houdellier for the technical assistance with the TEM; Philippe Salles for his help with the conductivity measurements and Laure Noé for providing an extremely clean preparation laboratory where working was a pleasure.
I also thank the collaborators from the Queen Mary University of London: Andrei Sapelkin, Stephen King, and Richard Heenan for their help with the SANS and SAXS experiments and related discussions; as well as Mark Baxendale for his help with the impedance spectroscopy measurements. My thanks also go to the collaborators from Toulouse: François Boyer from the ICA for the mechanical tests of the CNT/PEEK composites; and Christophe Guiderdoni from the CIRIMAT for the copper samples and the tribological tests.
I would also like to acknowledge my former supervisors from the Lomonosov Moscow State University Alexander Obraztsov and Peter Kopylov, as well as my good friend Alexander Lanin for helping me to develop a scientific background that allowed me to start a PhD.
I am especially grateful to Ivan Nikitskiy for inspiring me in difficult moments and to my friends Victoria Prudkovskaya, Vladimir Prudkovskiy, Anna Kotova, Oleg Polivin, Olena Kraieva, Agnieszka Krawczyńska, Philippe Mallet-Ladeira and Florian Chaumeton for their support and for all the fun we had together during these three years of my PhD. I also thank Maxim and Nina Oprya for coming to my defense all the way from Moscow.
Last but not the least, I would like to thank my family: my grandparents and my aunt for their support, my father for encouraging me to start a PhD and my mother for the careful proof-reading of the manuscript.
Contents
Introduction ... 1
1. Composite materials ... 3
1.1 Matrix ... 3
1.1.1 Polymer matrices. PEEK ... 3
1.1.2 Metal matrices. Copper ... 7
1.2 Filler: Carbon nanotubes ... 8
1.2.1 SWNT structure ... 9 1.2.2 Electronic structure of SWNTs ... 12 1.2.3 Phonon structure of SWNTs ... 14 1.2.4 Properties ... 15 1.2.5 Electronic transport ... 15 1.2.6 Synthesis ... 16 1.3 Nanocomposite CNT@Cu ... 17 1.3.1 Mechanical properties... 18 1.4 Nanocomposite CNT@PEEK ... 19 1.4.1 Conductivity ... 21
1.5 Challenges of dispersion and quantification ... 30
2. Experimental methods ... 33
2.1 Raman spectroscopy ... 33
2.1.1 Fundamentals of Raman spectroscopy ... 33
2.1.2 Raman spectroscopy of CNTs ... 36
2.1.3 Double wall CNTs as molecular sensors ... 48
2.1.4 Raman mapping and image analysis ... 50
2.1.5 Parameters of Raman spectrometers used ... 56
2.2 Transmission electron microscopy ... 57
2.3 Small-angle neutron and X-ray scattering... 60
3. Results and discussion ... 65
3.1 CNT@copper composite ... 65
3.1.1 Sample preparation ... 65
3.1.2 Microhardness and tribological testing ... 66
3.1.3 Raman spectroscopy ... 67
3.1.4 Conclusions ... 72
3.2 CNT@PEEK composite ... 73
3.2.1 Sample preparation ... 73
3.2.2 Tensile strain measurements ... 77
3.2.3 Differential scanning calorimetry ... 78
3.2.4 Nano-indentation ... 79
3.2.5 Raman spectroscopy ... 80
3.2.6 Small-angle neutron scattering ... 84
3.2.7 Conclusions ... 85
3.3 Self diffusion of deposited CNTs ... 86
3.3.1 Sample preparation ... 86
3.3.2 Electrical measurements ... 87
Contents
3.3.4 Transmission electron microscopy ... 90
3.3.5 Raman spectroscopy ... 97
3.3.6 Conclusions ... 100
Conclusions ... 101
Résumé ... 103
Introduction
Polymer composites are interesting for the aircraft and transport industries due to their light weight and mechanical strength. Utilization of composite materials instead of metallic alloys makes it possible to reduce fuel consumption and manufacturing costs. But most high performance polymers suitable for aerospace applications are electrically insulating. Considerable attention has been given in recent years to improve the electrical conductivity of polymer composites. While conductive polymers are available they are not suitable for structural applications. When mixing conducting polymers with mechanical strong polymers a large mass fraction is needed which drastically degrades the mechanical properties. Adding conducing filler particles turned out to be a better strategy. New carbon materials are promising candidates for their use as filler particles. Fullerenes were discovered in 1985 and are now used as UV absorbers. Using the same synthesis process carbon nanotubes (CNTs) were discovered in 1991. Their small size and perfect structure caught a lot of attention. The high aspect ratio, high Young’s modulus and high electrical conductivity of CNTs had the consequence that they are considered for a wide range of applications. Progress in making single layer graphene in 2004 furthermore intensified the interest in carbon nanomaterials. CNTs are a new generation of composite filler materials which can potentially replace conventional fillers. A small quantity of well dispersed CNTs can significantly increase the conductivity of the polymer. A percolation (electrical conductivity) threshold as low as 0.002wt% has been observed for epoxy matrix. Currently, polymer composite is the largest application area for CNTs. When designing a nanocomposite one expects to combine the properties of the matrix and the filler material. However the properties of the filler depend on whether the particles are agglomerated or not. The dispersion of the nanoparticles is a key parameter in improving the properties of the nanocomposite. CNTs are a lot smaller than carbon fibers and as a result the van der Waals interactions are playing a more important role for CNTs. CNTs tend to agglomerate due to their high aspect ratio and large surface area making dispersion challenging. Furthermore incorporation of fillers into a thermoplastic polymer increases its viscosity making the dispersion even more difficult. When using a thermoset like epoxy, the CNTs can be mixed in before polymerization.
The high thermal stability of CNTs gives the opportunity to introduce them into a metal matrix. The high toughness of the CNTs in a metal composite can be used to reduce material losses caused by friction and wear, one of the key engineering challenges of the today’s mechanical systems. We were able to show in the course of this work that incorporation of a small amount of double wall CNTs (DWNTs) into copper leads to a significant improvement of the tribological properties such as micro hardness and lubrication leading to a reduction in the wear volume. Establishing a relationship between CNT characteristics and macroscopic behavior of composites is also crucial for mechanical reinforcement of copper wires for high magnetic field coils.
To have better fundamental understanding one needs to study the nanocomposite at microscopic and macroscopic scales. Macroscopic behavior such as the electrical conductivity and tensile deformation depends on the structure at the micrometer scale. However it is often challenging to image nanoparticles in a matrix and monitor their interaction. Elaborate research tools such as neutron scattering, synchrotron radiation
2 Introduction facilities and advanced electronic microscopy are cost intensive while Raman spectroscopy is a versatile and straightforward tool. Raman spectroscopy offers several advantages for microscopic analysis. Since it is a scattering technique, specimens do not need any primary preparation such as sectioning, surface treatment or thinning. Raman spectra can be collected from a very small volume (< 1 µm in diameter). The spectral bands allow the identification of a compound present on a specific location and volume.
In recent years low cost Raman spectrometers have become available. Raman spectroscopy is applied in food industry to detect the product composition (Tellspec®), in geology to examine shale gas minerals (a patent in 2014 was granted for identifying the maturity of the rock with a 1450cm-1 Raman band). Raman is also widely used in
the characterization of carbon nanomaterials. Raman spectroscopy can be highly sensitive allowing to observe a single nanotube 1.2nm wide with only 105 atoms. CNTs
have a strong Raman signal with many characteristic spectral bands that can be used to indicate modifications of the CNT when subjected to external influence. CNTs can in turn be used as a tool to probe its surroundings. A single wall tube (SWNT) cannot serve as a local sensor since all the atoms are located on the surface, neither can multiwall tubes (MWNT) due to the fact that most of the atoms are inside and do not directly interact with the environment. In case of DWNTs one tube is exposed to the environment while the other one is not. When comparing the Raman spectra from the inner and outer tubes we can consider DWNTs as molecular sensors.
The subject of this thesis is of primary importance for aerospace industry and for the ‘Aerospace Valley’ platform in Toulouse. The goal of this work is to contribute to the fundamental understanding of CNT composites.
In this thesis at first I investigate DWNTs as molecular sensors and their possible applications to nanocomposites. Secondly, I study the wear of CNT/copper composites and in the third part I investigate the dispersion of CNTs in a polymer matrix and the modification of the polymer due to the presence of CNTs.
Chapter 1
Composite materials
1. Composite materials ... 3
1.1 Matrix ... 3
1.1.1 Polymer matrices. PEEK ... 3
1.1.2 Metal matrices. Copper ... 7
1.2 Filler: Carbon nanotubes ... 8
1.2.1 SWNT structure ... 9 1.2.2 Electronic structure of SWNTs ... 12 1.2.3 Phonon structure of SWNTs ... 14 1.2.4 Properties ... 15 1.2.5 Electronic transport ... 15 1.2.6 Synthesis ... 16 1.3 Nanocomposite CNT@Cu ... 17 1.3.1 Mechanical properties... 18 1.4 Nanocomposite CNT@PEEK ... 19 1.4.1 Conductivity ... 21
1.5 Challenges of dispersion and quantification ... 30
A composite material is a multi-component system in which components with significantly different physical or chemical properties are blended to form a new material with characteristics different from simply the average of the individual components properties. There are two main categories of composite constituent materials: matrix and filler. The matrix surrounds and supports the filler while the filler impacts its special mechanical and physical properties (strength, stiffness, conductivity etc.) to enhance the matrix properties.
1.1 Matrix
1.1.1 Polymer matrices. PEEK
Polymers are the most widely used matrix materials in modern composites [1]. One of the major reasons why polymer composite materials (PCM) are so attractive is that they can reduce weight of a construction element while maintaining or improving its mechanical characteristics. This property makes polymer composites especially attractive for transportation in general and aerospace applications in particular, since weight reduction leads to lower fuel consumption and emission. Presently, in modern aircrafts up to 50% of the airframe is made from composite materials. Weight reduction of final products is thus 20-50% [2]. Advanced polymer composites do not corrode like metals. The combination of corrosion and fatigue cracking is a significant problem for commercial aluminum fuselage structures [2]. PCMs are relatively easy to process and
4 Chapter 1. Composite materials they can be molded into complex shapes. This means that a composite part can replace many metallic parts that had to be assembled to achieve the same function; hence it leads to cost reduction. When manufacturing parts made from polymer composites, the waste of material is not more than 30wt%. Whereas, for comparison, for parts from high-strength alloys of aluminum used in the aviation industry, the waste may be up to 90% (of which 70-80% are recycled), this is associated with low series production [3]. Another significant advantage is that the properties of polymer composite materials can be easily controlled by simply changing the composition and preparation conditions [2]. Other important properties that can be obtained include improved wear resistance, enhanced fatigue life, low thermal expansion, low or high thermal conductivity, etc. But an important disadvantage of polymer composites is a nonvisible impact of damage. Thus they need to be better studied to prevent failure.
The properties of the final composite depend strongly on the intrinsic properties of the polymer used. The properties of the composite can be divided into three groups. When trying to enhance and improve the properties of one group, we automatically degrade the others. The first group includes strength, stiffness and heat resistance, the second - plasticity, viscosity and fracture toughness, the third – processability and manufacturability. For example, a polymer with a lower processing temperature is easier to process but this implies that the heat resistance is also low. The goal when constructing a composite material is to find a compromise between these three property groups taking also into account the environmental, economic, market and other aspects.
Thermosets and thermoplastics
Polymers can be divided into two main classes: thermosets (e.g. epoxy, polyester, polyurethane, vulcanized rubber and phenol) and thermoplastics (e.g. polypropylenes, polyethylenes, polyimide (PI), polysulfone (PSU), poly (ether ether ketone) (PEEK), poly (ether ketone ketone) PEKK, polyphenylene sulfide (PPS)).
The first class are typically relatively low viscosity liquids (at the process temperature), which, after introducing a reinforcing material are cured and change irreversibly into an infusible, insoluble highly cross-linked, three-dimensional molecular network that does not melt at high temperatures.
The second group are linear polymers which soften and melt at high temperatures, and return to the solid state upon cooling.
The main advantages of thermosets include good processing properties: low viscosity; good wettability and impregnability of the reinforcing material, relatively low cure temperatures, good adhesion to most fibers, increased heat resistance, resistance to chemical media, water and weather resistance, low permeability for liquids and gases. Their properties can be controlled over a wide range by varying the components, adding modifiers and catalysts, changing curing conditions, etc. But thermosets have a number of disadvantages such as: brittleness, low fracture toughness and impact strength, impossibility of recycling, long curing times, and significant shrinkage in most chemical cases.
Epoxies and polyesters have been the principal polymer matrix materials for several decades, but advanced thermoplastics such as PEEK and PPS are now receiving considerable attention for their excellent toughness and low moisture absorption properties, their simple processing cycles, and high-temperature capabilities.
Aerospace grade epoxies are typically cured at about 177°C and are generally not used at temperatures above 150°C, whereas advanced thermoplastics such as PPS, PI,
Chapter 1. Composite materials 5 and PEEK have melting temperatures in the range of 315-370°C [1]. Other advantages of thermoplastics are: a possibility of recycling, facilitation of product reparation, more efficient methods of processing, less energy consuming, possibility of molding larger and more complex detail configurations, higher productivity, reduced flammability, smoke emission during combustion and combustion products toxicity, high resistance to radiation.
On the other hand, the replacement of thermosets by thermoplastics requires a number of complex technological problems to be solved. Due to a high viscosity melt polymer processing has to be carried out at high temperatures and high pressures. Amorphous and semi-crystalline thermoplastics
Thermoplastic polymers appear in two states: amorphous and semi-crystalline. Amorphous polymers have a randomly arranged molecular structure while semi-crystalline contain both semi-crystalline and amorphous regions in the same sample.
Amorphous polymers do not have a well-defined melting point. They tend to gradually soften over a relatively wide temperature range known as glass transition temperature (Tg). Above the glass transition, the polymer transforms from a hard and relatively brittle state into a molten or rubber-like state. This transformation is reversible when lowering the temperature and can be repeated many times without affecting the material properties.
In contrast, crystalline polymers have true melting temperatures (Tm) where the
polymers turn into a liquid state. The crystallinity of a semi-crystalline polymer strongly depends on the thermal history of the material. Annealing the sample, one can vary the degree of crystallinity and the morphology of the crystal structure [4] [5].
When crystallization takes place from a liquid state, the crystallized areas are highly anisotropic and form crystalline lamellae (Figure 1.1a). These lamellae are formed from folded on themselves local linear chains. Amorphous areas where the monomers were not able to self-organize are present between the crystalline lamellae. The presence of amorphous areas is often due to rapid cooling rates or to defect linkage of monomers. The lamellar structures grow radially from a starting point to form larger structures called spheroids (Figure 1.1b).
6 Chapter 1. Composite materials There are many factors that can cause crystallization at a particular point. For example, it may be either a polymer seed or an external agent (impurity), or a nucleating agent, or a filler particle.
PEEK
Poly (ether ether ketone) (PEEK) is a semi-crystalline thermoplastic polymer suitable for prolonged use at high temperatures. Its chemical structure is shown in Figure 1.2.
Figure 1.2. PEEK chemical structure.
The mechanical properties and chemical resistance of PEEK depend on the degree of crystallinity which varies slightly with cooling velocity and remains between 30 and 40%. PEEK crystallizes in two steps. The primary crystallization is a spherulite growth from a seed. A spherulite is formed of lamellar stacks separated by amorphous areas. A lamellar stack is approximately 10nm thick and a spherulite is about 10µm in diameter, however the size of the spherulites can vary significantly depending on the thermal history. The secondary crystallization corresponds to the interlaminar crystallization of amorphous areas and thickening of spherulites [6].
Due to deactivated aromatic nature the polymer has a high melting point (334°C) and a high degree of oxidative stability. This allows its long-term use at temperatures ranging from -40° to +250°C and gives PEEK an ability to withstand short-term heating up to 300°C [7].
Despite its high-temperature performance, PEEK can be processed on standard equipment. Corrosive gases are not liberated during processing; consequently, corrosion-resistant materials are unnecessary. Drying for 3 hours at 150°C is recommended. Failure of drying results in bubbling and the occurrence of surface streaking, but no degradation is observed. Consequently, the left over material can be reused.
A distinctive feature of PEEK is that the polymer maintains its excellent mechanical properties, stiffness, fatigue characteristics, load bearing and good dimensional stability even at high temperatures and exposures to chemicals [7]. It is resistant to high energy radiation (X-rays, gamma radiation); has a high resistance to surface electrical discharges, temperature and humidity changes; can be exploited in hot water (even up to 200°C) and is suitable for contacts with food. The polymer is resistant to the action of thermoplastic steams, has low flammability and very low levels of smoke emission when burned. A summary of the main PEEK properties is given in Table 1.1.
Chapter 1. Composite materials 7 Mechanical Tough, ductile, abrasion resistant
Excellent fatigue characteristics Load bearing at high temperature
Thermal High melting point
High continuous service temperature Flammability Low flammability, fire, smoke properties Chemical Essentially inert to organics
High degree of acid and alkali resistance
Particularly resistant to high temperature water/steam Hard radiation No significant degradation below 1100 Mrad
Processing Easily processed on conventional equipment
Table 1.1. PEEK—Key Properties [7].
In particular, a high crystalline melting point and outstanding chemical resistance open entirely new applications in aggressive environments. Such applications include cable insulation, monofilaments, coatings, molded parts, and high-strength composites.
Due to its chemical structure, PEEK is compatible with many reinforcing agents. Mixing poly (ether ether ketone) with carbon fibers, graphite, polytetrafluoroethylene (PTFE) or glass fiber significantly improves its properties, increasing frictional quality, mechanical strength, wear resistance, hardness, dimensional stability and other properties.
The price of PEEK is high, typically up to 500€/kg for small quantity (2014). Its use is reserved to technical domains such as medicine and aeronautic.
1.1.2 Metal matrices. Copper
Metal matrix composites (MMCs) have many advantages over conventional metals including a higher specific modulus, higher specific strength, better properties at elevated temperatures, lower coefficients of thermal expansion and better wear resistance. But, their toughness is lower than that of monolithic metals and they are more expensive at present. In comparison with most polymer matrix composites, MMCs have certain superior mechanical properties, namely higher transverse strength and stiffness, greater shear and compressive strengths and better high temperature capabilities. There are also advantages in some of the physical properties of MMCs such as no significant moisture absorption, non-inflammability, high electrical and thermal conductivities, and resistance to most radiations [8]. MMCs are under consideration for a wide range of applications. They have been extensively studied for many years. The primary interest has come from the aerospace industry for airframe and spacecraft components. Now they are increasingly used in automotive, electronics and sport industries.
MMC reinforcements can be generally divided into five major categories: continuous fibers, discontinuous fibers, whiskers, wires and particulate. With exception of wires, which are metals, reinforcements are generally ceramics. Typically these ceramics are oxides, carbides and nitrides which are used because of their excellent combinations of specific strength and stiffness at both ambient and elevated temperatures [8].
8 Chapter 1. Composite materials The matrix of a MMC is defined as a metal, but pure metal is rarely used: it is generally an alloy. The two most commonly used metal matrices are based on aluminum and titanium. Both of these metals have comparatively low densities and are available in a variety of alloy forms. The most common reinforcements of aluminum and its alloys are SiC and Al2O3. Aluminum MMCs are mainly used in bracing systems, pistons, brake discs and airframes. Titanium alloys have higher tensile strength-to-weight ratios as well as better strength retentions at 400–500°C than those of aluminum alloys and conventional materials. Titanium MMCs are used in applications where performance is demanded without regard to cost-effectiveness. Other metals were also considered as possible matrices for MMC. Magnesium is even lighter that aluminum, but it is exposed to atmospheric corrosion which makes it less suitable for many applications. Beryllium is the lightest of all structural metals and has a tensile modulus higher than that of steel. However, it is extremely brittle, which makes it unsuitable for a matrix material. Nickel- and cobalt-based super alloys have also been used as matrices, but they tend to oxidize the reinforcing fibers at elevated temperatures [9].
Copper
Another metal that is used as a matrix in MMCs is copper. It is a ductile soft metal with very high electrical (59.6×10⁶ S/m) and thermal conductivities, which are the
second highest among pure metals at room temperature. Copper has a high resistance to both atmospheric and aqueous corrosion, but its use as a structural material is limited because of great weight. However, some of its outstanding characteristics, such as its high electrical and heat conductivity, in many cases overbalance the weight factor. The major applications of copper are in electrical wires (65%), roofing and plumbing (25%), transport (7%) and other (3%) [10]. Copper is mostly used as a pure metal, but when a higher hardness is required it is combined with other elements to make an alloy (5% of total use) such as brass and bronze. Copper is 100% recyclable without any loss of quality, regardless of whether it is in a raw state or contained in a manufactured product.
1.2 Filler: Carbon nanotubes
At first the constituents were typically macroscopic. Since composites technology advanced over the last years the reinforcement materials constantly decreased in size. Presently there is a considerable interest in “nanocomposites” having nanometer sized reinforcements. Carbon nanotubes (CNTs) have shown a high potential as fillers because of their outstanding properties such as high stiffness, strength and tenacity, thermal and electrical conductivity, etc [1].
CNTs can be viewed as graphene sheets rolled into hollow cylinders. Nanotubes are categorized as single-walled nanotubes (SWNTs) and multi-walled nanotubes (MWNTs). SWNTs consist of a single sheet of graphene rolled seamlessly to form a cylinder with diameter of order of 1nm and length of up to centimeters [11]. MWNTs consist of several concentric cylinders with an interlayer spacing of 0.34nm [12]. The diameter of MWNTs generally ranges from 2 to 100nm [13]. The arrangement of concentric graphene cylinders in MWNTs can be described by two models. In the more common Russian Doll model, sheets of graphene are arranged in concentric cylinders while in the Parchment model, a single sheet of graphite is rolled in around itself, resembling a scroll of parchment. Individual nanotubes naturally align themselves into "ropes" held together by van der Waals forces.
Chapter 1. Composite materials 9
1.2.1 SWNT structure
To define the one dimensional structure of a carbon nanotube we first need to look at the unit sell of 2D graphene. Figure 1.3 shows a unit sell of graphene (rhombus) which contains two carbon atoms A and B. The lattice vectors in real space a1 and a2 are given by [14]: 𝐚𝟏= (√3 𝑎2 , 𝑎 2) and 𝐚𝟐= ( √3 𝑎 2 , − 𝑎 2)
where 𝑎 = |𝐚𝟏| = |𝐚𝟐| = 1.42 × √3 = 2.46Å is the lattice constant of graphene. Correspondingly, the basis vectors b1 and b2 of the reciprocal lattice are given by:
𝐛𝟏= ( 2𝜋 √3 𝑎, 2𝜋 𝑎) and 𝐛𝟐= ( 2𝜋 √3 𝑎, − 2𝜋 𝑎)
The shaded hexagon in Figure 1.3 represents the Brillouin zone (BZ) of graphene. The three high symmetry points, Γ, K and M of the Brillouin zone are shown at the center, the corner, and the center of the edge, respectively.
Figure 1.3. a) The unit cell (dotted rhombus) of a graphene lattice with basis vectors a1
and a2 b) the Brillouin zone (shaded hexagon) of a graphene layer with b1 and b2
reciprocal lattice vectors. The high symmetry points, Γ, K and M are indicated [14].
The nanotube structure can be described by the diameter or a chiral vector 𝑪𝒉 defined by the following equation:
𝑪𝒉= 𝑛𝒂𝟏+ 𝑚𝒂𝟐= (𝑛, 𝑚)
where 𝒂𝟏 and 𝒂𝟐 are unit vectors in a two-dimensional hexagonal lattice above, and n and m are integers. If m = 0, the nanotubes are called zigzag nanotubes, and if n = m, the nanotubes are called armchair nanotubes. Otherwise, they are called chiral.
10 Chapter 1. Composite materials
Figure 1.4. a) The unrolled honeycomb lattice of a nanotube. When we connect sites O and A, and sites B and B′, a portion of a graphene sheet can be rolled seamlessly to
form a SWNT. The vectors OA and OB define the chiral vector Ch and the
translational vector T of the nanotube, respectively. The rectangle OAB′B defines the unit cell for the nanotube. The figure is constructed for an (n, m) = (4, 2) nanotube
[15] b) The (4, 2) SWNTs, showing the translation vector T [14].
Mathematically, the nanotube diameter is given by: 𝑑𝑡=
𝑎√𝑚2+ 𝑛2+ 𝑛𝑚
𝜋 =
|𝑪𝒉| 𝜋
where 𝑎 is the lattice constant in the graphene sheet (𝑎 = 2.46Å = √3𝑎𝐶−𝐶, 𝑎𝐶−𝐶= 1.421 Å). The chiral angle Θ is given by:
tan 𝛩 = √3𝑚 2𝑛 + 𝑚
Thus, the structure of any nanotube can be expressed by either two indices (n, m) or equivalently by dtand Θ.
To define the unit cell for the 1D nanotube, we define the vector OB in Figure 1.4 as the shortest repeat distance along the nanotube axis, thereby defining the translation vector T:
𝑻 = 𝑡1𝒂𝟏+ 𝑡1𝒂𝟏≡ (𝑡1, 𝑡2) where the coefficients t1 and t2 are related to (n, m) by
𝑡1=(2𝑚 + 𝑛)𝑑
𝑅 and 𝑡1= −
(2𝑚 + 𝑛) 𝑑𝑅
where dR is the greatest common divisor of (2𝑛 + 𝑚, 2𝑚 + 𝑛) and is given by:
𝑑𝑅 = {𝑑 if 𝑛 − 𝑚 is not a multiple of 3𝑑3𝑑 if 𝑛 − 𝑚 is a multiple of 3𝑑 where d is the greatest common divisor of (n, m).
Chapter 1. Composite materials 11 The magnitude of the translation vector T is:
|𝑻| = 𝑇 =√3𝐶ℎ 𝑑𝑅
The unit cell of the nanotube in real space is defined as the area delineated by the lattice vectors T and Ch. The number of hexagons, N, contained within the 1D unit cell
of a nanotube is determined by the integers (n, m) and is given by
𝑁 =2(𝑚2+ 𝑛2+ 𝑛𝑚) 𝑑𝑅
The corresponding vectors in reciprocal space are the reciprocal lattice vectors K2 along the nanotube axis and K1 in the circumferential direction, which gives the discrete k values in the direction of the chiral vector Ch. The vectors K1 and K2
satisfy the relations:
𝑪𝒉∙ 𝑲𝟏= 2𝜋, 𝑻 ∙ 𝑲𝟏= 0, 𝑪𝒉∙ 𝑲𝟐= 0, 𝑻 ∙ 𝑲𝟐= 2𝜋 This can be rewritten as
𝑲𝟏= 1
𝑁(−𝑡2𝒃𝟏+ 𝑡1𝒃𝟐), 𝑲𝟐= 1
𝑁(𝑚𝒃𝟏− 𝑛𝒃𝟐) where b1 and b2 are the reciprocal lattice vectors of a 2D graphene sheet.
The CNT Brillouin zone is a collection of N 1D equidistant cutting lines through the
k space of graphene (Figure 1.5)
Figure 1.5. Parallel equidistant lines represent the cutting lines
for the (4, 2) nanotube. The cutting lines are labeled by the cutting line index μ, which assumes integer values from 1-N/2=13 to N/2=14 [14].
For each of the μ (μ=1-N/2,…, N/2) discrete values of the circumferential wave vectors, 1D electronic energy band appears (one π-band and one π*-band), whereas each μ gives rise to 6 branches in the phonon dispersion relations.
12 Chapter 1. Composite materials
1.2.2 Electronic structure of SWNTs
The electronic structure of SWNTs is derived from that of a single graphene, but in the case of SWNTs, the quantum confinement of the 1D electronic states must be taken into account. The electronic σ bands are responsible for the strong in-plane covalent bonds within the 2D graphene sheets, while the π bands are responsible for weak van der Waals interactions between such graphene sheets in bulk graphite. In contrast to the σ bands, the π bands are close to the Fermi level, so that electrons can be excited from the valence (π) to the conduction (π*) band optically [14].
The electronic band structure of graphene can be obtained with the tight binding (TB) model. Within this model it is assumed that the crystal potential is strong, and the electron is captured by its own ion during the motion through the lattice, the electron remains there for a long time before tunneling to the next ion. During the capture interval, the electron stays primarily around a single ion, i.e. its state function is essentially that of an atomic orbital, uninfluenced by other atoms [16].
Figure 1.6a shows the π and π* bands of 2D graphene in the first Brillouin zone. The
optical transitions occur close to the corners of the 2D hexagonal Brillouin zone, called the K points, where the valence and conduction bands touch each other. The energy dispersion around the K point is linear in k which gives graphene and SWNTs their unique electronic properties [14].
Figure 1.6. a) The calculated constant energy contours for the conduction and valence bands of a graphene layer in the first Brillouin zone using the π-band nearest neighbor tight binding model [15]. The valence and conduction bands touch in the K points.
Solid curves show the cutting lines for the (4, 2) nanotube [17],
as shown in Figure 1.5, but translated to the first Brillouin zone of 2D graphite, the dark points indicating the connection points
b) Electronic energy band diagram for the (4,2) nanotube obtained by zone-folding from a) c) Density of electronic states for the band diagram shown in b) [14].
To obtain the electronic band structure of the nanotube in a E(k) graph, one needs to plot all the 1D cutting lines of the 2D energy surface of graphene. These cutting lines originate from wave vectors allowed by quantization around the circumference. Figure 1.6a illustrates this for a (4, 2) SWNT.
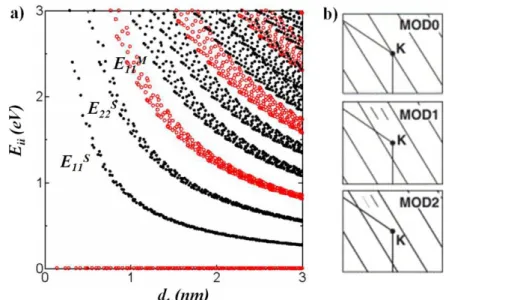
Chapter 1. Composite materials 13 SWNTs can be classified into three different classes determined by the n and m indices. A class is defined by the reminder of 2n+m divided by 3 (Figure 1.7b). Both classes with reminder 1 and 2 are semiconducting nanotubes. None of the allowed k vector falls on the K point. For the class where 2n+m is a multiple of 3 some of the k vectors fall on the K point and these SWNTs are classified as “metallic”. However, due to the curvature effect, only armchair (n = m) SWNTs are truly metallic, while the other MOD0 SWNTs (n ≠ m) are metallic at room temperature, but exhibit a small (∼meV) chirality-dependent energy gaps (quasi-metallic) at lower temperatures.
The density of states (DOS) of 1D materials has characteristic maxima, called van Hove singularities. It is important that the rate of optical transitions in carbon nanotubes is related primarily to the electronic states at the van Hove singularities, while the energy positions of van Hove singularities depend on the diameter and chirality of the CNT. For this reason, optical spectroscopy can be used for the structural determination of a given (n, m) carbon nanotube.
The optical transition energies Eii between the electronic valence and conduction
bands as a function of diameter (Kataura plot [18]) can be calculated and have been experimentally verified.
Figure 1.7. a) Electronic transition energies Eii vs. nanotube diameter dt for SWNTs
(calculated with TB method). Stars, filled and open circles stand for MOD0, MOD1 and MOD2 SWNTs, respectively. b) Schematic figure defining the SWNT classes: MOD0—metallic, where one cutting line crosses the K point; MOD1 and MOD2— semiconducting. Superscripts S or M are used to denote the electronic transition
energies 𝐸𝑖𝑖𝑀 for metallic SWNTs and 𝐸𝑖𝑖𝑆 for semiconducting SWNTs [14]. Excitonic effects play an important role in photo excitation and have been observed in two photon excitation spectra [19] [20] [21].
Photolumiscence (PL) is an important tool for CNT characterization. By plotting the emission wavelength, chirality distribution in the sample can be identified [22].
14 Chapter 1. Composite materials
1.2.3 Phonon structure of SWNTs
Phonons play a major role as carriers of thermal energy in thermal conduction processes and in thermodynamic properties, such as the heat capacity, and as an important scattering process for bringing electrons into equilibrium with the lattice.
The phonon dispersion relations and the phonon density of states for a SWNT can be derived from graphene using band folding. The 2D graphene sheet has 𝑝 = 2 atoms per unit cell, thus having 3𝑝 = 6 phonon branches: 3 acoustic (A) and (3𝑝 − 3) = 3 optic (O) (Figure 1.8a). For one acoustic branch and one optic phonon branch, the atomic vibrations are perpendicular to the graphene plane, and they correspond to the out-of-plane (o) phonon modes. For two acoustic and two optic phonon branches, the vibrations are in-plane (i). In a first approximation the displacement of the nearest neighbor atoms are considered and, the phonon modes are classified as longitudinal (L) or transverse (T) according to vibrations parallel with or perpendicular to, respectively, the bond direction. Therefore, along the high symmetry ΓM and ΓK directions, the six phonon dispersion curves are assigned to LO, iTO, oTO, LA, iTA, and oTA phonon modes (Figure 1.8b) [14].
The phonon dispersion for a (10, 10) SWNT obtained by band folding is illustrated in Figure 1.8c, and the respective phonon DOS with van Hove singularities is shown in Figure 1.8d.
Figure 1.8. a) Phonon dispersion of 2D graphite using the force constants from [23]. The phonon branches are labeled: out-of-plane transverse acoustic (oTA); in-plane transverse acoustic (iTA); longitudinal acoustic (LA); out-of-plane transverse optic (oTO); in-plane transverse optic (iTO); longitudinal optic (LO). b) The phonon density
of states for a 2D graphene sheet. c) The calculated phonon dispersion relations of an armchair carbon nanotube with (n,m)=(10,10) d) The corresponding phonon density of
states for a (10,10) nanotube [14].
Electron phonon coupling (EPC) plays an important role in the physical properties of CNTs. Ballistic transport, excited state dynamics, and Raman spectra depend on it. In particular, the optical phonons EPC limits high field ballistic transport [24].
Chapter 1. Composite materials 15
1.2.4 Properties
Nanotubes are light weight (density ~0.8-1.8g/cm3 [25]) and have remarkable
electrical, thermal, and mechanical properties. In 2000, Yu et al. measured Young’s moduli values for individual MWNT of between 0.27–0.95TPa, strengths in the 11– 63GPa range, and a toughness of ~1240J·g-1 [26]. For SWNTs, Young’s moduli were
found to be in the range of 0.32–1.47TPa and strengths between 10 and 52GPa with a toughness of ~770J·g-1 [27]. Even the most defective carbon nanotubes have strengths
of several GPa [28]. Furthermore, CNTs are thermally stable. They can stand temperatures up to 500°C [29] in air and up to 2000°C in Argon atmosphere [30]. Theory predicts a room temperature thermal conductivity of up to 6000W/m·K [31]. While this has not yet been attained, thermal conductivity as high as 3000W/m·K has been measured [32].
1.2.5 Electronic transport
Diffusive conductionElectrical resistance in metals arises because electrons propagating through the solid are scattered due to deviations from perfect translational symmetry. These are produced either by impurities (giving rise to a temperature independent contribution to the resistance) or the phonons in a solid.
The conductance of a macroscopic conductor is described by Ohm's law: 𝐺 = 𝜎𝐴
𝑙
where A and 𝑙 are the cross-section and length of the conductor, respectively. The conductivity σ of the sample is determined by intrinsic material parameters, first described by the Drude conductivity:
𝜎 =𝑛𝑒 2 𝑚 𝜏𝑚
where apart from the charge carrier concentration n, the only free parameter is τm, the
characteristic momentum relaxation time of the charge carriers. The associated length scale is 𝑙m = υF τm, with υF being the Fermi velocity of the electron. This quantity
determines the distance that the electron traverses between two scattering events. A conductor is in the diffusive regime if 𝑙 » 𝑙m. The charge carrier scatters several times
when crossing the conductor. Ballistic conduction
The simple Drude model is not valid for sufficiently small conductors, and inherently fails if the size of the structure becomes so small, that the electron crosses it in a timescale of τm. If no scattering occurs inside the conductor (𝑙 « 𝑙m) such as for a
nano-constriction, one falls in the ballistic regime. A lot of research has been carried out on electronic transport properties of 1D systems [33] [34]. In the absence of magnetic field and if one neglects the coherence effects, the conductance of a confined system, like the conductance of a nanowire (NW), is defined by the Landauer formula:
16 Chapter 1. Composite materials
𝐺 =2𝑒2 ℎ 𝑁𝑇
It depends on the transmission probability T and on the number of propagating modes N, which is determined by the cross-section of the NW. Thus, assuming a ballistic transport regime, the conductance is quantized in
𝐺0=2𝑒 2
ℎ ≈ (12.9𝑘𝛺)−1 units when the cross-section is varied.
First the quantized conductance for MWCNTs was observed by Frank et al. [35] when moving a nanotube contact at constant speed into and out of the mercury contact as a function of time (Figure 1.9).
Figure 1.9. Conductance measurements. The period of motion is 2s and the displacement Δz=±2.5 mm. The conductance “jumps” to ~1G0 and then remains
constant for ~2 µm of its dipping depth. The direction of motion is then reversed and the contact is broken after 2 mm. The cycle is repeated to show its reproducibility [35].
Pristine carbon nanotubes are extremely conductive. Ballistic transport implies that Joule heating is minimized. As a result the nanotubes can carry very large current densities of up to 109 A/cm2 [36]. In comparison, for superconductive materials such as
MgB2 the current density can be as high as 105-106 A/cm2 at 4K [37]. In addition,
carrier mobilities as high as 105 cm2/Vs have been observed in semi-conducting
nanotubes [38]. Superconductivity has also been observed in SWNTs, albeit with transition temperatures of 5K [39].
These outstanding properties make CNTs potentially ideal candidates for improvement of mechanical and electrical properties of composites.
1.2.6 Synthesis
A wide variety of synthesis techniques have been used for growing CNTs of different properties: size, aspect ratio, purity, entanglement and straightness. Currently, chemical and physical methods are used to synthesize carbon nanotubes in industrial quantities. These methods include electric arc discharge, laser ablation and chemical vapour deposition (CVD) [25].
Electric arc discharge is the first technique where CNTs have been grown. The arc discharge is run in an inert He or Ar atmosphere. In this process the carbon of the cathode sublimates through the impact of the accelerated electrons.
Chapter 1. Composite materials 17 In laser ablation, a laser vaporizes a graphite target in a high-temperature reactor (about 1200 °C), while an inert gas is bled into the chamber. Nanotubes are obtained on the cooled surfaces of the reactor as the vaporized carbon condenses.
CVD is the most common method in which a controlled reaction of thermal decomposition of a hydrocarbon gas (methane, carbon monoxide, acetylene, ethylene or ethanol) at the sites of metal catalysts such as Ni, Fe or Co produces single and multi-wall carbon nanotubes. Interestingly the diameter of the synthesized nanotubes is related to sizes of metal particles. CVD grown tubes are cheaper, have higher purities and can be produced in large quantities, but they are more defective and their properties are much lower than the arc produced ones. Aligned arrays of tubes with controlled diameter and length can be produced with plasma-enhanced CVD (PECVD). If plasma is generated by the application of a strong electric field during growth, then the nanotube growth will follow the direction of the electric field. Aligned arrays can be rolled into carbon threads where each filament is a bundle of thousands of CNTs.
1.3 Nanocomposite CNT@Cu
One of the objectives of adding fibrous reinforcements such as CNTs to a metal matrix is to increase the tensile strength and the elastic modulus of the composite. CNTs have a higher stiffness and strength compared to the metal matrix. But CNT/metal nanocomposites have shown lower strength than expected [40], possibly because of the low interfacial bonding strength between the matrix and the CNT. Proper bonding would lead to efficient load transfer and effective utilisation of the strength of the CNTs. Carbon nanotube reinforced metallic matrix composites are not yet commercially available. However, there are several potential applications for these composites (Table 1.2). Carbon nanotubes have better strength and stiffness than carbon fibers and hence have the potential in replacing carbon fiber reinforced MMCs in various applications. Overcoming the challenges in processing will result in efficient use of the CNTs in MMCs [41].
Industry Application Wanted property
Automobile industry
Brake shoes, cylinder liners, piston rings, gears
High strength, wear resistance, good thermal conductivity, low density Aerospace
industry
Aircraft brakes, landing gears
Good wear resistance, good thermal conductivity, low density, high strength Space
applications
High gain antenna boom, structural radiators
Low density, high strength, low coefficient of thermal expansion, good electrical conductivity
Sports industry
Light weight bicycles, tennis and badminton rackets
High strength, high elastic modulus
Electronic packaging
Heat sinks for thermal management, solders
High thermal conductivity, low coefficient of thermal expansion, increased strength
18 Chapter 1. Composite materials MEMS and
sensors
Micro-beams, micro-gears High elastic modulus, high surface area
Battery and energy storage
Anodes and anode coatings, hydrogen storage materials
Large surface area, reduced response times, increased H2 adsorption— desorption rate, high current density
Table 1.2. Potential applications of CNT-reinforced metal composites in various industries [41].
Another important objective of adding CNTs is to obtain a self-lubricating material, preventing the need for liquid lubricants. In particular CNT/Cu composites are of great interest [42] [43] [44] [45].
Different methods of fabrication such as powder metallurgy, mechanical alloying and sintering, extrusion, hot pressing and electro- and electroless deposition have been applied for synthesizing CNT-reinforced MMCs. Recently some novel methods have been designed for obtaining better dispersion of CNTs. These methods include molecular level mixing, nanoscale dispersion and spark plasma sintering which although successful, are still on a laboratory scale [41].
1.3.1 Mechanical properties
Incorporation of CNTs in copper leads to a significant improvement of mechanical properties such as microhardness, wear resistance and low friction coefficient. However, the results reported by different groups vary widely due to different experimental conditions: the type of CNTs used, the preparation routes and the testing conditions (counterface, load, distance, relative humidity). Powder metallurgy technique, comprising of compaction and sintering, helps increasing the hardness up to 20% and decreasing the wear loss by 70% with 15 vol.% MWNT addition. [42]. CNTs coated with Ni improved bonding with the Cu matrix resulting in about 80–100% increase in the hardness for 9–16 vol.% MWNT addition [46]. Spark plasma sintering of 10 vol.% MWNT/Cu composite improved the hardness by 80% [40]. The microwave sintered CNT/Cu composites exhibited up to 70% lower coefficient of friction and up to ten times lower wear rate compared to unreinforced copper on addition of 15 vol.% of copper-coated MWNTs [43]. CNT/Cu composites fabricated by molecular level mixing showed up to a 100% increased hardness and up to 70% increased wear resistance with 10 vol.% CNTs addition. The remarkable enhancement of hardness is originated from the homogeneously distributed CNTs in Cu matrix, high interfacial strength at CNT/Cu interfaces and high relative density of nanocomposites. The dispersed CNTs in Cu-matrix provide enhanced wear resistance by retarding the peeling of Cu grains during sliding wear process [45]. When using DWNTs [47], a doubling of the Vickers microhardness and a fourfold decrease of the average friction coefficient compared to pure Cu, were obtained for a 5 vol.% carbon loading. The needed volume fraction to improve the mechanical properties is significantly lower when using DWNTs. Indeed, a given DWNT weighs much less than a MWCNT of the same length [48] and therefore many more DWNTs are present for a given carbon weight loading, which can greatly modify the matrix microstructure and ultimately give better results for lower carbon loadings.
Chapter 1. Composite materials 19
1.4 Nanocomposite CNT@PEEK
Incorporation of CNTs into a polymer results in a significant change in mechanical, electrical and thermal properties of the matrix. There are various factors that influence property modification such as processing techniques, type of CNTs, aspect ratio and CNT content. So it is very important to optimize these conditions to obtain nanocomposites with desired properties. It is generally observed that a particular processing method which is good for one property may not be good for another. One such example is surface modification of CNTs, that generally enhances the mechanical properties but deteriorates the electronic properties [49].
A number of studies has been devoted to the evaluation of the mechanical, electrical and thermal properties of CNT/polymer nanocomposite obtained under different conditions and filler loadings.
Polymer/CNT composites can be fabricated by several methods including solution mixing, sonication, melt compounding and in-situ polymerization [50] [51]. The melt blending process was reported to be the most suitable for the integration of CNTs into the PEEK matrix. This approach presents two main advantages: firstly, it is environmentally sound, due to the absence of organic solvents; secondly, it is compatible with conventional industrial processes, such as extrusion, injection and blow molding [52].
Properties Thermal stability
The thermal stability of nanocomposites is a key parameter for their technological applications. It can be evaluated by thermo-gravimetric analysis (TGA). The incorporation of SWCNTs into PEEK was reported [53] to shift the matrix curve towards higher temperatures which means that the resulting composite is more thermally stable than the initial polymer.
Wang et al. [54] also observed an improved thermal stability on the incorporation of MWCNTs wrapped with poly (ether sulfone) (PES). Which was attributed to the restriction of the thermal motion of PEEK chains making the composites more thermally stable.
However, the thermal stability of PEEK composites did not show a significant improvement with increasing the content of wrapped in PES MWCNTs in PEEK, while the incorporation of increasing SWCNT loading progressively enhanced the stability of the matrix. The observed stabilization was attributed to the above mentioned barrier effect of CNTs, combined with the higher thermal conductivity of the composite that facilitates heat dissipation [53].
The type of CNTs and the preparation procedure affect the decomposition process. Samples prepared with mechano-chemical pre-treatments present higher thermal stability than those obtained by direct mixing; a more uniform and fine dispersion of the CNTs improves the interfacial adhesion between the nanotubes and the matrix and restricts the thermal motion of the PEEK chains, leading to composites thermally more stable. Well dispersed nanotubes hinder the diffusion of the degradation products from the bulk of the polymer to the gas phase and thereby delay the degradation temperatures [53].
20 Chapter 1. Composite materials Crystallization and melting behavior
The dynamic crystallization of composites is of great interest, because it influences the physical properties. Generally, the crystallization and melting behaviour of CNT/polymer nanocomposites is analyzed by differential scanning calorimetry (DSC). The basic principle underlying this technique is that when the sample undergoes a physical transformation such as phase transitions, more or less heat will need to flow to it than to the reference sample to maintain both at the same temperature. The transition temperatures are taken as the peak maximum or minimum in the calorimetric curves.
Diez-Pascual observed a decrease in the crystallization temperature (Tc) with the incorporation of SWNTs in PEEK, whereas they did not significantly modify the level of crystallinity of the composite [53]. These observations were attributed to the fact that nanotubes reduced the crystallization rate of the PEEK matrix, and were explained by a nanoconfinement effect [55]: the CNT network imposes a confinement on polymer chain diffusion and crystal growth which slows down the overall crystallization process, leading to lower values of Tc, for the composites. On the other hand, samples with improved degree of dispersion of the SWCNTs presented slightly higher Tc. The existence of small agglomerates was assumed to make the confinement
effect more important and, consequently, decrease the crystallization temperatures [53]. This behavior differs from that found by Rong et al. [56] who observed a shift of crystallization peaks (Tc) to higher temperature with the incorporation of MWCNTs in a PEEK matrix. They assumed that CNTs increased the amount of nuclei crystallizing per unit volume of the PEEK matrix and rarely blocked the PEEK chains mobility due to weak interaction, thus accelerating the nucleation process on PEEK crystallization at low content.
Both authors observed a decrease in Tc with increasing the filler content, due to
CNT agglomeration and, consequently, intensification of the restrictions on the crystal growth. In general, differences between the levels of crystallinity of the composites are quite small, lower than 5%.
In the case of the melting process, the addition of SWCNTs did not significantly change the melting temperature Tm [53], while the incorporation of MWNTs caused a
little shift to high temperature compared with pure PEEK [56]. Mechanical Properties
The mechanical properties of polymer composites are usually studied by Dynamic Mechanical Analysis (DMA). A sinusoidal stress is applied and the strain in the material is measured allowing one to determine the complex modulus. The temperature of the sample or the frequency of the stress is varied, leading to variations in the complex modulus. This approach can be used to locate the glass transition temperature of the material, as well as to identify transitions corresponding to other molecular motions. The most important parameters obtained from these experiments are the storage modulus E', which gives an idea of stiffness behavior and load bearing capability of the sample and the loss modulus E", which is proportional to the amount of energy dissipated as heat as well as the ratio of the loss to storage modulus tan(δ), related to the degree of molecular mobility in the polymeric material. The glass transition temperature (Tg) can be defined as the peak maximum in the loss modulus
Chapter 1. Composite materials 21 Diez-Pascual et al. conducted the temperature dependent measurements of the storage E' and loss E" moduli for different 1wt% SWNT/PEEK nanocomposites at 1Hz [53]. They observed a progressive decrease in E' with increasing temperature, showing a very strong decay in the temperature range between 138-170°C, which correlates with the glass transition of the material. This drop in the modulus is attributed to an energy dissipation phenomenon involving cooperative motions of the polymer chains [57]. The incorporation of SWNTs induces a remarkable increase in the storage modulus of the matrix at temperatures below the glass transition, which becomes insignificant at higher temperatures. Experimental data reveal a non-linear growth of E' with CNT content, the increase being more pronounced at low concentrations. At very low concentrations, the nanotubes are well dispersed and E' increases rapidly with increasing SWNT content. However, when the concentration gets higher, the nanotubes interact and form small aggregates.
The aforementioned results are in contrast to the study of vapour-grown carbon nanofibres/PEEK composites [58] prepared by injection molding, which revealed a linear increase in stiffness with increasing nanofibre loading. This contradiction can be explained based on the large aspect ratio, high mass density and low flexibility of carbon nanofibers compared to CNTs [59] and on the processing employed that play a key role in the resulting properties of these materials.
The value of the loss modulus of PEEK as a function of temperature exhibits a low broad peak (at around -95°C), attributed to the β relaxation associated with local motions of the ketone groups, and an intense sharp peak (at 148.3°C), denominated the α relaxation whose maximum corresponds to the glass transition temperature (Tg) of
the polymer. The addition of SWNTs results in a reduction of the magnitude of E" at temperatures below Tg. Furthermore, the β relaxation was broadened, smoothed and
shifted to higher temperatures. This suggests that SWNTs act as a barrier for the local movements of the ketone groups. Moreover, the CNTs restrict rotational motion within the polymer chains, causing small increases in Tg, hence in the stiffness of these
systems.
Deng et al. [60] investigated the tensile properties of PEEK/MWNTs, and found increases in the storage modulus with increasing MWNTs loading fraction at both below and above the glass transition temperature; at 25°C, the tensile modulus increased by ~90% for composites including 15wt% MWNTs, and the increment reached ~160% at 200°C. According to those results, the improvement of MWNTs in the mechanical behavior of the matrix is more effective at higher temperatures.
The processing routes and the type of CNTs have a strong influence on the mechanical response of the composites. Samples with higher purity, quality and aspect ratio have higher E'. Composites with a more homogeneous distribution of nanotubes, exhibit higher E' and Tg. Experimental results do confirm that the overall mechanical
performance of CNT/PEEK nanocomposites is well above the required for potential aircraft applications [53].
1.4.1 Conductivity
The incorporation of carbon nanotubes into polymer composites can be used in the electronic and aerospace industries to dissipate heat, shield electromagnetic radiation [61] and prevent the build-up of static charge [62]. The conductivity in the composites results from the formation of a continuous conductive path of CNTs in the polymer matrix at the percolation threshold.
22 Chapter 1. Composite materials Percolation theory
The term percolation was introduced by Broadbent and Hammersley [63] in 1957 to understand the permeation of a gas in a porous medium. The percolation theory deals with statistical properties of disordered sets of objects (links or sites) arranged on a regular lattice (between two nodes for links, nodes for sites). The transport properties of these systems arise from their geometrical and morphological properties.
Percolation on a network
Following the percolation theory [64], the probability of occurrence of a percolation network is null when the proportion of conductive sites p is below a critical threshold
pc. Consequently, the conductivity of the network is zero for 𝑝 < 𝑝𝑐. On the contrary, when the proportion of conducting sites is larger than pc the conductive particles form a percolating network through the insulating network (Figure 1.10).
Figure 1.10. Schematic representation of the percolation on a square lattice of links, depending on the fraction p. The ”backbone” is shown in bold.
The electrical conductivity σ and the probability P of a site to belong to the infinite network increase with the concentration p (Figure 1.11), but two quantities σ and P are not proportional. When all sites are conductive p = 1, the probability of belonging to the percolation network is certain for each site: P(p) = 1. The dotted curve represents the schematic evolution of the probability of a site to belong to the percolation network. The slope of the conductivity is zero at the threshold pc while the
slope of the probability of belonging to the percolation cluster is infinite.
Figure 1.11. The probability P of belonging to the infinite cluster and electrical conductivity σ depending on the content of conductive particles p.
Chapter 1. Composite materials 23 This discrepancy is explained by the diversity of links that make up the network. Many links do not carry any current, because they go nowhere and are called "dead ends" of the grid (Figure 1.12).
Figure 1.12. Schematic representation of a percolating network:
infinite cluster (solid lines), dead ends (bold) and isolated clusters (dotted lines).
The "dead ends" are portions of clusters that are connected to the whole network by a single link. When we erase all the "dead ends", we are left with the “backbone” – the links involved in the conduction of current. This structure corresponds to the geometric skeleton of the percolation network. Deleting a link located on a loop of the geometric skeleton decreases the amount of current passing through the network.
Critical exponents of the percolation
If we consider an infinite network of resistors, the electrical conductivity in the vicinity, but above the percolation threshold (𝑝 > 𝑝𝑐) follows the power law:
𝜎 ∝ (𝑝 − 𝑝𝑐)𝑡
where t is the critical exponent associated with transport properties depending on network dimension.
According to the assumption of the finite size scaling, the dependence of the electrical conductivity on the sample size is assumed to evolve as [64]:
𝜎(𝐿, 𝜉) ∝ {𝜉
−𝑡𝜈, 𝐿 ≫ 𝜉 𝐿−𝑡𝜈, 𝐿 ≪ 𝜉
where L is the network finite size and ξ is the correlation length (average distance between two sites in the same finite cluster) following a power law:
𝜉 ∝ (𝑝 − 𝑝𝑐)−𝜈
where 𝜈 is a universal exponent whose value is 1, 4/3 and 0.89 in 1, 2 and 3 dimensions, respectively.
For a sufficiently large network size (larger than the correlation length), the electrical conductivity σ is independent on the size of the network and can then be described by the equation:
𝜎 ∝ (𝑝 − 𝑝𝑐)𝑡
To verify the above relations, numerical simulations were performed according to the Monte-Carlo method [64]. Initially, networks containing a random mixture of conducting or insulating sites (or links) were simulated numerically. Secondly, the
24 Chapter 1. Composite materials electrical conductivity σ of each obtained network was measured. Figure 1.13 shows the results of numerical simulations at the percolation threshold [64].
Figure 1.13. Variation of the conductivity σ with the network size L in three and two dimensions right at the percolation threshold. The two data sets for two dimensions
refer to different geometries [64].
The electrical conductivity σ of two and three dimensional networks (d=2 and 3, respectively) is represented as a function of their sizes L. These results confirm the power-law dependences of σ on L. According to the literature [64] and [65] the critical exponent t is independent of material and has a theoretical value t~1.6–2.0 for three dimensional, and 1.0–1.3 for two dimensional systems.
Several experimental investigations were in good agreement with the equation for the electrical percolation, but critical exponent t is not universal in many practical systems. For tunneling percolation systems, t becomes material dependent and can be significantly different from 2[66] because of the specific distributions of both conducting and non-conducting phases.
Dynamic percolation
Processing conditions – especially time and temperature – can strongly alter the percolation threshold and conductivity values of composite [67] [68]. This phenomenon results from the ability of the fillers to "self-assemble" [68] in the molten matrix or in thermosets before curing [69], and is known in the literature as "dynamic percolation".
Combessis et al. [67] reported a case of a very low density polypropylene composite. With annealing time the electrical conductivity σ of the composite gradually raised, while the effective percolation threshold pc dropped (Figure 1.14).
![Figure 1.8. a) Phonon dispersion of 2D graphite using the force constants from [23]](https://thumb-eu.123doks.com/thumbv2/123doknet/13549643.419323/20.892.136.734.573.849/figure-phonon-dispersion-d-graphite-using-force-constants.webp)
![Figure 1.19. Electrical conductivity of samples with 8–10wt% of CNTs at different temperatures [70]](https://thumb-eu.123doks.com/thumbv2/123doknet/13549643.419323/35.892.220.760.329.674/figure-electrical-conductivity-samples-wt-cnts-different-temperatures.webp)
![Figure 1.20. Thermal conductivity of PEEK nanocomposite as a function of MWNT concentration [49]](https://thumb-eu.123doks.com/thumbv2/123doknet/13549643.419323/36.892.215.613.296.598/figure-thermal-conductivity-peek-nanocomposite-function-mwnt-concentration.webp)

![Figure 2.8. The shape and position of the G-band in Raman spectra of various carbon materials [108]](https://thumb-eu.123doks.com/thumbv2/123doknet/13549643.419323/48.892.320.550.167.599/figure-shape-position-raman-spectra-various-carbon-materials.webp)


![Figure 2.19. A typical Raman spectrum obtained for a 3wt% PEEK/MWNT composite without considering the background [130]](https://thumb-eu.123doks.com/thumbv2/123doknet/13549643.419323/59.892.283.762.130.427/figure-typical-raman-spectrum-obtained-composite-considering-background.webp)
