HAL Id: inserm-00127763
https://www.hal.inserm.fr/inserm-00127763
Submitted on 30 Jan 2007
HAL is a multi-disciplinary open access archive for the deposit and dissemination of sci-entific research documents, whether they are pub-lished or not. The documents may come from teaching and research institutions in France or abroad, or from public or private research centers.
L’archive ouverte pluridisciplinaire HAL, est destinée au dépôt et à la diffusion de documents scientifiques de niveau recherche, publiés ou non, émanant des établissements d’enseignement et de recherche français ou étrangers, des laboratoires publics ou privés.
Genome-wide linkage screen for testicular germ cell
tumour susceptibility loci.
Gillian Crockford, Rachel Linger, Sarah Hockley, Darshna Dudakia, Lola
Johnson, Robert Huddart, Kathy Tucker, Michael Friedlander, Kelly-Anne
Phillips, David Hogg, et al.
To cite this version:
Gillian Crockford, Rachel Linger, Sarah Hockley, Darshna Dudakia, Lola Johnson, et al.. Genome-wide linkage screen for testicular germ cell tumour susceptibility loci.. Human Molecular Genetics, Oxford University Press (OUP), 2006, 15 (3), pp.443-51. �10.1093/hmg/ddi459�. �inserm-00127763�
Title Page
Genome-wide linkage screen for testicular germ cell tumour susceptibility loci Authors
Gillian P. Crockford1, Rachel Linger2, Sarah Hockley2, Darshna Dudakia2, Lola
Johnson2, Robert Huddart3, Kathy Tucker4, Michael Friedlander4, Kelly-Anne Phillips5,
David Hogg6, Michael A.S. Jewett6, Radka Lohynska7, Gedske Daugaard8, Stéphane
Richard9, Agnes Chompret10, Catherine Bonaïti-Pellié11, Axel Heidenreich12, Peter
Albers13, Edith Olah14, Lajos Geczi14, Istvan Bodrogi14, Wilma J. Ormiston15, Peter A.
Daly15, Parry Guilford16, Sophie D. Fosså17, Ketil Heimdal17, Sergei A.Tjulandin18,
Ludmila Liubchenko18, Hans Stoll19, Walter Weber19, David Forman20, Timothy Oliver21,
Lawrence Einhorn22, Mary McMaster23, Joan Kramer23, Mark H. Greene23, Barbara L.
Weber24, Katherine L. Nathanson24, Victoria Cortessis25, Douglas F. Easton26, D.
Timothy Bishop1, Michael R. Stratton2, Elizabeth A. Rapley2
1. Genetic Epidemiology Division, Cancer Research UK Clinical Centre, St. James's University Hospital, Leeds, UK.
2. Section of Cancer Genetics, Institute of Cancer Research, Sutton, Surrey, UK. 3. Academic Radiotherapy Unit, Institute of Cancer Research, Sutton, Surrey, UK. 4. Dept of Medical Oncology, Division of Medicine, University of New South Wales and Prince of Wales Hospital Randwick, Sydney Australia.
5. Dept of Haematology and Medical Oncology, Peter MacCallum Cancer Centre, East Melbourne, Victoria, Australia.
6. Princess Margaret Hospital and University of Toronto, Toronto, ON, Canada. 7. University Hospital, Dept of Radiotherapy and Oncology, Prague, Czech Republic. 8. Dept of Oncology, Rigshospitalet, Copenhagen, Denmark.
9. Génétique Oncologique EPHE-UMR 8125 Faculté de Médecine Paris-Sud and Service d'Urologie, CHU, Le Kremlin-Bicêtre, France.
10. Génétique Oncologique, Institut Gustave Roussy, Villejuif, France. 11. INSERM U535, Hôpital Paul Brousse, Villejuif, France.
12. Dept of Urological Oncology, Phillips University, Marburg, Germany.
13. Department of Urology, Klinikum Kassel GmbH, Moenchebergstr. 41-43, D-34125 Kassel, Germany.
14. Department of Molecular Genetics and Department of Chemotherapy, National Institute of Oncology, Budapest, Hungary.
15. Department of Medical Oncology, St James’s Hospital, Dublin, Ireland. 16. Cancer Genetics Laboratory, University of Otago, Dunedin, New Zealand. 17. Departments of Clinical Cancer Research and genetics, Rikshospitalet-Radiumhospitalet Trust, Oslo, Norway.
18. Laboratory of Clinical Genetics, Institute of Clinical Oncology, N.N.Blokhin Russian Cancer Research Center, Moscow, Russian Federation.
19.Medical Oncology, University Hospital, Basel, Switzerland.
20. Cancer Epidemiology, University of Leeds, Cookridge Hospital, Leeds, LS16 6QB, UK.
21. Department of Medical Oncology, Barts and The London Queen Mary's School of Medicine, London, UK.
22. Department of Medicine, Indiana University School of Medicine, Indianapolis, USA. 23. Clinical Genetics Branch, Division of Cancer Epidemiology & Genetics, National Cancer Institute National Institutes of Health, Rockville, MD, USA.
HAL author manuscript inserm-00127763, version 1
HAL author manuscript
24. Depts of Medicine and Biostatistics and Epidemology, Abramson Family Cancer Research Institute, University of Pennsylvania School of Medicine, Philadelphia, PA, USA.
25. Department of Preventive Medicine, Keck School of Medicine, USC/Norris Comprehensive Cancer Center, Los Angeles, California, USA.
26. Cancer Research U.K. Genetic Epidemiology Unit, Strangeways Research Laboratory, Cambridge, UK.
Corresponding Author
Dr Elizabeth Rapley
Section of Cancer Genetics Brookes Lawley Building 15 Cotswold Road Sutton, Surrey, SM2 5NG United Kingdom P: +44 208 722 4007 F: + 44 208 722 4452 E: [email protected]
Abstract
A family history of disease is a strong risk factor for testicular germ cell tumour (TGCT). In order to identify the location of putative TGCT susceptibility gene(s) we conducted a linkage search in 237 pedigrees with two or more cases of TGCT. 179 pedigrees were evaluated genome-wide with an average inter-marker distance of 10cM. An additional 58 pedigrees were used to more intensively investigate several genomic regions of interest. Genetic linkage analysis was performed with the ALLEGRO software using two model-based parametric analyses and a non-parametric analysis. Six genomic regions on chromosomes 2p23, 3p12, 3q26, 12p13-q21, 18q21-q23 and Xq27 showed heterogeneity LOD (HLOD) scores of greater than 1, with a maximum HLOD of 1.94 at 3q26. Genome-wide simulation studies indicate that the observed number of HLOD peaks greater than one does not differ significantly from that expected by chance. A TGCT locus at Xq27 has been previously reported. Of the 237 pedigrees examined in this study 66 were previously unstudied at Xq27, no evidence for linkage to this region was observed in this new pedigree set. Overall, the results indicate that no single major locus can account for the majority of the familial aggregation of TGCT, and suggests that multiple susceptibility loci with weak effects contribute to the disease.
Introduction
Testicular Germ Cell Tumour (TGCT) is the most common cancer in men aged 15 – 45 years. Family history is one of the strongest risk factors for the disease (1,2). Approximately 2% of TGCT patients report an affected first degree relative. The relative risk of TGCT to a brother of a case is increased 8 – 10 fold over the general population (1-3). This relative risk among siblings is higher than that reported for most other cancer types, which are typically 2 - 4 (4), and suggests that genetic susceptibility is important in TGCT.
Support for a genetic component to TGCT is also provided by the observation that the frequency of bilateral disease is higher among cases with a family history than those without (1,2). Further evidence is provided by a segregation analysis based on Scandinavian TGCT patients. In this analysis, the familial clustering observed in this series of pedigrees was best explained by a single major gene with a recessive mode of inheritance, an estimated gene frequency of 3.8% and a life-time risk of developing TGCT of 43% among homozygote men (5). A recessive model was also suggested by Nicholson and Harland (6) who performed an analysis based on the age at onset of TGCT and the frequency of bilateral disease.
The search for TGCT susceptibility genes has proven difficult. Large multiple generation pedigrees with many affected individuals of the type which have been critical to identifying the genes underlying hereditary breast, ovarian and colorectal cancer are very rare for TGCT. The majority of TGCT pedigrees described in the literature are affected relative pairs, predominantly siblings (1,2,7,8). Since such families provide relatively weak linkage information, large numbers of pedigrees are
required to achieve adequate power. In 1994 an international collaboration, the International Testicular Cancer Linkage Consortium (ITCLC), was established in order to collect a sufficiently large set of multiple case families for linkage studies. In 2000, using 134 pedigrees with two or more cases of TGCT, 99 of which were compatible with X linkage, we published evidence of linkage of TGCT susceptibility to a locus at Xq27 (7). Among families with a disease distribution compatible with X linkage, the HLOD was 2.01, rising to 4.7 among kindreds containing at least one bilateral TGCT case. In 2003, we reported a linkage analysis of 178 families, analysed for all autosomes showing modest evidence for linkage to chromosome 12 (HLOD=2.05) (8). Here we present the results of an expanded linkage search using 237 TGCT kindreds and a further evaluation of the putative Xq27 region.
Results
The family set
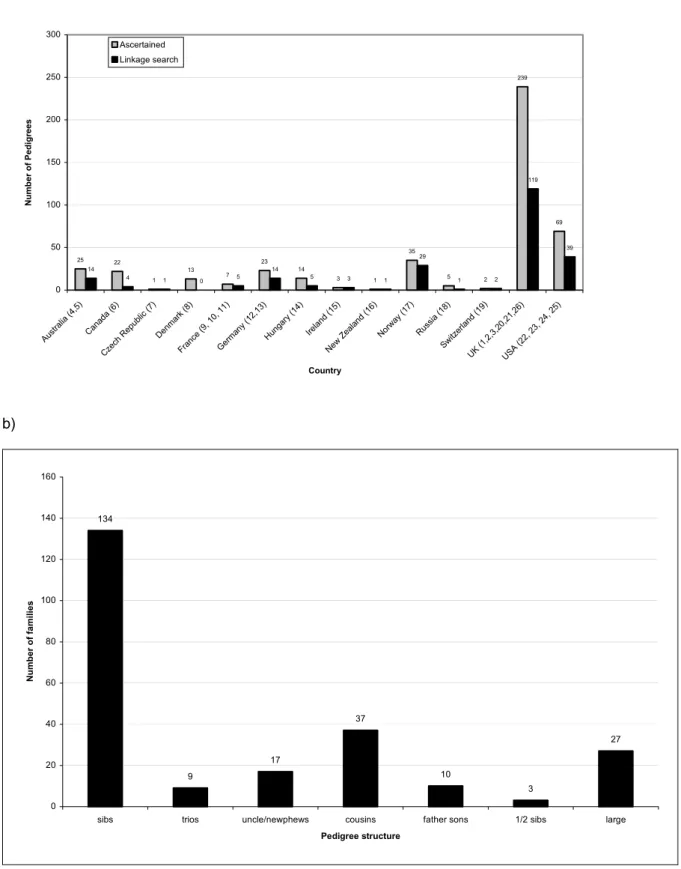
A total of 459 pedigrees with DNA available from ≥1 affected case have been identified by the ITCLC to date (figure 1a). Of these, 237 were considered to be sufficiently well sampled to provide some linkage information and were used in the analysis. The majority of pedigrees examined are affected sib pairs (figure 1b) and approximately 10% of pedigrees examined have 3 or more affected cases.
The 237 families examined in the linkage search included 518 patients with GCT. Forty-two patients from 38 families had bilateral disease. Five patients had extragonadal GCT only. A previous history of an undescended testis was recorded for 51 patients from 41 families. Of the 237 pedigrees examined, 163 (69%) were compatible with X-linked mode of inheritance. Of these, 29 pedigrees had at least one affected case with bilateral disease and 31 pedigrees had at least one case with history of UDT. Histories of both UDT and bilateral disease were reported among members of nine pedigrees. In seven of these pedigrees the bilateral case also had UDT, while in two of these pedigrees the UDT status of the bilateral case was unknown.
Genome-wide analysis.
A total of 252 pedigrees were genotyped in this study. Prior to inclusion in the linkage analysis the pedigree and genotyping data was rigorously checked. The data integrity checks lead to the exclusion of 15 pedigrees. Three of these pedigrees were shown to be monozygotic twin pairs, 8 were excluded because DNA was derived from tumour material and the sample failed to amplify consistently, and 4 demonstrated inconsistent
relationships which could not be resolved. After the checks a total of 237 pedigrees were available for linkage analysis.
A total of 179 pedigrees were examined genome-wide; 143 pedigrees were examined using the Applied Biosystems LMS-MD10 microsatellite screening panel with marker spacing at approximately 10cM and 36 pedigrees were evaluated with a 20cM genome-wide marker map done at an earlier stage of the genome-wide search.
Fifty-eight additional pedigrees for which sufficient material was not available for a genome-wide search or which were ascertained after the primary genome-wide search was performed were examined for regions of interest only. Previous linkage reports (7,8) included data derived from a genome-wide analysis published in 1995 (9). Genotyping for the pedigree set studied in Leahy et al was based on earlier technology, limited maps and markers. Furthermore, we were unable to go back to original data to investigate any queries generated in the data checking process. We therefore excluded this early genotyping data from the current analysis. However we did later genotype the pedigree set studied in Leahy et al. for regions of interest and this set makes up a substantial proportion of the 58 pedigrees without genome-wide genotyping.
Regions of interest on chromosomes 3, 12, and 18 were examined with a dense marker map (1–2 cM between adjacent markers) in 236 pedigrees, there was insufficient material for extensive genotyping in one pedigree and this was genotyped for Xq27 only. All 237 pedigrees were genotyped for the previously reported candidate region on Xq27, 66 of these had not been examined at this region in previous linkage
searches. Table 1 gives a breakdown of the pedigree set and the density of markers utilised in the analysis.
Statistical analysis
All marker loci were assessed for HWE and 7 markers were excluded on the basis of failure to meet this criterion. A further 10 markers were removed due to poor or limited genotyping data. Despite the exclusion of these markers the revised inter-marker distance for these regions did not exceed 10cM.
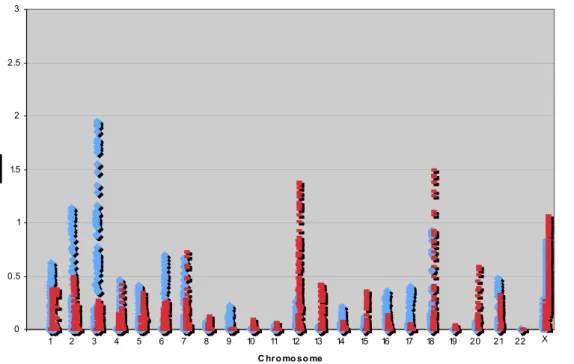
Genome-wide linkage analysis revealed no locus with a statistically significant HLOD score greater than 3 under either the dominant or recessive parametric model; or a locus with a non-parametric linkage (NPL) LOD score greater than 3. Six regions on
chromosomes 2p23, 3p12, 3q26, 12p13-q21, 18q21-q23 and Xq27 showed HLOD
scores greater than 1.0 (figure 2, Table 2). The highest observed HLOD was 1.94, α = 0.27 on chromosome 3q26.
The two pre-specified data subgroups; pedigrees with at least one case of bilateral disease and pedigrees with at least one TGCT case with a history of UDT; were then analysed for each region which showed an HLOD greater than 1.0 for either inheritance model. The HLOD plots for the entire data set, the bilateral subgroup and the UDT subgroup are shown in figures 3a – e. For the regions on chromosomes 2p23, 3p12, 3q26, and 18q21-q23 neither subgroup HLOD exceeded that for the entire data set. The bilateral subgroup showed a higher HLOD than the entire set for the regions on chromosomes 12p13-q21 (HLOD = 2.08; α = 0.42, recessive model) and Xq27 (HLOD = 1.82; α = 0.55), with the region on chromosome 12 showing the
highest HLOD score observed. The UDT subgroup also showed a raised HLOD on chromosome 12 (HLOD 1.66; α = 0.35). No subgroup demonstrated statistically significant HLOD scores.
Analysis of Xq27 region
The previously published analysis demonstrating linkage to Xq27 was based on 99 pedigrees and generated an HLOD of 2.01, α = 0.32 (7). The subset analysis of 15 pedigrees consistent with X linkage (no male-to-male transmission) and with a history of bilateral TGCT demonstrated a statistically significant result (HLOD = 4.76; α = 100%). Further details of this subset, obtained subsequent to publication revealed that one set of twins originally documented as dizygotic was in fact shown to be monozygotic after a genome-wide typing was performed, with all genotyping being identical. A second pedigree in which one case was previously reported to have had bilateral TGCT based on available medical records was shown to be unilateral after the original pathology reports were located and reviewed. This reduced our original subset
to 13 families with bilateral cases, which generated a HLOD of 3.8, α = 100%. In
addition a second X-compatible family was demonstrated to be a monozygotic twin pair after relationship testing and therefore the original set of 99 X-compatible pedigrees was reduced to 97.
The Xq27 region has now been examined in a further 66 pedigrees compatible with X- linked inheritance, including 16 new families with a bilateral case. The HLOD for this new set in the Xq27 region is 0.02; α = 0.03, with an HLOD of 0.11, α = 0.19 in the subset of bilateral cases. The total number of pedigrees now analysed for linkage to
Xq27 is 163 and the overall HLOD in this region is now 1.07, α = 0.18. The entire subset of bilateral families (n = 29) generated an HLOD of 1.82, α = 0.55.
Exclusion mapping and Simulations
For a model with a sibling relative risk of 8, all autosomal loci generate a LOD score of < -2 except for a 10cM region on chromosome 7 (55.40 Mb –66.47Mb) which had an exclusion LOD score of -1.3. For a sibling relative risk of 4, all regions of the autosomal genome were excluded with a LOD score of < -2 except for a 25cM region on chromosome 7 (48.57 – 75.29Mb) and a 10cM region on chromosome 13 (57.00 – 62.15Mb, where the LOD score was between –1.6 and –2.0). However, there is no supportive evidence from either the parametric or non-parametric analysis in favour of linkage in either of these regions.
Two simulation studies were conducted to better understand the observed pattern of HLOD scores. Firstly, to determine empirically the significance of observed linkage peaks, 100 simulations of marker genotypes under the null hypothesis of no linkage
were conducted. We examined the number of peaks expected with a HLOD greater
than 1.0, 2.0 and 3.0 and compared these to our observed data. A peak is defined as a contiguous region (> 1cM) for which multipoint HLOD scores exceed the defined
critical value under either the dominant or recessive model. Autosomal genome-wide
simulations under a null model identified on average 7.38 regions with HLODs ≥ 1.0,
0.70 regions with HLODs ≥ 2.0 and 0.05 regions with HLODs ≥ 3.0. We therefore
observed two HLOD peaks ≥ 1.0 fewer than would be expected by chance (excluding X).
The analyses conducted to date indicate that susceptibility is likely to be heterogeneous (8,10). Simulating a dominant model with all families linked to the disease locus produces an expected HLOD of 19.48 with α = 1.0 far exceeding any observed HLOD. In the second of the simulation studies, to inform the interpretation of the linkage analyses under heterogeneity, we investigated the pattern of results expected when the true model involves heterogeneity. We performed simulations assuming 20% and 30% of our families were linked to a disease locus (i.e. in keeping with the observed estimated proportions of families linked). Under a dominant model, these simulation show we would expect on average HLODs of 0.54 and 1.2, respectively. The highest HLOD peak observed was on chromosome 3q26, which under a dominant model achieves a HLOD of 1.94, α = 0.28. Therefore, under a dominant model we observe peaks with HLODs marginally higher than that we would expect by chance if only 30% of the families were linked. Simulating a recessive model with 20% and 30% of families linked gave HLOD scores of 1.14 and 2.73; respectively. The highest peak observed for a recessive model was on chromosome 18 (HLOD = 1.44; α = 0.12).
Discussion
The genome-wide linkage analysis of this expanded set of TGCT pedigrees found six genomic regions on chromosomes 2p23, 3p12, 3q26, 12p13-q21, 18q21-q23 and Xq27 with an HLOD score > 1, but none of these achieved a HLOD score of 2. Our simulation studies show that the number of peaks observed is similar to that expected by chance. Thus while the observed peaks represent ‘regions of interest’ that need to be pursued with additional pedigrees, we cannot be confident that any harbour a TGCT susceptibility locus. An important observation from the exclusion analyses is that no locus is likely to explain a sibling relative risk of 4. Thus results of these analyses suggest that several loci must contribute to TGCT susceptibility, and that no one locus explains a large fraction of the familial risk.
Critical to any linkage analyses is the number of pedigrees available to be examined and a unique strength of this study is the large number of pedigrees identified through the ITCLC collaboration that includes all known groups worldwide with an interest in familial TGCT. We have therefore been able to conduct a much more powerful genome-wide search than could have been achieved by any individual group. We have taken considerable care to assess the integrity of the genotyping data and have excluded any marker or pedigree that fails our rigorous series of quality control checks. We are therefore confident that there are few errors in this data set. Despite the size of the pedigree set available and given the genetic heterogeneity that the current analysis demonstrates a much larger series would be required to identify TGCT susceptibility genes reliably by linkage analysis. Collection of TGCT pedigrees by the ITCLC is ongoing.
Increasing the density of the marker map could further increase the power to detect linkage, but the gain may not be great since all data were examined by multipoint linkage and any region of interest was examined using a denser marker map. Furthermore, other than two small regions on chromosomes 7 and 13 the exclusion mapping analysis did not suggest regions where a finer marker map would make an impact on the results. Hence, it is unlikely that any major loci have been missed due to inadequate marker spacing.
The linkage evidence supporting a TGCT susceptibility locus at Xq27 has weakened considerably in the expanded family set. Typically once a region of linkage for a specific set has been identified, additional family sets are used to either confirm or refute the published linkage results. The rarity of TGCT in general and familial cases, in particular, has meant that verification of the Xq27 locus could not be attempted until a second confirmatory set was collected. Ideally a confirmatory set would be similar in number to the original series and would come from the same population base. We have now evaluated an additional 66 pedigrees compatible with X-linkage including an additional 16 new bilateral TGCT pedigrees, which is a cohort comparable in size to the original pedigree set. The analysis of the additional pedigree set provided no evidence of linkage to this region and thus this series of families provides no additional support for a locus at Xq27. The potential for genetic heterogeneity across populations exists, but the initial and additional pedigrees come from similar populations so this explanation appears implausible. Analysis of the entire pedigree set compatible with X- linkage still demonstrates a positive HLOD score for Xq27, so a gene in this region cannot be completely excluded. However, these data suggest that if such a gene in
this region does predispose to TGCT, it would account for only a small proportion of TGCT susceptibility.
The original observation of linkage to Xq27 defined a minimal region of interest from the subset of bilateral pedigrees (7). This minimal region at Xq27 contained three genes, the FMR1 gene, a single exon gene Cxorf1 (10) and a tandemly duplicated gene (LOC158813/158812). Prior to the current linkage analysis we had examined each of these genes for small deletions, duplications and point mutations by conformational gel electrophoresis (CSGE) (11) in the series of X compatible families and found no evidence to suggest that germline mutations in any of these genes contribute to TGCT (10).
The worldwide incidence of TGCT has doubled in the last 40 years (12-15). Since this cannot be accounted for by the genetic composition of a population, this trend suggests the potential contribution of as yet unidentified environmental factors in TGCT etiology. Nonetheless, multiple studies (1,5) support the notion that genetic factors are important for TGCT. Our study suggests that susceptibility to TGCT is determined through multiple loci. The probability of identifying TGCT susceptibility genes will be enhanced by the collection of additional families via large consortia-based studies such as the ITCLC; by more precise delineation of the syndromic phenotypes of TGCT and by the utilisation of advances in genomic technology such as ultra-high throughput, high density SNP genotyping, which opens the way for genome-wide SNP association studies.
Materials and methods
Families
Families with at least two cases of TGCT were identified by collaborating groups worldwide and submitted to the ITCLC for study. Patients donated samples and
medical information with full informed consent and under local or national ethical review board approval. Information on clinical status, including type of TGCT, age at
diagnosis, the presence of undescended testis (UDT) and laterality of disease was confirmed by reviewing histological reports and clinical notes. We required at least two affected cases be sampled before genotyping was conducted for a pedigree.
Genotyping
Genomic DNA was prepared from whole blood, immortalised lymphoblastoid cell lines or formalin-fixed, paraffin-embedded tumour sections using standard techniques. The methodology for genotyping has been described previously (7).
Statistical analysis
Data Validation. Markers and individuals with limited genotyping on the basis of poor assay performance or sample quality were excluded from further analysis. Non-Mendelian patterns of marker inheritance were identified using PEDSTATS (16). In rare instances of mendelian errors the data were rechecked and either corrected by re-scoring or set to missing within a family if segregation could not be resolved. Hardy-Weinberg Equilibrium (HWE) tests were performed on all markers, treating the data set as coming from a single population. Markers found not to be in HWE (p<0.01) were excluded from the set. The order of the markers in our genome map was assessed using MERLIN (16) to identify any unlikely recombination events using the whole
genome data. Any errors in the genetic map were corrected with reference to published sequence (http://www.ensembl.org/Homo_sapiens/). Frequent unlikely recombination events within families were interpreted as possible pedigree structure or relationship errors.
The genetic relatedness of family members was tested to identify any differences from the reported family structure. For each relative pair the observed pattern of allele sharing for all markers was compared with that expected for the reported relationship using GRR and PREST (17,18). We excluded monozygotic twin pairs, corrected mis-specified relationships where possible and excluded pedigrees in which observed allele sharing differed significantly from the expected sharing and the inconsistency could not be resolved. All families used in subsequent analyses described in this paper passed these quality-control tests.
Linkage analysis. Genetic linkage analysis was performed with the ALLEGRO (19) software using non-parametric and two model based parametric analyses, reflecting uncertainties about the true underlying mode of inheritance. The parametric linkage analysis inheritance models were based on the described segregation analysis (5). A gene frequency of 0.003 and lifetime penetrance of 0.14 for a dominant model and a gene frequency of 0.03 and penetrance of 0.45 for recessive model were assumed. As no formal segregation analysis has fitted a sex-chromosome-linked model for TGCT, the autosomal recessive model parameter values were assumed for the X chromosome model in this analysis. Using these models, we computed multiple LOD scores at every marker and at four inter marker locations along the genetic map of each chromosome. Since multiple loci are likely to be involved in susceptibility to
TGCT, we compute LOD scores under heterogeneity (HLOD), assuming that a proportion of families α was linked at the locus of interest, and maximising HLOD at each position with respect to α. Analyses were also conducted using the exponential allele sharing model (20) as implemented in ALLEGRO (19). Allele sharing was computed for each affected relative pair and equal weighting given to each family.
In previous studies we analysed families in a number of pre-specified subgroups based on histology, UDT status, age at cancer onset and bilaterality of cancer. For this analysis we limited the subgroups to bilaterality of cancer and history of UDT. Previous analysis (7) showed that age at cancer diagnosis and concordance for histology did not aggregate within families and therefore we did not consider these subgroups in this analysis. We examined subgroups only in regions where the maximum HLOD exceeded 1 for a particular genetic marker. Families were coded as bilateral if one or more cases had either TGCT in both testes or TGCT in one testis and carcinoma in situ (CIS) in the contralateral testis. Patients with a documented extragonadal GCT and a subsequent TGCT were not included in the bilateral series as it was unclear if these were true multiple primaries or metastasis from the same tumour (two cases only). Families were coded as ‘UDT’ if at least one family member with TGCT also reported a history of surgery for UDT (retractile testis or hernia were not included in this subset). For analyses of genetic markers on the X chromosome, families were classified as ‘X compatible’ if there was no evidence of male-to-male transmission between the affected family members.
Map distances were estimated from base-pair distances obtained from ENSEMBL and converted to genetic distances assuming 1 megabase to equal 1cM. Where markers
were not on this map, positions were interpolated based on the position of neighbouring markers on the Marshfield genetic map (21). At each point we computed the maximum HLOD score assuming a completely informative marker, for the whole data set and the subgroups, separately for the dominant and recessive models used in the actual analysis.
To determine those regions unlikely to harbour susceptibility loci, we performed exclusion mapping using GENEHUNTER (22). GENEHUNTER limits analysis to sibling pairs, irrespective of other family members affected. In our data set we have 134 sib pairs, 9 sib trios, 3 half siblings and 27 large pedigrees of which 17 include sibling pairs. These 163 families are used to generate the exclusion values for this part of the statistical analysis. LOD scores were computed under the assumption of a sibling
relative risk (λS) of 8 (corresponding to a single gene explaining all familial aggregation)
and a sibling relative risk of 4 (corresponding to at least two genes explaining all familial aggregation) and no genetic dominance (23). “Excluded” regions were defined as those with LOD < -2.
Simulations were performed to assess the statistical significance of the observed results. 100 replicate data sets were generated under the null hypothesis of no inherited susceptibility. These replicates were analysed using ALLEGRO and the peak HLOD scores plus the number of peaks above a HLOD score of 1.0, 2.0 and 3.0 were recorded. Each replicate was analysed under both dominant and recessive models of inheritance. Simulations were also performed using SLINK under recessive and dominant models (ie the alternative hypotheses) with varying proportions of linked
families to determine the expected peak HLODs and variation in the estimated proportion of families linked at a single locus (24,25).
Acknowledgements
This work would not be possible without the collaborative research efforts of the International Testicular Cancer Linkage Consortium. ITCLC authors are listed in groups by country alphabetically. The first and senior authors (which are not ordered by group) are listed so that their significant contribution to this paper is appropriately recognised. We are indebted to all the testicular germ cell tumour cases and their families that participated in the research and thank them for their support. The UK group would like to thank all the UK oncologists that referred patients to UK study. We would also like to thank the team from the Cancer Genome Project at the Welcome Trust Sanger Centre, particularly Sarah Edkins, Sarah O’Meara and Claire Stevens for technical assistance in generating the genotyping data and Justin Brooking from MRCgeneservice for his assistance in generating genotyping data. Thanks also to Fiona Rapley for assistance in preparing figures for publication.
We would like to recognise the following granting bodies for their support of this work. Cancer Research UK for Mrs Crockford and Profs. Easton, Bishop, Stratton and Dr Rapley. Prof Easton is a Principal Research Fellow of Cancer Research UK. The University of Pennsylvania Research Foundation, the Abramson Cancer Center at the University of Pennsylvania and the Lance Armstrong Foundation for Dr. Nathanson; Hungarian research grant OTKA T046570 and Jedlik Anyos NKFP1-00024/2005 for Dr. Olah; Comité du Cher de la Ligue Nationale contre le Cancer for Dr Richard; the Intramural Research Program of the National Institutes of Health, National Cancer Institute to Drs Greene, McMaster and Kramer and California Cancer Research Program grants 99-00505V-10260 and 03-00174VRS-30021 and National Cancer
Institute grant 1R01 CA102042-01A1 to Dr. Cortessis. . The collection of the USC
component of cancer incidence data used in this study was supported by the California
Department of Health Services as part of the statewide cancer reporting program mandated by California Health and Safety Code Section 103885, the National Cancer Institute's Surveillance, Epidemiology and End Results Program, and the Centers for Disease Control and Prevention National Program of Cancer Registries. The ideas and opinions expressed herein are those of the author and endorsement by the State of California, Department of Health Services, the National Cancer Institute and the Centers for Disease Control and Prevention is not intended nor should be inferred.
Reference List
1. Forman,D., Oliver,R.T., Brett,A.R., Marsh,S.G., Moses,J.H., Bodmer,J.G., Chilvers,C.E., and Pike,M.C. (1992) Familial testicular cancer: a report of the UK family register, estimation of risk and an HLA class 1 sib-pair analysis. Br.J. Cancer, 65, 255-262.
2. Heimdal,K., Olsson,H., Tretli,S., Flodgren,P., Borresen,A.L., and Fossa,S.D. (1996) Familial testicular cancer in Norway and southern Sweden. Br.J.Cancer, 73, 964-969.
3. Hemminki,K., Li,X. (2004) Familial risk in testicular cancer as a clue to a heritable and environmental aetiology. Br.J. Cancer, 90, 1765-1770.
4. Dong,C., Hemminki,K. (2001) Modification of cancer risks in offspring by sibling and parental cancers from 2,112,616 nuclear families. Int.J.Cancer, 92, 144-150.
5. Heimdal,K., Olsson,H., Tretli,S., Fossa,S.D., Borresen,A.L., and Bishop,D.T. (1997) A segregation analysis of testicular cancer based on Norwegian and Swedish families. Br.J.Cancer, 75, 1084-1087.
6. Nicholson,P.W., Harland,S.J. (1995) Inheritance and testicular cancer. Br.J.Cancer, 71, 421-426. 7. Rapley,E.A., Crockford,G.P., Teare,D., Biggs,P., Seal,S., Barfoot,R., Edwards,S., Hamoudi,R.,
Heimdal,K., Fossa,S.D., Tucker,K., Donald,J., Collins,F., Friedlander,M., Hogg,D., Goss,P., Heidenreich,A., Ormiston,W., Daly,P.A., Forman,D., Oliver,T.D., Leahy,M., Huddart,R.,
Cooper,C.S., and Bodmer,J.G. (2000) Localization to Xq27 of a susceptibility gene for testicular germ-cell tumours. Nat.Genet. 24, 197-200.
8. Rapley,E.A., Crockford,G.P., Easton,D.F., Stratton,M.R., and Bishop,D.T. (2003) Localisation of susceptibility genes for familial testicular germ cell tumour. APMIS, 111, 128-133.
9. Leahy,M.G., Tonks,S., Moses,J.H., Brett,A.R., Huddart,R., Forman,D., Oliver,R.T., Bishop,D.T., and Bodmer,J.G. (1995) Candidate regions for a testicular cancer susceptibility gene.
Hum.Mol.Genet., 4, 1551-1555.
10. Rapley E.A, Crockford,G.P., Easton,D.F., Stratton MR, and Bishop,D.T. (2002) The Genetics of Testicular Germ Cell tumours. Germ Cell Tumours, V, 1-22.Springer Press. Eds; Harden P., Joffe JK., Jones WG.
11. Ganguly,A., Rock,M.J., and Prockop,D.J. (1993) Conformation-sensitive gel electrophoresis for rapid detection of single-base differences in double-stranded PCR products and DNA fragments: evidence for solvent-induced bends in DNA heteroduplexes. Proc.Natl. Acad.Sci.U.S.A, 90, 10325-10329.
12. Adami,H.O., Bergstrom,R., Mohner,M., Zatonski,W., Storm,H., Ekbom,A., Tretli,S., Teppo,L., Ziegler,H., and Rahu,M. (1994) Testicular cancer in nine northern European countries.
Int.J.Cancer, 59, 33-38.
13. Bergstrom,R., Adami,H.O., Mohner,M., Zatonski,W., Storm,H., Ekbom,A., Tretli,S., Teppo,L., Akre,O., and Hakulinen,T. (1996) Increase in testicular cancer incidence in six European countries: a birth cohort phenomenon. J.Natl.Cancer. Inst., 88, 727-733.
14. Brown,L.M., Pottern,L.M., Hoover,R.N., Devesa,S.S., Aselton,P., and Flannery,J.T. (1986) Testicular cancer in the United States: trends in incidence and mortality. Int.J.Epidemiol., 15, 164-170.
15. Davies,J.M. (1981) Testicular cancer in England and Wales: some epidemiological aspects.
16. Abecasis,G.R., Cherny,S.S., Cookson,W.O., and Cardon,L.R. (2002) Merlin--rapid analysis of dense genetic maps using sparse gene flow trees. Nat. Genet., 30, 97-101.
17. McPeek,M.S., Sun,L. (2000) Statistical tests for detection of misspecified relationships by use of genome-screen data. Am. J. Hum. Genet., 66, 1076-1094.
18. Abecasis,G.R., Cherny,S.S., Cookson,W.O., and Cardon,L.R. (2001) GRR: graphical representation of relationship errors. Bioinformatics., 17, 742-743.
19. Gudbjartsson,D.F., Jonasson,K., Frigge,M.L., and Kong,A. (2000) Allegro, a new computer program for multipoint linkage analysis. Nat. Genet., 25, 12-13.
20. Kong,A., Cox,N.J. (1997) Allele-sharing models: LOD scores and accurate linkage tests. Am J
Hum. Genet., 61, 1179-1188.
21. Broman,K.W., Murray,J.C., Sheffield,V.C., White,R.L., and Weber,J.L. (1998) Comprehensive human genetic maps: individual and sex-specific variation in recombination. Am. J. Hum. Genet.,
63, 861-869.
22. Kruglyak,L., Daly,M.J., Reeve-Daly,M.P., and Lander,E.S. (1996) Parametric and nonparametric linkage analysis: a unified multipoint approach. Am.J.Hum.Genet., 58, 1347-1363.
23. Risch,N. (1990) Linkage strategies for genetically complex traits. I. Multilocus models. Am. J. Hum.
Genet., 46, 222-228.
24. Ott,J. (1989) Computer-simulation methods in human linkage analysis. Proc. Natl. Acad. Sci.
U.S.A, 86, 4175-4178.
25. Weeks,D., Ott,J., and Lathrop,G.M. (1990) SLINK: a general simulation program for linkage analysis. Am.J.Hum.Genet., 47, A204.
Figure Legends
Figure 1: a) the ITCLC pedigree set by country, numbers beside country correspond to centre and author affiliation, grey bars show pedigrees ascertained by the ITCLC for which a DNA sample from at least one affected case has been collected and submitted to the ITCLC for study. Black solid bars indicate pedigrees examined in the linkage search. b) The ITCLC set used in the current linkage analysis by pedigree structure, all relationships (unless stated) are for relative pairs, ½ sibs = sibling with only one common parent, large = pedigrees with 3 or more cases, other than sib trios.
Figure 2: HLOD plots for the genome-wide analysis. Multipoint linkage analyses are presented by chromosome (X-axis) as HLODs (values above zero) for dominant (blue) and recessive (red) parametric models. Two HLOD peaks were identified on
chromosome 3, figure 3b shows an expanded view of this chromosome demonstrating the two linkage peaks.
Figure 3. HLOD plots for each chromosome demonstrating a HLOD > 1. Each figure shows a plot for the entire pedigree set (blue), the subgroup of UDT pedigrees (yellow) and the subgroup of bilateral pedigrees (red). Approximate positions of markers defining region are shown a. chromosome 2, dominant model HLOD plot ; b. chromosome 3, dominant model HLOD plot; c. chromosome 12, recessive model HLOD plot; d. chromosome 18, recessive model HLOD plot; e. X chromosome, recessive model HLOD plot.
Table 1: Pedigrees examined in linkage search
Chromosomal regions of Interest Number of pedigrees 10cM genome-wide map 20cM genome wide map 3, 12 and 18 Xq27
Genome-wide 143 36 179 179
Regions of interest 0 0 57 58
Total 143 36 236 237
scores > 1
for domi
nant and
recessive model
s of inheri
tance. The table
contains the location
in Mb for the regio
n
>1, the po
int at w
hich the HLOD
maxi
mi
sed,
the marker(s) genotyped in the re
gion, the heterogenei
ty LOD
score
proportion of fa
milies linked at this location (
α
) for both dominant and recess
iv e m ode ls and t he LO D s cor e ty of suscepti bili
ty for the model
where the HL
OD
maximi
sed. The table al
so contai ns the non-parametric link age ) L O D sco re for this lo ca tio n ca
lculated using mul
tipoi nt link age analys is. Dominan t Mo del Recessive Mo del loca tion Maximu m HLOD location (Mb) Region where HLOD >1 (Mb) Markers d efin ing re gion Maximu m HLOD α M ax im um HLOD α LOD score for mo del with highes t HLOD NPL LOD Score 2p23 25.4 0 24.2 0 2 7.95 D2S171 1.14 0. 18 0. 46 0. 09 -19.7 9 (domin an t) 0. 22 3p12 102.05 79.8 3 1 02 .0 5 D3S3681 – D 3S127 1 1. 11 0. 20 0. 14 0. 05 -15.3 3 (domin an t) 0. 22 3q26 164.89 156.34 - 171 .96 D3S1607 – D 3S128 2 1. 94 0. 27 0. 12 0. 05 -15.3 1 (domin an t) 1. 42 1 50.9 2 45.6 2 5 2.36 D12S85 D1 2S368 0. 16 0. 08 1. 38 0. 14 -55.3 0 (r ec es si ve ) 0. 44 3 65.5 9 60.8 7 7 0.28 D18S61 – D1 8S58 0. 25 0. 09 1. 44 0. 12 -59.1 9 (r ec es si ve ) 0. 85 Xq27 146.84 146.51 - 148 .02 DXS5 48 – DXS8091 0. 81 0. 17 1. 04 0. 17 -50.5 7 (r ec es si ve ) 0. 88 27
Figure 1 a) 25 22 1 13 7 23 14 3 1 35 5 2 239 69 14 4 1 0 5 14 5 3 1 29 1 2 119 39 0 50 100 150 200 250 300 Austr alia ( 4,5) Can ada ( 6) Czech Repub lic (7) Den mark (8) Franc e (9, 10, 11) Ger man y (1 2,13 ) Hun gary (14) Ireland (15 ) New Z eala nd ( 16) Norway (1 7) Russia (18) Switzerla nd ( 19) UK ( 1,2,3,2 0,21 ,26) USA (22, 23, 24, 2 5) Country N u m b er of Pe digr ee s Ascertained Linkage search b) 134 9 17 37 10 3 27 0 20 40 60 80 100 120 140 160
sibs trios uncle/newphews cousins father sons 1/2 sibs large
Pedigree structure
Number of
f
a
milies
Figure 2 0 0.5 1 1.5 2 2.5 3 0 1 2 3 4 5 6 7 8 9 10 11 12 13 14 15 16 17 18 19 20 21 22 23 C hro mo so me hlod dom hlod rec X
Figure 3.