HAL Id: hal-01730534
https://hal.archives-ouvertes.fr/hal-01730534
Submitted on 22 Oct 2019
HAL is a multi-disciplinary open access archive for the deposit and dissemination of sci-entific research documents, whether they are
pub-L’archive ouverte pluridisciplinaire HAL, est destinée au dépôt et à la diffusion de documents scientifiques de niveau recherche, publiés ou non,
Cholesteric liquid crystals doped with gold nanoparticles
Rajaa Bitar, Gonzague Agez, Michel Mitov
To cite this version:
Rajaa Bitar, Gonzague Agez, Michel Mitov. Cholesteric liquid crystals doped with gold nanoparticles. Liquid Crystals XVI, I. C. Khoo, Aug 2012, San Diego, United States. pp.847503, �10.1117/12.928359�. �hal-01730534�
Cholesteric liquid crystals doped with gold nanoparticles
Rajaa Bitar, Gonzague Agez, Michel Mitov
*Centre d’Elaboration de Matériaux et d’Etudes Structurales, CEMES, CNRS, Univ. Toulouse,
29 rue J. Marvig, 31055 Toulouse cedex 4, France
ABSTRACT
The reflection color of a cholesteric liquid crystal depends on material parameters such as the molecular chirality or the concentration of chiral dopant, the helical pitch of the twisted structure and the optical indices. We show that the color may be selected simply by varying the annealing time of an open cholesteric oligomer film with hybrid anchoring. The 3D representation of the structure is provided by combining complementary imaging techniques. The color selectivity is due to controlled changes of the orientation of the helix axis with respect to the air-material interface. Potential applications are chiral microreflectors and microlenses. Then, we demonstrate the symbiotic association of gold nanoparticles within such cholesteric textures and their long-range self-organized arrangements. We show that the nanoparticles can be patterned on demand only by playing with the film thickness and the interfacial properties of the CLC film. We investigate how the selective reflection is affected by the in situ organization of gold nanoparticles and what is the plasmon response of nanoparticle chains. Potential applications are envisioned in the field of soft nanotechnology and optical materials.
Keywords: liquid crystals, cholesteric, nanoparticles, gold, self-organization, light reflection, surface plasmon,
transmission electron microscopy.
1. INTRODUCTION
Organizing nanoparticles (NPs) into anisotropic networks is motivated by the development of new optical elements, photonic structures, electronic devices, sensors or metamaterials1. The development of liquid crystal (LC)–NPs
composites allows for investigating the combination of the unique properties of LCs and particles at the nanoscale2,3. As
an anisotropic fluid, a LC is an excellent candidate to drive the NP assembly and to manipulate nanoscale building blocks into functional nanomaterials. The subject of the self-assembly of particles in a LC has been extensively studied over the past two decades, with the aim to fabricate ordered arrays that use the properties of LCs (self-organization properties, polymorphism, variety of textures and patterns, field-switchability) and the collectives properties of NP arrays—like the localised surface plasmon resonance of gold or silver NPs—for the construction of nanodevices2,4. The
majority of studies involving LCs as templates for particle patterning use lyotropic LC phases—for which the presence of a solvent is required–and the nematic (achiral) phase. The present work focuses on the dispersion of GNPs in a thermotropic cholesteric (chiral) LC (CLC).
GNPs are the most frequently studied NPs because their chemical properties and the related stabilizing techniques are likely the best understood5. Their optical properties are governed by coherent oscillations of conduction-band electrons
known as plasmons. Related applications are in photonics, electronics, catalysis, chemical and biological sensing or cancer treatment.
A thermotropic LC, for which the liquid-crystallinity is reached by varying the temperature, is especially adapted when optical and electro-optical properties are aimed. Using a CLC to organize GNPs offers a huge variety of chiral textures (oily streaks, fingerprints and fingering, grids, fan-shaped focal conics, Grandjean steps)6 and the possibility to
investigate the unique optical properties of CLCs (selective light reflection, polarization-selectivity rule, strong optical rotatory power) when it is doped with GNPs. Studies on the self-assembly and the self-organization of GNPs in chiral LC phases are still rare and concerns the cholesteric phase7, 8 or blue phases9-12.
The present work starts from the pioneering work done in 200213, when we demonstrated the long-range organization
of Pt NPs into arrays of parallel lines in relation with the fingerprint texture of a cholesteric thermotropic LC chosen as a
guiding matrix. The material was an open film directly coated on a copper grid for transmission electron microscopy (TEM). The main conclusions of this work13-16 were: (i) the periodicity of NP ribbons was related to the helix periodicity
and a stripe texture with a larger periodicity than the pristine texture was fabricated; (ii) NPs were rejected at the interfaces, and the self-assembly of NPs into fingerprint patterns occurred only close to the air interface where the boundary conditions are homeotropic (the rod-like molecules are perpendicular at the interface); and (iii) the NPs localize in regions that exhibit strong distortions in the molecular-director distribution. The objectives of the present study are: (i) to target the self-assembly of GNPs into various CLC patterns since fundamental investigations and practical uses rely on the 2D or 3D organization of NPs as networks with controlled characteristics (dispersion and distribution of NPs, mutual organization of NPs, anisotropy of patterns); (ii) to generalize the fabrication procedure so that nanostructures may be fabricated on more than just a TEM grid; (iii) to better understand the driving parameters that lead to novel and peculiar patterns; (iv) to directly image the GNP patterns at the meso- and nanoscale by complementary microscopies; and, finally, (iv) to investigate the optical properties (light reflection, plasmon response) of the hybrid nanomaterial.
2. MATERIALS AND METHODS
2. 1. Materials
CLC oligomers from Wacker Chemie GmbH were used. The molecule is a siloxane cyclic chain with two types of side chains attached via spacers: an achiral mesogen and a chiral cholesterol-bearing mesogen17,18. When coated on a
glass or plastic substrate, the compound exhibits typical iridescent colors that range from blue to red upon tuning the molar percentage of chiral mesogens in the oligomer molecule. We have blended so-called silicon blue (SB) and silicon red (SR) compounds at 40:60 wt.% to tune the mean position of the reflection band to the middle of the visible spectrum. The cholesteric phase appears between 180 and 210 °C (clearing temperature range) and 40 to 50 °C (glass-transition temperature range). A thin film with cholesteric organization can easily be quenched below the glass-transition temperature. It becomes a solid film that selectively reflects the light and can be handled at room temperature (RT).
Spherical GNPs functionalized with octanethiol from Sigma Aldrich (ref. 660426) were used. The average GNP
diameter was 3 nm and the particles were suspended in toluene, which is also a very good solvent for the oligomers.
2.2. Methods
Optical textures. We investigated the optical texture of the films in transmission and reflection modes by using a
polarizing microscope (AX70 from Olympus). The images were obtained by using a TRI CCD F22GV camera from Hitachi with a numerical resolution of 0.13 μm/pixel.
Scanning electron microscopy imaging (SEM). We used a JSM-6490 SEM from JEOL. Samples were coated with a
chromium film (thickness was 2 nm) to create a conductive surface and fixed on the support with a carbon-coated adhesive. Investigations were performed in backscattered-electron mode, which provides a composition contrast that distinguishes the gold from the LC surrounding.
Preparation of samples for TEM. A small piece of film was embedded in an epoxy resin and the inclusion was then
cured at 40 °C. Thin slices of material were obtained with an ultramicrotome (UltraCut S from Reichert) by using a diamond knife at RT. The material was cut perpendicularly to the film surface (cross sections) and 80-nm-thick slices were directly retrieved on carbon-coated grids.
TEM conditions. The observations were performed using a TEM (Philips CM30) operating at 300 kV under normal
conditions. This means that the dose of electrons received by the specimen is higher than the critical dose which deletes the diffraction contrast, so the images are produced by thickness diffusion contrast subsequent to irradiation. The contrast was enhanced by means of a slight defocusing.
Atomic force microscopy imaging (AFM). AFM measurements were performed at RT and under ambient conditions
using a Veeco Dimension Icon AFM system controlled by a NanoScope V controller. The images were obtained in tapping mode.
Image analysis. For each annealing time, cross-sections 13 × 120 µm2 in size were rebuilt from about ten TEM images.
The resolution ranges from 16 to 25 nm per pixel. Because the twist axis is perpendicular to the lines in fingerprint texture, the t-vector (unitary vector along the helix axis) is detected by two-dimensional spatial Fourier Transform (FT) performed on windows 64 × 64 pixels in size (we used the free FFTW C subroutine library). The wave vector q of the contrast modulation provides quasilocal information on the natural pitch value p0 and the angle θ. To scan the entire
image, this FT analysis is carried out every 5 pixels in x and z, each time sliding the 64 × 64 window.
Transmittance properties. The film transmittance was investigated at RT and at normal incidence by using a Cary 5000
spectrometer from Varian and an Ocean Optics USB4000 fiber optic spectrometer with an external halogen light source HL-2000 from Mikropack. The incident light was unpolarized.
Extinction spectroscopy. The sample was illuminated with linearly polarized white light. The transmitted light was
collected at RT with a x50 objective (NA = 0.55) and dispersed with a LOT Oriel MS260i spectrophotometer. Along with a 2 mm pinhole, this objective allows to probe a 50x50 μm2 area. A CLC film was used as the reference in order to
extract the extinction spectrum of the GNPs.
3. PROPERTIES OF THE CHOLESTERIC LIQUID CRYSTAL FILM
Figure 1 shows the conditions of the sample preparation. A 13 μm thick film is coated on a glass plate without alignment layer at 140°C (Fig. 1.a). After annealing, the sample is quenched at RT (Fig. 1.b). The spontaneous anchoring is homeotropic close the air interface and planar close to the substrate (the molecules are parallel to the surface).
Figure 1. Preparation conditions of the CLC films. (a) Geometry of the annealing process. (b) After annealing and quenching. (c) Sample.
Without annealing, the sample presents a regular planar Grandjean texture (Fig. 2.a). As soon as the annealing time exceeds 1 minute, the samples exhibit a mosaic of cells and colors (Figure 2.b)—the polygonal texture19,20. Each cell
appears like a dark greenish polygon with a central black spot and is surrounded by a bright green region.
FREE SURFACE 140°C glass CLC heating stage air ~13 µm air glass substrate homeotropic anchoring planar (a) (b) (c)
10 μm
(a)
(b)
10 μmFigure 2. Optical textures of the CLC film at RT: (a) without annealing; (b) after 3 hours of annealing. Transmittance mode. Unpolarized incident light.
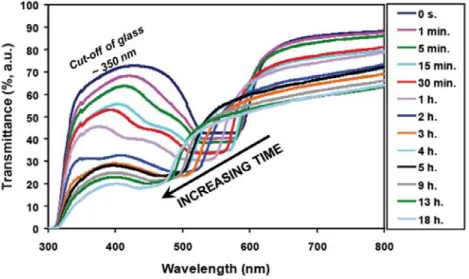
The reflection color changes gradually from green to blue as the annealing time increases from 0 to 18 hours. The transmittance properties upon quenching after different annealing times are reported in Figure 3. The mean position of the band gap shifts progressively from about 560 (0 h) to 460 nm (18 h). This blue shift occurs without significant bandwidth broadening.
Figure 3. Transmittance spectra of the CLC film at RT for different annealing times and after quenching.
The local distribution of the cholesteric periodicity as well as the orientation of the helical axis may be visualized from one interface to the other by TEM. Without annealing (Fig. 4.a), the planar organization permeates the entire layer and the cross-sectional image shows a network of periodic dark and bright lines parallel to both interfaces with some disclination defects—the fingerprint texture. The helical axis is everywhere perpendicular to the lines. For a cut in a direction normal to the axis, the distance between identical lines is approximately the half pitch. Inside the dark (bright) lines, the rod-like molecules are parallel (perpendicular) to the image plane21. Detailed discussions of the origin of the
related line contrast are included in Refs. [21–25]. As soon as the annealing time reaches 1 minute, curved deformations appear close to the air interface where anchoring of the molecules perpendicular to the interface is preferred (which is weaker than the planar anchoring on the substrate). The lines bend with respect to the free surface over a thickness less than 2 μm. As the annealing time increases up to 13 hours, large distortions progressively propagate into the bulk (Fig. 4.b) and an alternating series of concave and convex nested arcs develops.
Air
Glass
(a)
5 µm
(b)
1 µmAFM
SEM
TEM
OM
Figure 4. TEM images of the cross-section of the CLC film: (a) without annealing; (b) after 13 hours of annealing.
Near the surface, the twisted structure cannot readily adapt to the anchoring conditions. One solution to this boundary problem is the creation of a series of alternating disclination lines at the surface. Nested-arc patterns develop because the anchoring at the free surface favors an oblique orientation of the helical axis relative to the surface. Such a situation, which has already been discussed for large-pitch low-molar-mass CLCs19,20, corresponds to the director distribution of
least elastic energy that allows for this surface anchoring together with the bulk planar structure.
AFM and SEM investigations show that the polygon cells are convex cones that exhibit double-spiral fingerprint patterns. The height of the cones is in the 20–100 nm range. The equilibrium relief results from competition between surface energy and the bulk free energy. The energy is lowered by transforming the free surface into a cone, thus reducing the bulk distortion energy by the costs of surface energy. Figure 5 gives a three-dimensional sketch of the structure.
Although nested-arc cholesteric textures have already been observed by TEM in cross-sections of CLC oligomers26,27,
the model used in Ref. [27] does not apply to the nested-arc patterns in the fingerprint texture that we observe just below the free surface. Indeed, on one hand, this model is based on a unique object and, on the other hand, the experimental conditions correspond to cuts oblique to the helical axis, which explains why the authors describe a single focal conic domain that appears like a region of nested arcs embedded in a planar texture. Our experiments reveal an assembly of polygons and the required connections between polygons give priority to the arrangement we depict in Figure 5.
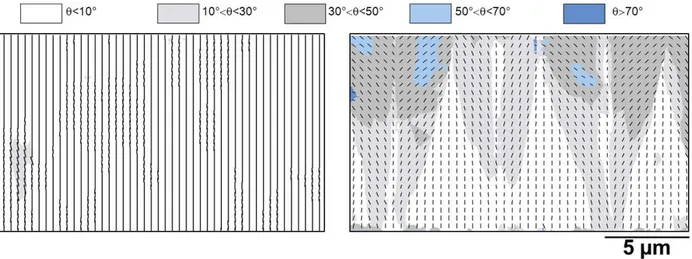
The color reflected by a CLC film with a planar texture depends on material parameters such as the molecular chirality or the concentration of chiral dopant, the helical pitch of the twisted structure and the optical indices. Here, we show that the color may be selected simply by varying the annealing time of a film with hybrid anchoring. The reflection color is thus shifted as a consequence of the unusual distribution of the helical axis orientation at the air-material interface; it is not related to modifications of molecular chirality or helical pitch. It is the reason why we put forward a novel scenario to tune the reflection color of CLC materials. The time-dependent band-shift scenario can be fully described with the help of a single parameter θ, which is the angle between the normal to the film surface and the perpendicular to the lines at every point. Light propagating through the part of the material with nested arcs is reflected by a helical structure whose the orientation is continuously changing. Mappings of the local helical axis have been calculated from TEM images of cross-section and offer the opportunity to quantitatively describe the tilt distribution (Fig. 6). The θ mean square profileσθ along the thickness z of the sample appears to be a very good gauge to estimate
the bulk deformations. The direct relation between σθ and the reflection color of the CLC film is demonstrated in Ref.
[28].
Figure 6. Calculated vector fields of the local helix axis of the CLC film from TEM images shown in Fig. 4: (a) without annealing; (b) after 13 hours of annealing. The black dashes are the t-vectors (unitary vectors along the helical axis). θ is the angle between the normal to the film surface and the perpendicular to the lines at every point.
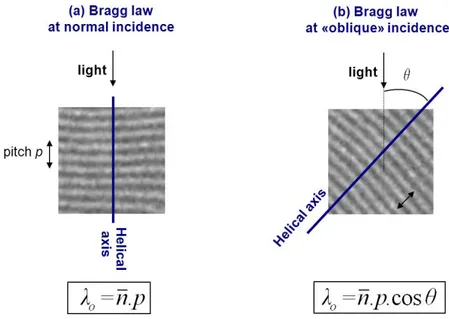
By analogy, the description of the reflection properties in this region would originally correspond to the situation of oblique incidence, whose angle would change as the light propagates (Fig. 7). The transmittance level decreases with annealing time, both inside and outside the Bragg band because the light striking the sample is reflected off axis (it is thus not collected) and the boundaries of cone-like cells create defects that induce some light scattering. In Ref. [28], we discuss the potential use of these results in the field of chiro-optical devices and an analogy with the exoskeleton formation of some beetles.
Figure 7. Schematic representation of the light reflection at normal incidence (the light propagates in a direction perpendicular to the film surfaces): (a) when the texture of the CLC film is planar; (b) when the orientation of the helical axis has rotated.
4. CHOLESTERIC—GOLD NANOPARTICLES HYBRID MATERIAL
4.1. Fabrication method
(1) The CLC mixture is blended with GNPs and toluene. The quantities are chosen to target a final GNP concentration
equal to 1 wt.% after evaporation of the solvent. (2) The solution is put in a vial that is sonicated in water for 1 h. (3) The solution is poured into a glass watch and kept at 140 °C for 5 min to allow the toluene to evaporate. (4) The mixture is introduced at 140 °C between glass plates whose the variable gap is controlled with Mylar spacers. No peculiar surface treatment or alignment layers are used on the glass surfaces. (5) The cell is quenched by putting it swiftly on a metallic substrate at RT. Consequently, the viscous film changes into a solid glassy film. (6) The cell is kept at a low temperature (2 °C) to facilitate the clean removal of the cover glass and to obtain a smooth interface. This process yields an exposed film ready to be annealed. (7) The film is annealed at 140 °C for 18 h. (8) The sample is finally quenched by putting it swiftly onto a metallic substrate at RT. The preferential molecular orientation is planar on the glass substrate and homeotropic at the air-material interface.
4.2. Structural investigations by SEM
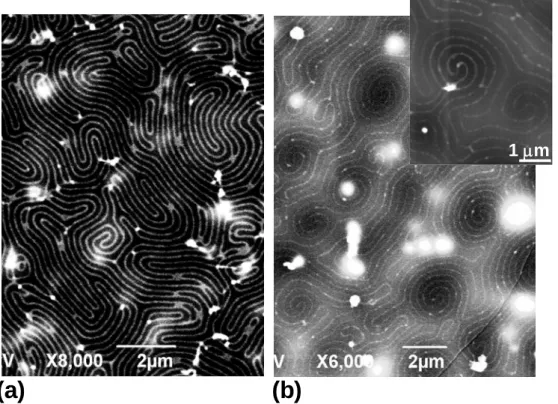
The polygonal optical texture is preserved after doping the CLC with GNPs. GNP aggregates appear and are present immediately after the solvent evaporates (after the end of step n°3); so they are not the consequence of the time-driven self-assembly process. The aggregation phenomenon might be reduced by increasing the sonication and annealing times. SEM in backscattered electron mode is used to investigate the organization of GNPs out of the regions with aggregates. The gold appears in white and light grey in Figure 8. The GNPs exhibit regular fingerprint-type cholesteric textures with parallel lines (Fig. 8.a) and double-spiral patterns (Fig. 8.b). The helical axis is everywhere perpendicular to the lines. The spiral pitch (the distance between two identical lines) is equal to 340 ± 60 nm. This periodicity is greater than the half-pitch of the undoped CLC structure, which is 180 ± 10 nm. The pattern formation is thus a self-assembly mechanism and not a process of decoration of a texture by particles. Every double-spiral corresponds to a polygonal cell and the darker spot in the background associated with a double-spiral corresponds to the relief of the convex cone.
Figure 8. SEM images of patterns gold NPs in a CLC. Gold appears in white and light grey. (a) Fingerprint texture. (b) Network of double spirals.
4.3. Role of the film thickness on the determination of the GNP patterning
The GNP pattern fundamentally depends on the film thickness7. I. For very thin films (<2 μm), the GNP patterns that
appear upon increasing the film thickness are: (1) very short lines associated with the nucleation of GNP ribbons. Because of the symbiotic association of GNPs with the partially unwound helical structure, only ribbon nuclei are visible for the thinnest films; (2) longer lines partially connected together. The frustration relaxes and longer GNP chains may grow; (3) a regular fingerprint texture (Fig. 8.a) with a periodicity equal to 210 ± 20 nm. Only above a film-thickness threshold a network of GNP chains may propagate. II. For films thicker than 2 μm, the GNP patterns that appear upon increasing the thickness are: (4) in the 2 to 12 μm range, GNPs self-assemble into a network of double spirals. The width of the spiral arms depends on the NP density and increases with the film thickness; (5) in the 12 to 25 μm range, GNPs assemble as targets, and additional GNP aggregates are visible. These aggregates are the consequence of the self-assembly mechanism for this peculiar thickness range. III. For films thicker than 25 μm: (6) large-size aggregates form the dominant patterns. When the thickness increases past a threshold, more and more NPs are available to migrate close to the air interface, a saturation phenomenon appears and cholesteric patterns of GNPs are ruined.
The film of nanopatterned GNPs has been formed on a huge variety of substrates: a TEM copper grid coated with a polymer film, a glass plate, a plastic foil, and even the surface of water.
4.4. Light reflection properties
The central reflection wavelength λ0 of a CLC structure is directly related to the helical pitch p by Bragg’s
law: λ0 = npcosθ where n is the average refractive index and θ is the angle between the direction of light propagation and
(a)
(b)
(b)
(a)
the helix axis. As shown in Fig. 9a, the Bragg band is centered at 560 nm and is not significantly modified by the presence of GNPs before annealing. After 18 h of annealing, λ0 shifts from 560 to 450 nm for the pure LC film (Fig. 9b).
The shift of the Bragg band after annealing is always less important when NPs are blended with the CLC. We understand this shift lag like the presence of nps at the air interface that change the anchoring properties of the open film. The existence of a network of self-organized nps at the interface would make the interface stiffer and the propagation of distorsions be delayed. This is more an anchoring effect than a structure change.
Figure 9. Transmittance spectra of CLC films with and without GNPs: (a) Before and (b) After annealing (18h.).
The impact of NPs on the reflection properties of a thermotropic CLC confined in a glass sandwich-cell has previously been addressed in Ref. [29], by using silica NPs with a diameter of 40 nm and a concentration of 3.4 wt.%. The NPs behave like impurities that disrupt the helical structure. Consequently, the reflectivity is inhibited.Our experiments, which use smaller size NPs, provide materials that maintain a helical structure with clear-cut reflection properties and a proper behavior (shift lag) by comparison with that of the undoped material.
4.5. Plasmon response
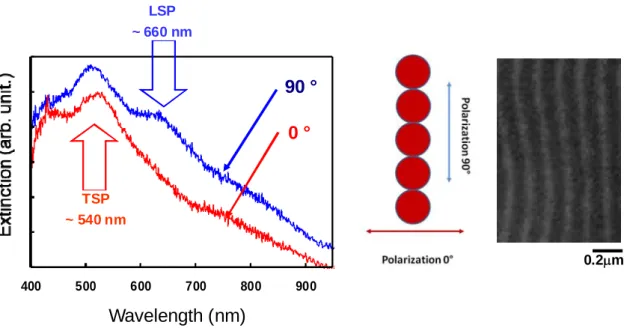
The plasmon response of fingerprint-patterned GNPs in reported in Figure 10. When the polarization of the incident light is perpendicular to the GNP chains, the transverse mode shows a resonance at around 540 nm. When it is parallel to the long axis of GNP chains, the longitudinal mode occurs at higher wavelength, around 660 nm. There is thus a strong coupling between the GNPs, which is characterized by the appearance of an additional band in the extinction spectrum. The longitudinal peak is red-shifted as the chain length increases as shown with simulations30. The modulation of the
optical response depends on the polarization direction, and the plasmon absorption splits into two bands corresponding to the oscillation of the free electrons along and perpendicular to the GNP chains.
Figure 10. Extinction spectra measured on the CLC film doped with GNPs for a polarization of incident light parallel (90°) or perpendicular (0°) to GNP ribbons. TSP: transverse surface plasmon peak. LSP: longitudinal surface plasmon peak.
5. CONCLUSIONS
The color selectivity of CLCs may be tuned by annealing an open film that has hybrid anchoring and a polygonal texture. The blue shift of the reflection band is caused by interface-induced variations of the helical axis orientation, which progressively propagates into the volume with annealing time. A single control parameter—the annealing time– offers the opportunity to selectively tune the reflection wavelength. The choice of the position of the reflection band at the beginning of the process, with also the right film thickness, determines the color range. The formation of the texture is a true self-assembly mechanism since no external action on the anchoring is required. It gives rise to a low-cost controllable template. The description of the polarization state of the reflected light is still pending. It is a complex task because the polarization-selectivity rule is not valid: by analogy, the light reflection in the regions with nested arcs would correspond to the situation of an oblique incidence the angle of which would change when the light propagates.
Then, we disperse GNPs in the CLC open film as the host. A symbiotic association of GNPs with a chiral texture was demonstrated. The nanostructures may be fabricated with high reproducibility and on large surfaces (several mm2). The
open film may be coated onto a huge variety of substrates: the fabrication procedure thus offers a great versatility by comparison with nanopatterned substrates (ridge-and-valley structures), which definitely fix ab initio the periodicity of particle lines and the very nature of the substrate. From TEM and SEM investigations we learn that the patterning occurs close to the air-material interface in regions where distortions in the molecular-director distribution are the strongest. The periodicity of GNP arrays is tunable via the cholesteric pitch. NP aggregation with time may be limited by choosing the right film-thickness range. Although self-assembly occurs at the free surface, the film thickness is a crucial parameter in determining the particular GNP pattern that forms and in avoiding the isotropic aggregation of NPs, such as random clusters, that forms with time. We learn from this work that the right thickness range must be chosen, in addition with the NP concentration. This insight is important because the question of NP aggregation in suspension in a LC, which leads to unstable films, is a topical subject in the field of LC colloids. The use of LC-NP composite for applications has to overcome a number of critical requirements, like the long-term stability of the dispersion of NPs in the LC host. The stability is here present since the host is a solid film. However, the field-switchability property is not available. The characteristics of the CLC host (glassy transition temperature or threshold temperature above it a crosslinked CLC polymer is degraded) have to be tuned in relation with the temperature and manufacturing conditions. When the host is a
400 500 600 700 800 900 0.2μm TSP ~ 540 nm LSP ~ 660 nm
0 °
90 °
Wavelength (nm)
low molar mass LC, liquid crystalline ligands grafted at the surface of NPs can help to improve solubility and miscibility of particles in the LC, hence an expected stability of the final dispersion [3].
We also describe the impact of GNPs on the reflection properties of CLC materials. The presence of GNPs induces a lag in the blue-shift that comes from distortions of the helical-axis-orientation distribution, because GNPs change the nature of the air interface. Preliminary investigations of extinction spectra have shown a strong coupling between the GNPs when the polarization is oriented parallel to the chains, characterized by the appearance of an additional band in the extinction spectrum.
The demonstration herein of the self-organization of NPs into versatile patterns induced by the cholesteric texture is seen as a starting point toward an inexpensive bottom-up technique for on-demand selective positioning and patterning of NPs over large areas. Potential applications are thus envisioned in the field of soft nanotechnology and optical materials.
Acknowledgments
This work was supported by the Agence Nationale de la Recherche (ANR) under grant number 07-NANO-032. We thank: Dr. E. Hanelt from Wacker Chemie GmbH (Munich, Germany) for providing us with oligomers and constant support, Mr. C. Bourgerette (CEMES–CNRS) for his technical assistance with ultramicrotomy, and Prof. N. Felidj (ITODYS, CNRS, Univ. Paris-Diderot, Sorbonne Paris Cité, France) for the investigation of extinction spectra in Fig. 10.
REFERENCES
[1] Y. S. Lee, Self-Assembly and Nanotechnology Systems: Design, Characterization, and Applications, Wiley, Hoboken, New-Jersey (2011).
[2] H. K. Bisoyi and S. Kumar, Chem. Soc. Rev., 40, 306–319 (2011). [3] H. Qi and T. Hegmann, Liq. Cryst. Today, 20, 102-114 (2011). [4] S. Kumar, Chem. Soc. Rev., 35, 83-109 (2006).
[5] M.-C. Daniel and D. Astruc, Chem. Rev., 104, 293-346 (2004).
[6] I. Dierking, Textures of Liquid Crystals, Wiley-VCH, Wienheim, 173–179 (2003). [7] R. Bitar, G. Agez and M. Mitov, Soft Matter, 7, 8198-8206 (2011).
[8] H. Ayeb, J. Grand, H. Sellame, S. Truong, J. Aubard, N. Felidj, A. Mlayah and E. Lacaze, J. Mater. Chem., 22, 78566–7862 (2012).
[9] H. Yoshida, Y. Tanaka, K. Kawamoto, H. Kubo, T. Tsuda, A. Fujii, S. Kuwabata, H. Kikuchi and M. Ozaki, Appl.
Phys. Express, 2, 121501 (2009).
[10] M. Ravnik, G. P. Alexander, J. Yeomans and S. Zumer, Faraday Discuss., 144, 159–169 (2010).
[11] E. Karatairi, B. Rožič, Z. Kutnjak, V. Tzitzios, G. Nounesis, G. Cordoyiannis, J. Thoen, C. Glorieux and S. Kralj,
Phys. Rev. E, 81, 041703 (2010).
[12] M. Ravnik, G. P. Alexander, J. M. Yeomans and S. Zumer, Proc. Natl. Acad. Sci. USA, 108, 5188-5192 (2011). [13] M. Mitov, C. Portet, C. Bourgerette and E. Snoeck, Nature Mater., 1, 229–231 (2002).
[14] M. Mitov, C. Bourgerette and F. de Guerville, in Nanofabrication Technologies, Book Series: Proc. SPIE, 5220, 20– 27 (2003).
[15] M. Mitov, C. Bourgerette and F. de Guerville, J. Phys. Cond. Matt., 16, S1981–S1988 (2004). [16] M. Mitov, F. de Guerville and C. Bourgerette, Mol. Cryst. Liq. Cryst., 435, 673–679 (2005). [17] T. J. Bunning and F.-H. Kreuzer, Trends in Polym. Sci., 3, 318–323 (1995).
[18] F.-H. Kreuzer, N. Häberle, H. Leigeber, R. Maurer, J. Stohrer and J. Weis, in Organosilicon Chemistry III, ed. N. Auner and J. Weiss, Wiley-VCH, Weinheim, 566–586 (1997).
[19] Y. Bouligand, J. Phys., 33, 715-736 (1972).
[20] A. Saupe, Mol. Cryst. Liq. Cryst., 21, 211-238 (1973).
[21] J. Pierron, A. Boudet, P. Sopena, M. Mitov and P. Sixou, Liq. Cryst., 19, 257-267 (1995).
[22] A. Boudet, C. Binet, M. Mitov, C. Bourgerette and E. Boucher, Eur. Phys. J. E, 2, 247-253 (2000).
[23] A. Boudet, M. Mitov, C. Bourgerette, T. Ondarçuhu and R. Coratger, Ultramicroscopy, 88, 219-229 (2001).
[24] T. J. Bunning, D. L. Vezie, P. F. Lloyd, P. D. Haaland, E. L. Thomas and W. W. Adams, Liq. Cryst., 16, 769-781 (1994).
[25] J. Pierron, V. Tournier-Lasserve, P. Sopéna, A. Boudet, P . Sixou and M. Mitov, J. Phys. II France, 5, 1635-1647 (1995).
[26] R. Meister, H. Dumoulin, M.-A. Hallé and P. Pieranski, J. Phys. II France, 6, 827-844 (1996). [27] R. Meister, M.-A. Hallé, H. Dumoulin and P. Pieranski, Phys. Rev E., 54, 3771-3782 (1996). [28] G. Agez, R. Bitar and M. Mitov, Soft Matter, 7, 2841–2847 (2011).
[29] J. C. Payne and E. L. Thomas, Adv. Funct. Mat., 17, 2717–2721 (2007).