HAL Id: hal-02329823
https://hal.archives-ouvertes.fr/hal-02329823
Submitted on 22 Dec 2020
HAL is a multi-disciplinary open access
archive for the deposit and dissemination of
sci-entific research documents, whether they are
pub-lished or not. The documents may come from
teaching and research institutions in France or
abroad, or from public or private research centers.
L’archive ouverte pluridisciplinaire HAL, est
destinée au dépôt et à la diffusion de documents
scientifiques de niveau recherche, publiés ou non,
émanant des établissements d’enseignement et de
recherche français ou étrangers, des laboratoires
publics ou privés.
Giorgia Urbinati, Isabelle de Waziers, Mateja Slamiç, Tobias Foussigniere,
Hafiz Ali, Didier Desmaële, Patrick Couvreur, Liliane Massaad-Massade
To cite this version:
Giorgia Urbinati, Isabelle de Waziers, Mateja Slamiç, Tobias Foussigniere, Hafiz Ali, et al..
Knock-ing Down TMPRSS2-ERG Fusion Oncogene by siRNA Could be an Alternative Treatment to
Flutamide.
Molecular Therapy - Nucleic Acids, Nature Publishing Group, 2016, 5, pp.e301.
Introduction
Nowadays, prostate cancer (PCa) is the most common neo-plasia in males in Western countries (43%) representing the fourth leading cause of cancer-related deaths in men and its incidence steadily increases worldwide.1,2 Generally, for local-ized PCa, patients undertake ablative surgery and/or radio-therapy.3 For recurrent malignancy, the androgen deprivation therapy, based on the association of multidrugs reducing male hormones, or the antiandrogen monotherapy are the first-line treatments based on the driving role of the androgen receptor (AR) in the onset and progression of this pathol-ogy which is often hormone dependent.4 Several approaches have been applied mainly based on decreasing testoster-one levels or via AR antagonists to suppress AR signaling pathway. Since 1989, flutamide (FLU) is considered the gold standard nonsteroidal antiandrogen therapy able to antago-nise androgen binding to its receptor and its shuttling into the nucleus, thus destroying overall the AR signaling path-way.5,6 However, FLU is responsible for several side effects provoking discontinuation of treatment for excessive toxicity. Hence, new molecules with similar antiandrogen activities have been developed such as bicalutamide, nilutamide, and more recently enzalutamide, nevertheless, their toxicological profile is very similar to FLU.6 Moreover, despite the undeni-able effectiveness and benefits derived from androgen depri-vation therapy or antiandrogen monotherapy, most of the patients relapse after few years of antihormonal treatment, and the disease progresses into a castration-resistant form.7
Therefore, there is an urgent need for new strategies based on novel targets or innovative combination therapies.
With the purpose of developing new pharmacological approaches for the treatment of PCa, the fusion oncogene
TMPRSS2-ERG, described by Tomlins et al.8 in 2005, seems
to be a relevant candidate for more specific therapy, such as small interfering RNA (siRNA). TMPRSS2-ERG fusion oncogene is not only detected in 50% of PCa biopsies but also in metastasis supporting the relevance of the oncogene in tumor development and progression.9,10 TMPRSS2-ERG is the consequence of translocation or interstitial deletion in chromosome 21q22 that fuses the 5′-untranslated region of TMPRSS2, carrying androgen-responsive elements, with the encoding region of the oncogenic ETS transcription fac-tor, ERG. As a result, TMPRSS2 drives ERG overexpres-sion in response to androgens. Thus, antiandrogen therapy contributes to ERG downregulation in patients carrying TMPRSS2-ERG by decreasing androgen levels. In contrast, when the same patients evolve into a castration-resistant dis-ease, fusion oncogene TMPRSS2-ERG overcomes AR regu-lation thus contributing to tumor progression.11
Recently, we conceived siRNA to knockdown TMPRSS2-ERG expression but those short fragments of nucleic acids were rapidly metabolized into the blood stream and had poor intracellular diffusion.12,13 Therefore, the “squalenoylation” approach has been used. It is based on the covalent binding of the squalene (SQ), a natural and biocompatible lipid, to siRNA in order to protect siRNA TMPRSS2-ERG from rapid degradation.14 We showed that
Received 15 December 2015; accepted 8 February 2016; published online 29 March 2016. doi:10.1038/mtna.2016.16
2162-2531
e301
Molecular Therapy—Nucleic Acids
10.1038/mtna.2016.16
29March20165
15December2015
8February2016
2016
Official journal of the American Society of Gene & Cell Therapy
siTMPRSS2-ERG: Alternative Therapy to Flutamide?
Our purpose was to develop a new pharmacological approach for the treatment of prostate cancer (PCa), the most common
neoplasia in men. Recently, we developed siRNA against the fusion oncogene TMPRSS2-ERG found in 50% of patients and showed
an antitumoral activity in animal model. Herein, we want to compare or combine the developed siRNA to flutamide (FLU), one of the
gold-standard treatment of PCa. Therefore, concomitant or subsequent association of FLU to siRNA TMPRSS2-ERG was performed
in VCaP cells and in SCID mice bearing xenografted VCaP tumors. ERG, androgen receptor, cleaved-caspase-3 as well as phase 1
and 2 drug-metabolizing enzymes were investigated within tumors. We observed similar results in terms of TMPRSS2-ERG
knock-down and cell viability impairment for all distinct schedules of administration. The association of siRNA TMPRSS2-ERG-squalene
nanoparticles with flutamide displayed similar tumor growth inhibition as mice treated with siRNA TMPRSS2-ERG-squalene
nanoparticles alone and was paralleled with modification of expression of ERG, androgen receptor, and cleaved-caspase-3. Phase
1 and 2 enzymes were essentially affected by FLU and reverted when combined with squalenoylated siRNA. In conclusion, these
results confirm the therapeutic effectiveness of squalenoyl siRNA nanomedicine for PCa based on siRNA TMPRSS2-ERG.
Molecular Therapy—Nucleic Acids (2016)
5, e301; doi:
10.1038/mtna.2016.16
; published online 29 March 2016
Subject Category: siRNA, shRNA and miRNAs; Therapeutic proof of concept1Vectorology and Anticancer Therapies, UMR 8203, CNRS, Univ. Paris-Sud, Gustave Roussy, Université Paris-Saclay, Villejuif, France; 2INSERM UMR-S1147, 45 rue
des Saints Pères, Paris, France; 3University College of Veterinary and Animal Sciences, Bahawalpur, Pakistan; 4Institut Galien, UMR 8612 CNRS, Univ. Paris-Sud,
Uni-versité Paris-Saclay, Châtenay-Malabry, France. Correspondence: Liliane Massaad-Massade, Vectorology and Anticancer Therapies, UMR 8203, CNRS, Univ. Paris-Sud, Gustave Roussy, Université Paris-Saclay, Villejuif, France. E-mail: liliane.massade@gustaveroussy.fr
Knocking Down TMPRSS2-ERG Fusion Oncogene by
siRNA Could be an Alternative Treatment to Flutamide
Giorgia Urbinati1, Isabelle de Waziers2, Mateja Slamiç1, Tobias Foussignière1, Hafiz M Ali1,3, Didier Desmaële4, Patrick Couvreur4 and Liliane Massaad-Massade1
the resulting bioconjugate was able to self-assemble as nanoparticles (NPs) and inhibit PCa growth in mice bearing VCaP xenografted tumors. Moreover, the tumor growth inhibi-tion was tightly correlated with a decrease in the oncoprotein expression and with a partially restored differentiation.15
Now, with the aim to elucidate if combining TMPRSS2-ERG suppression with impairment of AR signaling might have pos-itive outcomes, or if the knockdown of fusion oncogene may represent an alternative strategy to hormone therapy, we combined siRNA TMPRSS2-ERG with FLU. We postulated that, in case of a synergistic enhancement of drug efficacy, FLU doses could be decreased substantially, thus allowing to hinder side effects. Similarly to other studies investigating associations between small molecules and oligonucleotides, FLU was used in this study at the concentration able to inhibit only 25% (IC25) of PCa cell growth.16,17
In parallel with the understanding of the possible ben-efits obtained from the combination of FLU with siRNA TMPRSS2-ERG, we also monitored in xenografted PCa, the transcriptional modifications of the main drug-metabolizing enzyme systems (MDMES) by each molecule alone or by the combination. The studied MDMES are phase 1 and 2 enzymes involved in drug functionalization and conjugation, respec-tively. FLU has been described to be metabolized mainly by cytochromes P450 (CYP) 1A2 and to a lesser extent by CYP 3A4 (refs. 6,18). In contrast, very little is known in literature about the modifications of CYP and phase 2 MDMES such as glutathione S-transferases (GST), uridine-5′-diphosphate glucuronosyltransferases (UGT), N-acetyltransferase (NAT), and sulfotransferase (ST) induced by the siRNAs and/or their vehicles when combined with other drugs. Therefore, tran-scriptional changes of MDMES should be more deeply inves-tigated since there might be a tight correlation between these variations and the efficacy and/or toxicity of siRNA combina-tions with other drugs.
In this report, we confirm the therapeutic interest of nano-medecine based on siRNA TMPRSS2-ERG as an alternative to FLU.
Results
Optimization of androgens and antiandrogens on TMPRSS2-ERG gene expression and on VCaP cells viability
VCaP cell line was used in this study since it is described to be (i) hormone-dependent, (ii) tumorigenic in immunode-ficient mice, and (iii) harboring TMPRSS2-ERG fusion onco-gene which is regulated by androgens.19
First, we explored the physiological concentration of dihydrotestosterone (DHT) able to stimulate mRNA levels of TMPRSS2-ERG and TMPRSS2 wild type by designing two primers, one covering TMPRSS2-ERG and the other outside the junction sequence. According to the literature, it should be approximately close to 10 nmol/l and the opti-mal incubation time of 24 hours.11,20,21 Therefore, VCaP cells were stimulated with 5, 10, and 50 nmol/l DHT, and the relative mRNA level of TMPRSS2-ERG was assessed. As shown in Figure 1a, a statistical increase of about 10-fold in TMPRSS2-ERG expression was observed in cells treated with 10 and 50 nmol/l of DHT. When the TMPRSS2 gene was
investigated by using a specific primer amplifying the region not involved in the fusion, a more pronounced increase in mRNA levels of about 25-folds was observed when com-pared to untreated cells (Figure 1b). In both a and b panels, the maximal induction was obtained when VCaP cells were stimulated with 10 nmol/l of DHT. Beyond that, a plateau was reached when the concentration was further increased (50 nmol/l) (Figure 1a,b). Therefore, according to these data and previously published observations,11 kinetics studies were performed at stimulating VCaP cells with 10 nmol/l of DHT.
At this optimal concentration, kinetics studies showed a statistical decrease for both mRNA levels (TMPRSS2-ERG and TMPRSS2) when cells were incubated for more than 24 hours (48 and 72 hours) (Figures 1c,d). These results are also in accordance with previously published studies showing that the optimal DHT stimulation is found at 24 hours.11,20,21
Then, we studied the effect of FLU by MTT test and found that cell viability was affected in a dose-dependent man-ner (Figure 1e). The calculated IC50 and IC25 of FLU were 121 ± 3 and 64 ± 11 µmol/l, respectively, and the latter was used in further studies to investigate the association between FLU and siRNA TMPRSS2-ERG. Thus, kinetic studies were performed to investigate TMPRSS2-ERG gene expression in presence of 70 µmol/l FLU. Figure 1f depicted a drastic reduction in TMPRSS2-ERG mRNA expression when VCaP cells were treated with the antiandrogen only for 48 hours that slightly increased later or reached a plateau at 72 hours. Therefore, for further studies, DHT was applied at 10 nmol/l, 24 hours before treatment with: (i) FLU (70 µmol/l for at least 48 hours) or (ii) siRNA TMPRSS2-ERG (50 nmol/l for at least 48 hours) as previously described,15 or the combined treatments of FLU (70 µmol/l) plus siRNA TMPRSS2-ERG (50 nmol/l) for 48 hours.
Combination of siRNA TMPRSS2-ERG and FLU inhibits fusion oncogene and oncoprotein as much as the siRNA TMPRSS2-ERG alone
To understand which administration schedule would be the most appropriate to extensively inhibit the TMPRSS2-ERG fusion products, several combinations of siRNA TMPRSS2-ERG with FLU were tested (Figure 2). As previously shown in Figure 1f, shorter incubations (24 hours) are not sufficient to observe any inhibitory activity of FLU on the fusion products, hence longer incubations were tested. The cells were transfected with siRNA TMPRSS2-ERG: (i) before treatment with FLU (Figure 2a), (ii) 24 hours after the FLU was added (Figure 2b), or (iii) con-comitantly with FLU (Figure 2c). As previously observed,15 siRNA TMPRSS2-ERG alone statistically decreased oncogene and oncoprotein expression of about 60–80% if cells were transfected before (Figure 2a, bar 4), after (Figure 2b, bar 4), or concomitantly with FLU administration (Figure 2c, bar 4). The siRNA control slightly increased, however not significantly, the TMPRSS2-ERG mRNA level that was not reflected on the protein content (Figure 2a–c, bar 2). Except for condition a, FLU alone (Figure 2b,c, bar 6) or combined with the siRNA control (Figure 2a–c, bar 3) was also able to decrease TMPRSS2-ERG expression, however, to a lower extent than the siRNA TMPRSS2-ERG alone. Concerning administration schedule a, the combination of siRNA TMPRSS2-ERG to FLU showed the highest decrease in TMPRSS2-ERG mRNA expression
but is not reflected on protein content since ERG translation is already strikingly suppressed by siRNA TMPRSS2-ERG or FLU alone (Figure 2a). For the b and c tested administration schedules, when the siRNA TMPRSS2-ERG was combined to FLU, the mRNA level of TMPRSS2-ERG was similar to the cells receiving the siRNA TMPRSS2-ERG alone (Figure 2b,c, bars 4 and 5). Herein, protein content reflected mRNA behavior (Figure 2b,c).
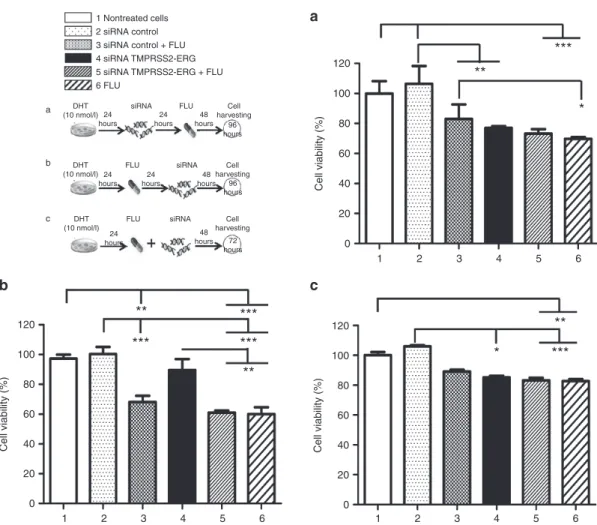
Combination of siRNA TMPRSS2-ERG and FLU did not increase VCaP cell viability impairment
In most cases, an impairment of cell viability was observed for all the treatments (siRNA TMPRSS2-ERG (bar 4), FLU (bar 6), or combined molecules (bars 3 and 5)) and this, at all-time administration schedules compared to controls (vehicle (bar 1) and to siRNA control alone (bar 2)) (Figure 3). Worth of notice, no statistical difference was observed between com-bined treatments (bar 5) and each molecule alone (bars 4 and 6) unless when siRNA TMPRSS2-ERG was adminis-tered after FLU (Figure 3b, bar 4). As expected, the siRNA control (bar 2) did not affect VCaP cell viability unless if
combined with FLU (bar 3) whose effect is comparable with the treatment of the drug alone (bar 6).
Physicochemical properties of siRNA-SQ NPs
To preserve properties and efficacy of siRNA in vivo, both siRNA TMPRSS2-ERG and its corresponding siRNA control were covalently bound to the squalene to form an amphiphi-lic bioconjugate able to self-assemble as NPs in aqueous solutions.14 The synthesis of the bioconjugate was monitored by reverse-phase high-performance liquid chromatography. The increase in the lipophilic character of the siRNA when linked with squalene was indicated by the appearance of a retarded peak in the chromatogram testifying the formation of the siRNA-SQ conjugate. After hybridation of the biocon-jugates (siRNA TMPRSS2-ERG-SQ and siRNA control-SQ) with the corresponding antisense strand and nanoprecipita-tion in water, the resulting NPs were monitored by laser light scattering analysis. The depicted size was of ~ 250 ± 50 nm (five independent measurements). As explained in our previ-ous study, the NPs siRNA TMPRSS2-ERG-SQ are not inter-nalized in vitro and were only efficient in preclinical studies.15
Figure 1 Optimization of DHT and FLU concentrations and kinetics studies. (a and b) VCaP cells were stimulated with DHT at 5, 10, and 50 nmol/l for 24 hours. Cells were then harvested, mRNA collected, and RT-qPCR were performed to determine the relative mRNA levels of (a) TMPRSS2-ERG and (b) TMPRSS2 wild type. A significant difference was found between untreated and DHT-treated cells at 10 and 50 nmol/l. VCaP cells were incubated at 10 nmol/l DHT for 24, 48, or 72 hours and mRNA levels of (c) TMPRSS2-ERG and (d) TMPRSS2 wild type were determined. A statistical increase of mRNA levels was observed at 24 hours of stimulation compared to untreated cells. (e) The MTT viability assay was used to determine the IC50 and IC25 of FLU on VCaP cell line. First cells were incubated with DHT (10 nmol/l) for 24 hours, then different concentrations of FLU (50 < µmol/l < 250) were administered, and cells were incubated for 48 hours. Linear regression of plots calculated IC50 ~ 120 µmol/l and IC25 ~ 70 µmol/l. (f) VCaP cells were stimulated with DHT (10 nmol/l) for 24 hours then incubated with 70 µmol/l of FLU for 24, 48, and 72 hours. After RT-qPCR, a statistical difference was found between cells treated for 48 and 72 hours with FLU compared to untreated cells. The nonparametric Kruskal–Wallis statistical analysis followed by comparative Dunn’s tests were performed using GraphPad software.*P < 0.05, **P < 0.01. Bars represent at least two independent experiments performed in duplicates ± SD. DHT, dihydrotestosterone; FLU, flutamide.
0 5 10 15 Relativ e TMPRSS2-ERG mRNA le vels 0 5 10 15 Relativ e TMPRSS2-ERG mRNA le vels 0.0 0.5 1.0 1.5 Relativ e TMPRSS2-ERG mRNA le vels Relativ e TMPRSS2 mRNA le vels 0 5 10 DHT (nmol/l) 50 0 5 10 DHT (nmol/l) 0 50 100 150 200 250 FLU (µmol/l) 50 0 24 48 72
DHT incubation time (hours)
0 24 48 72
FLU incubation time (hours)
0 24 48 72
DHT incubation time (hours)
*
*
**
**
**
0 10 20 30 Relativ e TMPRSS2 mRNA le vels Cell viability (%) 0 10 20 30 120 100 80 60 40 20 0a
b
c
d
e
f
Combined siRNA TMPRSS2-ERG-SQ NPs with FLU inhibits tumor growth in vivo similarly to siRNA TMPRSS2-ERG-SQ NPs alone
The treatment administration schedule in mice was based on the in vitro results wherein, the greatest inhibition of TMPRSS2-ERG fusion oncogene products and cell viability were obtained when the siRNA TMPRSS2-ERG was trans-fected with lipofectamine. This was observed when cells were transfected with siRNA TMPRSS2-ERG and then treated with FLU for 48 hours (condition a in previous experiments). As mentioned in the Material and Methods section, com-bined or single treatments were administered to SCID mice over 5 weeks at cumulative doses of 0.8 mg/kg for squale-noylated siRNA NPs and of 11.2 mg/kg for FLU. As shown in
Figure 4a, when siRNA TMPRSS2-ERG-SQ NPs alone or combined with FLU were injected, tumor growth was strik-ingly inhibited compared to mice treated with saline solution
(decrease of tumor growth of about 50%, P < 0.01) or siRNA control-SQ NPs (decrease of tumor growth of about 60%, P < 0.001). When mice were treated with FLU alone or com-bined to the siRNA control, only a slight inhibition of tumor growth of about 20% was noticed that not reached signifi-cant difference comparatively to control treatments (NaCl, siRNA control-SQ NPs). The growth curve corresponding to antiandrogen-treated mice showed intermediate growth inhi-bition behavior between the control and treated mice groups explaining the absence of significance.
Tumors collected at the end of the experiment were analyzed by western blot for the expression of ERG onco-protein, AR, and cleaved caspase-3. ERG protein expres-sion was inhibited within the tumors treated with siRNA TMPRSS2-ERG-SQ NPs alone or combined with FLU ( Figure 4b, lines 4 and 5, respectively). The expression of AR was downregulated when tumors were treated with FLU
Figure 2 Effects of combined siRNA TMPRSS2-ERG and FLU on fusion expression. VCaP cells (8 × 10⁵ cells/well in a 6-well plate) were
stimulated with DHT (10 nmol/l) 24 hours before treatments. Twenty-four hours later, (a) cells were transfected either with siRNAs TMPRSS2-ERG or siRNA control at 50 nmol/l and, 24 hours later, FLU (70 µmol/l) was administered. Cells were then incubated for 48 hours. (b) FLU (70 µmol/l) was administered, and cells were successively transfected 24 hours later with either siRNAs TMPRSS2-ERG or siRNA control at 50 nmol/l. Cells were then incubated for 48 hours. (c) Cells were transfected either with siRNAs TMPRSS2-ERG or siRNA control at 50 nmol/l, and FLU (70 µmol/l) was administered at the same time. Cells were then incubated for 72 hours. For all conditions, cells were harvested then RNA and proteins were collected. Concerning mRNA levels, a statistical difference was observed between controls (untreated cells and siRNA control) and all treatments for a and c conditions, whereas only the siRNA TMPRSS2-ERG alone or combined with FLU showed a significance for condition b. For statistical analysis, the nonparametric Kruskal–Wallis followed by comparative Dunn’s tests were performed using GraphPad software. *P < 0.05; **P < 0.01; ***P < 0.001. Bars represent the mean ± SD of three independent experiments in duplicates. ERG protein was detected for each condition (a, b, and c) by western blot analysis. GAPDH was used as internal control. Western blot findings are consistent with mRNA behaviors toward treatments. DHT, dihydrotestosterone, FLU, flutamide.
0.0 ERG GAPDH 0.5 1 2 3 4 5 6 1 2 3 4 5 6 1 2 3 4 5 6 1.0 1.5 1 Nontreated cells 2 siRNA control 3 siRNA control + FLU 4 siRNA TMPRSS2-ERG 5 siRNA TMPRSS2-ERG + FLU
a b c 6 FLU
**
***
***
**
*
*
*
Relativ e mRNA le vels 0.0 ERG GAPDH 0.5*
1.0 1.5 Relativ e mRNA le vels 0.0 ERG GAPDH 0.5 1.0 2.0 1.5 Relativ e mRNA le velsa
b
c
DHT (10 nmol/l) DHT (10 nmol/l) DHT (10 nmol/l) siRNA FLU 24 hours 24 hours 24 hours hours48 24 hours 24 hours 48 hours 48 hours 96 hours 96 hours 72 hours Cell harvesting siRNA FLU Cell harvesting siRNA FLU Cell harvestingalone (line 6) but to lower or no extent when FLU was com-bined to siRNA (TMPRSS2-ERG or control)-SQ NPs (lines 5 and 3, respectively). Moreover, in tumors treated with siRNA TMPRSS2-ERG SQ NPs alone (line 4) or combined with FLU (line 5), a slight increase in expression of cleaved caspase-3 was clearly observed suggesting an increase of apoptotic cells within the tumors, which was not observable after the other treatments (saline solution treated tumors or siRNA control-SQ NPs with or without FLU or FLU alone).
Combined treatments mostly inhibit cytochrome P450 enzymes induction by flutamide
First, we screened the expression profile of 34 CYP mRNAs isoforms of CYP1, CYP2, CYP3, CYP4, and CYP46 in untreated xenografted tumors. The sequence of TATA box binding protein was used as internal control. The cycle threshold of 30 was imposed in order to obtain reliable results from real-time PCR (Figure 5a).
Among the 34 CYP isoforms studied, only CYP2 and CYP4 families were found to be expressed within the tumors and
more precisely the following isoforms: CYP2D6, CYP2J2, CYP2R1, CYP2U1, CYP2W1, CYP4F8, CYP4F12, and CYP4F22. The CYP1A2 described to be responsible of FLU metabolism18 was not found in our VCaP xenografted tumors.
Then, we studied the expression of the isoforms after treatments and found a significant difference in the mRNA expression of five isoforms: CYP2D6, CYP2R1, CYP4F8, CYP4F12, and CYP4F22 (Figure 5b–f). This significance is mainly due to FLU treatment (bars 6) except for CYP2D6 (Figure 5b), however, for this isoenzyme, an mRNA inhibi-tion of 50% was observed when the tumors were treated with siRNA TMPRSS2-ERG-SQ NPs alone or combined with FLU (bars 4 and 5, respectively). The inhibition was significant and specific of targeted siRNA TMPRSS2-ERG-SQ NPs, while that of siRNA control-SQ NPs (bars 2) was not different from the other treated groups. CYP2R1 expression was signifi-cantly increased by FLU alone (Figure 5c, bar 6) compared to saline solution or siRNA control-SQ NPs treated tumors (bars 1 and 2, respectively); however, none of the other treat-ments seems to modify the expression of this isoform.
Figure 3 Effects of combined siRNA TMPRSS2-ERG and FLU on cell viability. VCaP cells were stimulated with DHT (10 nmol/l) 24 hours before treatments. The next day, (a) cells were transfected either with siRNAs TMPRSS2-ERG or control at 50 nmol/l, and 24 hours later, FLU (70 µmol/l) was added. Cells were then incubated for 48 hours. (b) FLU (70 µmol/l) was administered, and cells were successively transfected 24 hours later with either siRNAs TMPRSS2-ERG or control at 50 nmol/l. Cells were then incubated for 48 hours. (c) Cells were transfected either with siRNAs TMPRSS2-ERG or control at 50 nmol/l, and FLU (70 µmol/l) was administered concomitantly. MTT viability test was performed, 100% cell viability corresponds to the number of living cells incubated with vehicle. Results are the mean ± SD of two independent experiments containing eight replicates for each condition. The nonparametric Kruskal–Wallis followed by comparative Dunn’s tests were performed for statistical analysis. *P < 0.05; **P < 0.01, ***P < 0.001. DHT, dihydrotestosterone; FLU, flutamide.
1 2 3 120
**
***
***
***
**
*
***
**
*
***
**
100 80 Cell viability (%) 60 40 20 0 120 100 80 Cell viability (%) 60 40 20 0 120 100 80 Cell viability (%) 60 40 20 0 4 5 6 1 2 3 4 5 6 1 2 3 4 5 6 1 Nontreated cells 2 siRNA control 3 siRNA control + FLU 4 siRNA TMPRSS2-ERG 5 siRNA TMPRSS2-ERG + FLU 6 FLU a b c DHT (10 nmol/l) DHT (10 nmol/l) DHT (10 nmol/l) siRNA FLU 24 hours 24 hours 24 hours hours48 24 hours 24 hours 48 hours 48 hours 96 hours 96 hours 72 hours Cell harvesting siRNA FLU Cell harvesting siRNA FLU Cell harvestinga
c
b
A similar behavior was observed, with more striking results when family 4 of CYP was observed (Figure 5d–f). Indeed, FLU alone was able to induce from 5- to 500-fold in the expression of CYP4F8 (Figure 5d), 4F12 (Figure 5e), 4F22 (Figure 5f), though this effect was completely reversed or reduced when the drug was associated with siRNAs-SQ NPs (TMPRSS2-ERG or control).
Combined treatments respond differently to induce the main phase II drug metabolizing enzymes by flutamide
The enzymes mainly involved in phase 2 of drugs metabo-lism (conjugation enzymes, including several transferases) and epoxide hydrolase (EH) were also investigated. As previ-ously mentioned, the cycle threshold (Ct) of 30 was imposed in order to obtain reliable results from qPCR. GSTα, µ or π isoforms, EH and UGT1A1 were found to be expressed within the tumors (Ct < 30); NAT1 was expressed at the limit of 30 Ct in saline solution treated mice; however, it reached higher expression for all other treatments; thus, it was included in the study. The ST showed a signal beyond 30 Ct for all the treated tumors; thus, no relative quantification (ΔΔCt) was calculated for this enzyme (Figure 6a).
GSTα and EH did not show significant modification by any treatment. NAT1, UGTA1, GSTπ1, and GSTµ1 showed the same profile (Figure 6b–e). A significant upregula-tion of phase 2 drug-metabolizing enzymes mRNA was observed when mice were treated with siRNA control-SQ NPs combined with FLU (bar 3), siRNA TMPRSS2-ERG-SQ NPs (bar 4), and FLU alone (bar 6). However, the siRNA TMPRSS2-ERG-SQ NPs combined with FLU (bars 5)
showed the same profile as that of mice treated with saline solution (bars 1) or with the siRNA control-SQ NPs alone (bars 2), suggesting that combined treatments responded differently to the induction by FLU.
Discussion
In this study, we investigated the therapeutic effects of combining AR inhibition by the antiandrogen FLU, one of the reference treatment for PCa, with the TMPRSS2-ERG knockdown by siRNA. This fusion oncogene is described to disrupt AR signaling pathway, thus promoting the growth of prostate cancer cells.22 Moreover, TMPRSS2-ERG expres-sion is preserved in castration-resistant form compared to other AR target genes which are generally downregulated,11 supporting the interest in targeting the fusion oncogene as an alternative therapeutic strategy to androgen deprivation therapy or in combining both treatments. Indeed, drug asso-ciations are generally meant to diminish drug doses, thus toxicity or to counteract cancer development via multiple pathways. TMPRSS2 presents several androgen-responsive elements in its promoter, thus explaining the efficacy of the antiandrogen on downregulating the TMPRSS2-ERG expres-sion. Herein, this study intended to decrease FLU toxicity by combining this molecule at lower doses to siRNA against TMPRSS2-ERG.
Because the inhibition at the posttranscriptional level carried out by the siRNA might differ from the disruption of AR signaling by FLU in terms of kinetics, three different administration protocols were adopted to understand which
Figure 4 Combined siRNA TMPRSS2-ERG-SQ NPs with FLU inhibits tumor growth in vivo similarly to siRNA TMPRSS2-ERG-SQ NPs.
(a) SCID mice bearing VCaP tumor xenografts were injected i.v. either with saline solution (1), siRNA control-SQ NPs alone (2) or combined with FLU (3), NPs siRNA TMPRSS2-ERG-SQ alone (4) or combined with FLU (5), or FLU alone (6). Mice receiving combined treatments were injected alternatively with siRNA-SQ NPs or FLU every 48 hours and for 5 weeks as explained in the pictogram. The tumor growth of 10 tumors per condition was followed during the course of the experiment. Using Kruskal–Wallis followed by comparative Dunn’s tests, a statistical difference was observed between controls (mice treated with saline solution or siRNA control-SQ NPs) and siRNA TMPRSS2-ERG-SQ NPs alone or combined with FLU (***P < 0.001, **P < 0.01). Data are the mean ± SEM of 10 independent tumors. (b) Mice were sacrificed, and tumors were collected at the end of the experiment and ERG, AR, and cleaved caspase-3 protein expressions were analyzed by western blot. GAPDH was monitored as loading control. FLU, flutamide; NP, nanoparticles; SQ, squalene.
14
4 weeks VCaP cell
inoculation
48 hours 5 weeks
treatment Tumour growth monitoring
1 Saline solution 2 siRNA control-SQ NPs 3 siRNA control-SQ NPs + FLU 4 siRNA TMPRSS2-ERG-SQ NPs 5 siRNA TMPRSS2-ERG-SQ NPs + FLU siRNA-SQ NPs
via IV injections FLU
via IP injections 6 FLU
12 Tumoral volume (Vt/V0 ) 10 8 6 4 2 0 0 1 2 3 Weeks ERG AR Cl.casp-3 GAPDH GAPDH GAPDH
***
**
4 5 1 2 3 4 5 6a
b
one would be the most appropriate. We observed that the combination of the two molecules cannot display a more pronounced TMPRSS2-ERG inhibitory effect compared to the oligonucleotide alone whatever the treatment schedule applied. This can be explained by the fact that the siRNA TMPRSS2-ERG is already able to downregulate exten-sively TMPRSS2-ERG mRNA and its corresponding ERG protein expression without the need of inhibitory enhanc-ers such as FLU. This observation was confirmed by cell mortality studies where the combination of the two drugs did not impair the cell viability better than each molecule alone. Moreover, similar results were observed when the siRNA TMPRSS2-ERG was combined to 120 µmol/l of FLU (corresponding to the IC50, data not shown). This suggests
that the absence of synergism or additivity was not due to FLU concentration.
Since the drug metabolism in vivo might affect the out-come of the combination treatment and differs substantially from in vitro studies, the combinatorial treatment was tested in mice bearing VCaP xenografted tumors. However, to pre-serve siRNA efficacy in vivo, the oligonucleotide must be pro-tected from nuclease degradation and effectively delivered into the tumors.23 Consequently, squalenoylated siRNA NPs were formulated with this intent.14
As previously described and discussed in our latest paper,15 in vitro, the NPs siRNA TMPRSS2-ERG-SQ were unable to enter within the cells without a transfecting agent. But we already demonstrated that they are still active
Figure 5 Combined treatments mostly inhibit cytochrome P450 enzymes induction by FLU. (a) Tumors were grinded, and RNA was collected. RT-qPCR was performed, and cDNA was amplified by RT-qPCR for cytochromes P450. The threshold of 30 cycles was imposed in order to obtain reliable results from RT-PCR. Relative mRNA expressions of (b) CYP 2D6, (c) 2R1, (d) 4F8, (e) 4F12, and (f) 4F22 were recorded as fold change normalized to saline solution treated tumors. TATA Box Binding Protein (TBP) gene was used as reference gene. For statistical analysis, the nonparametric Kruskal–Wallis followed by comparative Dunn’s tests were performed using GraphPad software. *P < 0.05; **P < 0.01, ***P < 0.001. Bars represent the mean ± SD of three independent tumors and three independent replicates. FLU, flutamide; CYP, cytochrome P450.
1 Saline solution 2 siRNA control-SQ NPs 3 siRNA control-SQ NPs + FLU 4 siRNA TMPRSS2-ERG-SQ NPs 5 siRNA TMPRSS2-ERG-SQ NPs + FLU 6 FLU 1 2 3 4 5 6 500
* ***
**
*
***
*** **
*
***
*
400 300 200 30 20Relative mRNA levels
5 4 3 2 1 0
Relative mRNA levels
10 0 100 150 200 250 30 20
Relative mRNA levels 10
0
1 2 3 4 5 6 1 2 3 4 5 6
Relative mRNA levels
0 2 4 6 8 1 2 3 4 5 6
Relative mRNA levels
0 1 2 3 1 2 3 4 2D6
b
d
c
e
f
2R1 4F8 4F12 4F22 5 6a
15 20 25 Cycles threshold (Ct) 30 35 40 TBPCYP 1A1 CYP 1A2 CYP 1B1 CYP 2A6 CYP 2A7 CYP 2A13 CYP 2B6 CYP 2C8 CYP 2C9 CYP 2C18 CYP 2C19 CYP 2D6 CYP 2E1 CYP 2F1 CYP 2J2 CYP 2R1 CYP 2S1 CYP 2U1
after bio-conjugation with squalene despite the chemical modifications.14,15,24,25
In vivo, we found comparable results between siRNA TMPRSS2-ERG-SQ NPs administered alone or com-bined to FLU. In contrast, FLU alone showed similar tumor growth profile compared to control-treated mice. Hence, the TMPRSS2-ERG expression profile reflected tumor response to treatments. Regarding AR expression, its decrease by FLU was not correlated with tumor growth inhibition, and this effect was slightly counteracted when combined with siRNA TMPRSS2-ERG-SQ NPs. This result is in accordance with the role of ERG overexpression in inhibiting AR expression,
thus TMPRSS2-ERG knockdown may partially restore AR expression.26 Moreover, a slight increase in the apoptotic status of tumors via the cleavage of caspase 3 was only observable in mice treated with siRNA TMPRSS2-ERG-SQ NPs alone or combined with FLU which is in accordance with the tumor growth inhibition shown essentially by these two treatments. To understand the mechanisms underlying these observations, we studied the main drug-metabolizing systems by assessing phase 1 (CYP, EH) and phase 2 (conjugation enzymes, including several transferases) enzymes. To our knowledge, the expression of these enzymes has not been investigated so far under the treatment of squalene-based
Figure 6 Combined treatments respond differently to the induction of the main phase 2 drug-metabolizing enzymes by FLU. (a) Tumors were grinded, and RNA was collected. Reverse transcription was performed and cDNA was amplified by RT-PCR for phase 2 enzymes. The threshold of 30 cycles was imposed in order to obtain reliable results from RT- PCR. Relative mRNA expressions of (b) NAT1, (c) UGT1A1, (d) GSTπ1, and (e) GSTµ1 were recorded as fold change normalized to saline solution treated tumors. TATA Box Binding Protein (TBP) gene was used as reference gene. For statistical analysis, the nonparametric Kruskal–Wallis followed by comparative Dunn’s tests were performed using GraphPad software. *P < 0.05; **P < 0.01, ***P < 0.001. Bars represent the mean ± SD of three independent tumors and three independent replicates. FLU, flutamide; NP, nanoparticles; SQ, squalene.
1 2 3 4 5 6 1 2 3 4 5 6 1 2 3 NAT1 UGT1A1 GSTπ1 200 150 100 50 0 GSTµ1 4 5 100
***
50***
**
**
*
**
***
**
**
*
***
*
*
**
**
**
*
*
40 30Relative mRNA levels
Relative mRNA levels
20 15 10 5 0
Relative mRNA levels
20 10 0 80
60
Relative mRNA levels
40 20 0 6 1 2 3 4 5 6 15 20 25 Cycles threshold (Ct) 30 35 40 TBP GST α 1 GST µ1 GST π1 EH UGT1A1 NAT1 ST 1 Saline solution 2 siRNA control-SQ NPs 3 siRNA control-SQ NPs + FLU 4 siRNA TMPRSS2-ERG-SQ NPs 5 siRNA TMPRSS2-ERG-SQ NPs + FLU 6 FLU
a
b
d
c
e
NPs. We observed that both phase 1 and phase 2 enzymes seems not to play a key role in metabolism of NPs. On the contrary, FLU extensively modified the expression of these enzymes. Nevertheless, the induction observed for these enzymes by the antiandrogen was counteracted by its asso-ciation with squalenoylated siRNA NPs for phase 1 enzymes and with siRNA control-squalene NPs for phase 2 enzymes. This observation is in accordance with Kocarek et al.27, who observed a strong increase of CYP2B and 4A mRNA lev-els in primary cultured rat hepatocytes when treated with squalestatin 1, a potent inhibitor of squalene synthase. Thus, the inhibition of families 2 and 4 of CYP by squalene might influence the FLU activity by decreasing its metabolism rate. However, upregulation of phase 2 enzymes by FLU alone or combined with siRNA control-SQ NPs could explain the observed decrease of antitumoral activity of the correspond-ing treated groups.
In addition, CYP4F8, an enzyme involved in the synthesis of prostaglandins which are responsible for the onset of inflam-mation has been described to be overexpressed in primary prostate cancer samples and its inhibition reduced cell viabil-ity in various PCa cell lines.28 Moreover, ERG overexpression is described to inhibit the 15-hydroxy-prostaglandin dehydro-genase, an enzyme in charge of oxidation of prostaglandin into inactive keto-metabolites, thus the fusion oncogene par-ticipates to the inflammatory process of PCa.29 These findings suggest that the administration of siRNA TMPRSS2-ERG squalene-based NPs could decrease inflammation generally related to cancer development by inhibiting transcription of CYPs involved in prostaglandins synthesis and by upregulat-ing 15-hydroxy-prostaglandin dehydrogenase responsible of prostaglandins catabolism.
With regard to phase 2 enzymes, their behavior toward FLU is different when the combination occurs with the target or scrambled sequences; therefore, the role of the junction oncogene on the activities of the phase 2 enzymes should be more deeply investigated.
In conclusion, siRNA TMPRSS2-ERG-SQ NPs confirmed their strong antitumoral activity and could be considered as an alternative therapeutic approach for hormone-dependent prostate cancer. Moreover, the significance of siRNA-SQ NPs has been demonstrated in preclinical trials of thyroid and prostate cancers.14,15,24,25 Thus, further investigations should be proceeded to prove the safety of our vectors in term of toxicological test that will allow to progress into clinical tri-als. So that, the “squalenoylation” could be used as a generic platform for the administration and the transport of therapeu-tic siRNA.
Materials and methods
Chemicals. Squalene, siRNA, MTT (3-(4,5-dimethylthiazol- 2-yl)-2,5-diphenyl tetrazolium bromide) reagents were purchased from Sigma-Aldrich Chemical (Saint Quentin Fallavier, France). Single-strand siRNA was synthesized as 21-mer with two 2′-deoxynucleotide residues at the 3′-end to provide stabilization against nucleases.30 For bioconjugation to squalene, siRNA was modified at the 3′-end with a thiol group (Eurogentec, Belgium).
Dulbecco’s modified Eagle medium, Opti-MEM, fetal calf serums, Lipofectamine RNAiMAX, and PCR primers were purchased from Life Technologies (Saint Aubin, France). BD Matrigel (Basement Membrane Matrix Growth Factor Reduced - Reference 356234) was purchased from Corning (Amsterdam, the Netherlands). Bio-RAD protein assay was purchased from Bio-RAD Laboratories (Marnes-la-Coquette, France). All used chemicals were of quality grade.
Cell line and culture. Human prostate cancer VCaP cell line expressing TMPRSS2-ERG oncogene (CRL2876, ATCC, Manassas, VA) was grown in Dulbecco’s modified Eagle medium supplemented with 10% of fetal calf serums, 100 units/ml penicillin, and 100 µg/ml streptomycin (Invitrogen, Cergy-Pontoise, France). Cells were maintained at 37 °C in a humidified atmosphere containing 5% CO2. Cells were regularly analyzed to ensure absence of contaminations by mycoplasma.
Influence of DHT on fusion transcription. To determine the DHT concentration able to induce the highest TMPRSS2-ERG expression, VCaP cells (8 × 10⁵ cells/well) were seeded in a six-well plate and treated with DHT at 5, 10, and 50 nmol/l concentrations for 24 hours. The concentration able to pre-dominantly induce TMPRSS2-ERG fusion transcript was then used to incubate VCaP cells for 24, 48, and 72 hours in order to optimize the stimulation schedule. At the end of treat-ments, cells were collected, mRNA extracted, and reverse transcription-quantitative PCR (RT-qPCR) was performed to analyze TMPRSS2-ERG and TMPRSS2 genes expressions. Real-time PCR (RT-qPCR). Total RNA was extracted from VCaP cells by RNeasy mini-kit (Qiagen, Courta-boeuf, France) and first-strand cDNA was generated with M-MLV RT buffer kit (Life Technologies) as previously described.24 The following primers were used to amplify
TMPRSS2-ERG junction sequence: forward 5′-GGCAGGAA
CTCTCCTGAT-3′, reverse 5′-CGTGGCACGATAACTCTG-3′. The TMPRSS2 gene was also investigated by using spe-cific primers amplifying the region not involved within the fusion: TMPRSS2 forward 5′-AAGGGAAGACCTCAGAAG TG-3′, reverse 5′-CCAGTCCGTGAATACCATC-3′. GAPDH sequence was used as housekeeping gene: forward 5′-CC ACTCCTCCACCTTTGAC-3′, reverse 5′-ACCCTGTTGCTGT AGCCA-3′. RT-qPCR was performed using the StepOne-Plus PCR System (AB Applied Biosystems, Villebon- sur-Yvette, France) using GoTaq qPCR Master Mix (Pro-mega, Charbonnières-les-Bains, France) according to manu-facturer’s instructions. Samples were run in triplicate; gene regulation was determined by 2−ΔΔCt method and normalized to GAPDH levels. Results are given as relative mRNA levels of TMPRSS2-ERG or of TMPRSS2 compared to nontreated cells.
Determination of the inhibitory concentrations (IC50 and
IC25) of flutamide on viability of VCaP cells. The FLU dose–
response curve was assessed on VCaP cells to determine the concentration of the drug to be used in association with siRNA TMPRSS2-ERG. Cells were plated into a 96-well plate (30,000 cells/well), and simultaneously treated with DHT (10 nmol/l) for 24 hours. FLU was then added to various
micromolar concentrations (50, 100, 150, 200, and 250 µmol/l), and cells were incubated for 48 hours. The viability of VCaP cells was evaluated by MTT assay. The concentrations of FLU required to affect 25% (IC25) and 50% (IC50) of cell viability were determined by linear regression model.
Influence of flutamide on fusion transcription. VCaP cells (8 × 10⁵ cells/well) were seeded in six-well plates and stimu-lated with DHT (10 nmol/l). Twenty-four hours later, cells were stimulated with FLU (70 µmol/l) for 48 hours. At the end of the treatment, cells were harvested and total mRNA was extracted to be analyzed for TMPRSS2-ERG and TMPRSS2 expression by RT-qPCR as described above.
In vitro cell transfection. Transient transfections were per-formed to assess the most efficient drug combination pro-tocol of siRNA TMPRSS2-ERG and FLU for oncofusion knockdown. Cells were transfected with siRNA against TMPRSS2-ERG using Lipofectamine RNAiMAX transfect-ing agent and accordtransfect-ing to manufacturer’s instructions. One siRNA containing four mismatches on the sequence of the siRNA TMPRSS2-ERG was used as siRNA control.
First, VCaP cells (8 × 10⁵) were seeded in six-well plates and stimulated with DHT (10 nmol/l). Twenty-four hours later, three different administration schedules were applied: (i) cells were transfected with siRNA TMPRSS2-ERG (50 nmol/l) for 24 hours, then stimulated with FLU (70 µmol/l) for 48 hours; (ii) cells were stimulated with FLU (70 µmol/l) for 24 hours, then transfected with siRNA TMPRSS2-ERG (50 nmol/l) for 48 hours; (iii) cells were transfected with siRNA TMPRSS2-ERG (50 nmol/l) and stimulated with FLU (70 µmol/l) at the same time, then incubated for 48 hours. At the end of the treat-ments, mRNA and proteins were extracted and analyzed for gene and protein expressions.
Immunoblotting. Total protein extracts were obtained using M-PER reagent (Thermo Fisher Scientific, Courtaboeuf, France) supplemented with a protease inhibitor cocktail (Roche, Neuilly sur Seine, France) as previously described.24 Proteins were titrated by Bio-RAD Assay according to manu-facturer’s instructions. Samples were then loaded on 10% polyacrylamide gel (NuPAGE Bis Tris Mini Gels 10%, Life Technologies, Saint-Aubin, France) and proteins were trans-ferred using the iBlotDry Blotting System (Invitrogen). Mem-branes were incubated overnight at 4 °C with monoclonal rabbit anti-ERG (EPR 3864 (2); 1:500, Abcam Biochemicals, Paris, France). Monoclonal mouse GAPDH-horseradish per-oxidase (#3683; 1:1000, Cell Signaling technology, Saint Quentin en Yvelines, France) was used as internal control. Blots were then washed and, when necessary, incubated with corresponding secondary antirabbit antibodies conjugated to horseradish peroxidase (1:3,000; Cell Signaling Technology). Bands were visualized by enhanced chemiluminescence reagent (Invitrogen).
Viability assay. The MTT assay was performed to determine the most efficient drug combination protocol for cell viability impairment, as previously described.25
First, VCaP cells (3 × 10⁴) were seeded in 96-well plates and stimulated with DHT (10 nmol/l). Twenty-four hours later,
three different administration schedules were applied: (i) cells were transfected with siRNA (TMPRSS2-ERG or control at 50 nmol/l) for 24 hours, then stimulated with FLU (70 µmol/l) for 48 or 72 hours; (ii) cells were stimulated with FLU (70 µmol/l) for 24 hours, then transfected with siRNA (TMPRSS2-ERG or control at 50 nmol/l) for 48 or 72 hours; (iii) cells were transfected with siRNA (TMPRSS2-ERG or control at 50 nmol/l) and stimulated simultaneously with FLU (70 µmol/l) then incubated for 48 or 72 hours. At the end of treatments, MTT reagent (20 µl of 5 mg/ml phosphate-buffered saline) was added to each well and incubated at 37 °C for 2 hours. Results are the mean ± SD of two independent experi-ments containing eight replicates for each condition and are expressed as cell viability percentage of treated cells com-pared to nontreated cells.
Preparation of siRNA TMPRSS2-ERG-squalene NPs. In order to perform squalene bio-conjugation, a 3-mercaptopropyl phosphate group was introduced at the 3′-end of siRNA sense strand (synthesized by Eurogentec, Belgium).
The bioconjugate siRNA TMPRSS2-ERG-SQ was synthesized by Michael addition of 3′-thiol group with squalene-(ethoxy)ethyl-maleimide, and the corresponding NPs were prepared by nanoprecipitation as previously pub-lished.14 The hydrodynamic diameter (nm) was measured by laser light scattering using a Zetasizer 4 (Malvern Instrument, Orsay, France).
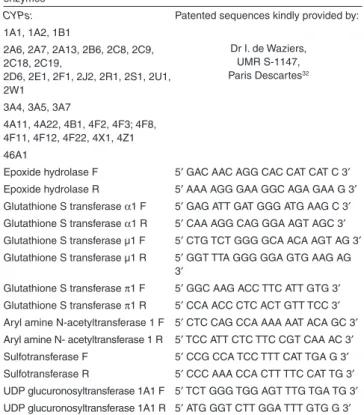
Table 1 Primers of the main phase 1 and phase 2 drug-metabolizing enzymesa
CYPs: Patented sequences kindly provided by: Dr I. de Waziers,
UMR S-1147, Paris Descartes32 1A1, 1A2, 1B1
2A6, 2A7, 2A13, 2B6, 2C8, 2C9, 2C18, 2C19,
2D6, 2E1, 2F1, 2J2, 2R1, 2S1, 2U1, 2W1
3A4, 3A5, 3A7
4A11, 4A22, 4B1, 4F2, 4F3; 4F8, 4F11, 4F12, 4F22, 4X1, 4Z1 46A1
Epoxide hydrolase F 5′ GAC AAC AGG CAC CAT CAT C 3′ Epoxide hydrolase R 5′ AAA AGG GAA GGC AGA GAA G 3′ Glutathione S transferase α1 F 5′ GAG ATT GAT GGG ATG AAG C 3′ Glutathione S transferase α1 R 5′ CAA AGG CAG GGA AGT AGC 3′ Glutathione S transferase µ1 F 5′ CTG TCT GGG GCA ACA AGT AG 3′ Glutathione S transferase µ1 R 5′ GGT TTA GGG GGA GTG AAG AG
3′
Glutathione S transferase π1 F 5′ GGC AAG ACC TTC ATT GTG 3′ Glutathione S transferase π1 R 5′ CCA ACC CTC ACT GTT TCC 3′ Aryl amine N-acetyltransferase 1 F 5′ CTC CAG CCA AAA AAT ACA GC 3′ Aryl amine N- acetyltransferase 1 R 5′ TCC ATT CTC TTC CGT CAA AC 3′ Sulfotransferase F 5′ CCG CCA TCC TTT CAT TGA G 3′ Sulfotransferase R 5′ CCC AAA CCA CTT TTC CAT TG 3′ UDP glucuronosyltransferase 1A1 F 5′ TCT GGG TGG AGT TTG TGA TG 3′ UDP glucuronosyltransferase 1A1 R 5′ ATG GGT CTT GGA TTT GTG G 3′ aNucleotide primers pairs of CYP450 families were kindly provided by Dr I. de Waziers and are available from Biopredic International (Rennes, France, http://www.biopredic.com). Primers for phase 2 enzymes of metabolism were designed and validated and sequences are listed in the table.
Animal studies. In vivo studies were permitted and accepted by the research council (Integrated Research Cancer Insti-tute in Villejuif, IRCIV), the institutional Ethics Committee of Animal Experimentation and registered in the French Ministry of Higher Education and Research. Authorization Commit-tee of Animal Experimentation IRCIV/IGR (no. 26: 94–226, no: 2011-09) was applied, and all animal studies were car-ried out in accordance with the French laws and regulations and applying the European Community directives (Directive 2010/63/UE). Animal suffering was minimized through the use of isoflurane anesthesia when treatments were admin-istered, and mice were sacrificed by CO2 inhalation before tumor collection. Five-week-old SCID/Beige mice were obtained from Harlan Laboratory. Sterilized laminar flow cag-ing system was used to house animals and food, water, and bedding were autoclaved before use. Food and water were provided ad libitum.
In vivo antitumoral activity of combined siRNA TMPRSS2-ERG-SQ NPs and flutamide. VCaP cells were
sc inoculated (107 cells/mouse in PBS (50 µl) mixed with
Matrigel (50 µl)). When tumors reached about 50 mm3, mice (n = 10 tumors/group) were treated by i.v. injection of 0.9% NaCl or squalenoylated siRNA and/or by i.p. injection of FLU. The administration schedule was carried out over 5 weeks. The following treatments were administered: (i) every 48 hours, 100 µl of NaCl 0.9%; (ii) every 96 hours squalenoylated siRNA (siRNA TMPRSS2-ERG-SQ NPs or siRNA control) NPs at the cumulative dose of 0.8 mg/kg (eight injections of 0.1 mg/kg/injection dispersed in 100 µl of 0.9% NaCl solu-tion); (iii) every 96 hours, FLU alone at cumulative dose of 11.2 mg/kg (seven injections of 1.6 mg/kg/injection dispersed in sterilized sesame oil). For combination studies, treatments were alternated beginning with siRNA TMPRSS2-ERG-SQ NPs (or siRNA control) NPs and followed 48 hours later by FLU. The combined treatments were performed at the same doses of drugs administered. Mice were monitored daily and sacrificed at the end of the experiment unless signs of ani-mal sufferance (body weight loss, abnorani-mal behavior, toxic-ity signs) were observed or, if tumors reached a volume of 1,000 mm3. After sacrifice of animals, tumors were collected and immediately frozen in liquid nitrogen for proteins and mRNA analysis.
Protein extractions from tumors. Total protein extraction using M-PER lysis buffer and western blot were performed for ERG, cleaved caspase-3 (# 9662; 1:1,000; Cell Signaling Technology) and GAPDH as described above. Knowing that FLU prevents nuclear shuttling of AR, nuclear protein extrac-tion was achieved as described by Erin et al.31, then western blot were performed using AR antibody (ab108341; 1:1,000, Abcam Biochemicals).
Tumor expression of the main drug-metabolizing enzymes systems. For the determination of phase 1 (CYP and EH] and phase 2 (GSTs, UGTA1, NAT1, EH, and ST) metabo-lizing enzymes, tumors were ground and total RNA was extracted by RNeasy minikit according to manufacturer’s instructions. RT-qPCR was performed as described above for in vitro studies. Nucleotide primer pairs of CYP450 families
were designed and kindly provided by de Waziers.32 Primers for EH and phase 2 xenobiotic metabolizing enzymes were designed, their sequences are listed in Table 1. TBP gene (coding for the TATA box-binding protein, a component of the DNA-binding protein complex TFIID) was used as endoge-nous control.33 Results are presented as relative mRNA level compared to 0.9% saline solution treatment.
Statistical analysis. All data are presented as mean ± SD. For statistical analysis, we used the nonparametric Krus-kal–Wallis followed by Dunn’s tests to identify the sources of differences among treatments by using GraphPad soft-ware. P ≤ 0.05 was considered as a statistically significant difference.
Acknowledgments The research leading to these results
has received funding from: (i) the Agence Nationale de Re-cherche (ANR), Program P2N, Grant No: NANO 0030 and (ii) a public grant overseen by the French National Research Agency (ANR) as part of the “Investissements d’Avenir” pro-gram (Labex NanoSaclay, reference: ANR-10-LABX-0035). The animal studies were performed within the animal facil-ity of the Gustave Roussy Cancer Campus, and the authors gratefully acknowledge the excellent technical support of their employees. The authors declare no conflict of interest.
1. Cuzick, J, Thorat, MA, Andriole, G, Brawley, OW, Brown, PH, Culig, Z et al. (2014). Prevention and early detection of prostate cancer. Lancet Oncol 15: e484–e492. 2. DeSantis, CE, Lin, CC, Mariotto, AB, Siegel, RL, Stein, KD, Kramer, JL et al. (2014).
Cancer treatment and survivorship statistics, 2014. CA Cancer J Clin 64: 252–271. 3. Akduman, B and Crawford, ED (2006). Treatment of localized prostate cancer. Rev Urol 8
(suppl. 2): S15–S21.
4. Huggins, C and Hodges, CV (2002). Studies on prostatic cancer: I. The effect of castration, of estrogen and of androgen injection on serum phosphatases in metastatic carcinoma of the prostate. 1941. J Urol 168: 9–12.
5. Labrie, F (1993). Mechanism of action and pure antiandrogenic properties of flutamide.
Cancer 72 (suppl. 12): 3816–3827.
6. Ricci, F, Buzzatti, G, Rubagotti, A and Boccardo, F (2014). Safety of antiandrogen therapy for treating prostate cancer. Expert Opin Drug Saf 13: 1483–1499.
7. Shafi, AA, Yen, AE and Weigel, NL (2013). Androgen receptors in hormone-dependent and castration-resistant prostate cancer. Pharmacol Ther 140: 223–238.
8. Tomlins, SA, Rhodes, DR, Perner, S, Dhanasekaran, SM, Mehra, R, Sun, XW et al. (2005). Recurrent fusion of TMPRSS2 and ETS transcription factor genes in prostate cancer.
Science 310: 644–648.
9. Attard, G, Swennenhuis, JF, Olmos, D, Reid, AH, Vickers, E, A’Hern, R et al. (2009). Characterization of ERG, AR and PTEN gene status in circulating tumor cells from patients with castration-resistant prostate cancer. Cancer Res 69: 2912–2918. 10. Mehra, R, Tomlins, SA, Yu, J, Cao, X, Wang, L, Menon, A et al. (2008). Characterization of
TMPRSS2-ETS gene aberrations in androgen-independent metastatic prostate cancer.
Cancer Res 68: 3584–3590.
11. Cai, C, Wang, H, Xu, Y, Chen, S and Balk, SP (2009). Reactivation of androgen receptor-regulated TMPRSS2:ERG gene expression in castration-resistant prostate cancer. Cancer
Res 69: 6027–6032.
12. Christensen, J, Litherland, K, Faller, T, van de Kerkhof, E, Natt, F, Hunziker, J et al. (2013). Metabolism studies of unformulated internally [3H]-labeled short interfering RNAs in mice.
Drug Metab Dispos 41: 1211–1219.
13. Morrissey, DV, Lockridge, JA, Shaw, L, Blanchard, K, Jensen, K, Breen, W et al. (2005). Potent and persistent in vivo anti-HBV activity of chemically modified siRNAs.
Nat Biotechnol 23: 1002–1007.
14. Raouane, M, Desmaele, D, Gilbert-Sirieix, M, Gueutin, C, Zouhiri, F, Bourgaux, C et al. (2011). Synthesis, characterization, and in vivo delivery of siRNA-squalene nanoparticles targeting fusion oncogene in papillary thyroid carcinoma. J Med Chem 54: 4067–4076. 15. Urbinati, G, Ali, HM, Rousseau, Q, Chapuis, H, Desmaële, D, Couvreur, P et al. (2015).
Antineoplastic effects of siRNA against TMPRSS2-ERG junction oncogene in prostate cancer. PLoS One 10: e0125277.
16. Lin, YL, Yuksel Durmaz, Y, Nör, JE and ElSayed, ME (2013). Synergistic combination of small molecule inhibitor and RNA interference against antiapoptotic Bcl-2 protein in head and neck cancer cells. Mol Pharm 10: 2730–2738.
17. Rytelewski, M, Ferguson, PJ, Maleki Vareki, S, Figueredo, R, Vincent, M and Koropatnick, J (2013). Inhibition of BRCA2 and thymidylate synthase creates multidrug
sensitive tumor cells via the induction of combined “complementary lethality”. Mol Ther
Nucleic Acids 2: e78.
18. Shet, MS, McPhaul, M, Fisher, CW, Stallings, NR and Estabrook, RW (1997). Metabolism of the antiandrogenic drug (Flutamide) by human CYP1A2. Drug Metab Dispos 25: 1298–1303.
19. Cai, J, Kandagatla, P, Singareddy, R, Kropinski, A, Sheng, S, Cher, ML et al. (2010). Androgens induce functional CXCR4 through ERG factor expression in TMPRSS2-ERG fusion-positive prostate cancer cells. Transl Oncol 3: 195–203.
20. Wang, Q, Carroll, JS and Brown, M (2005). Spatial and temporal recruitment of androgen receptor and its coactivators involves chromosomal looping and polymerase tracking.
Mol Cell 19: 631–642.
21. Wang, Q, Li, W, Liu, XS, Carroll, JS, Jänne, OA, Keeton, EK et al. (2007). A hierarchical network of transcription factors governs androgen receptor-dependent prostate cancer growth. Mol Cell 27: 380–392.
22. Yu, J, Yu, J, Mani, RS, Cao, Q, Brenner, CJ, Cao, X et al. (2010). An integrated network of androgen receptor, polycomb, and TMPRSS2-ERG gene fusions in prostate cancer progression. Cancer Cell 17: 443–454.
23. Ali, HM, Urbinati, G, Raouane, M and Massaad-Massade, L (2012). Significance and applications of nanoparticles in siRNA delivery for cancer therapy. Expert Rev Clin
Pharmacol 5: 403–412.
24. Ali, HM, Maksimenko, A, Urbinati, G, Chapuis, H, Raouane, M, Desmaële, D et al. (2014). Effects of silencing the RET/PTC1 oncogene in papillary thyroid carcinoma by siRNA-squalene nanoparticles with and without fusogenic companion GALA-cholesterol. Thyroid 24: 327–338.
25. Ali, HM, Urbinati, G, Chapuis, H, Desmaele, D, Bertrand, JR, Couvreur, P et al. (2014). Effects of siRNA on RET/PTC3 junction oncogene in papillary thyroid carcinoma: from molecular and cellular studies to preclinical investigations. PLoS One 9: e95964. 26. Chen, Y and Sawyers, CL (2010). Coordinate transcriptional regulation by ERG and
androgen receptor in fusion-positive prostate cancers. Cancer Cell 17: 415–416. 27. Kocarek, TA, Kraniak, JM and Reddy, AB (1998). Regulation of rat hepatic cytochrome
P450 expression by sterol biosynthesis inhibition: inhibitors of squalene synthase are
potent inducers of CYP2B expression in primary cultured rat hepatocytes and rat liver.
Mol Pharmacol 54: 474–484.
28. Vainio, P, Gupta, S, Ketola, K, Mirtti, T, Mpindi, JP, Kohonen, P et al. (2011). Arachidonic acid pathway members PLA2G7, HPGD, EPHX2, and CYP4F8 identified as putative novel therapeutic targets in prostate cancer. Am J Pathol 178: 525–536.
29. Mohamed, AA, Tan, SH, Sun, C, Shaheduzzaman, S, Hu, Y, Petrovics, G et al. (2011). ERG oncogene modulates prostaglandin signaling in prostate cancer cells. Cancer Biol
Ther 11: 410–417.
30. Tuschl, T (2002). Expanding small RNA interference. Nat Biotechnol 20: 446–448. 31. Erin, N, Bronson, SK and Billingsley, ML (2003). Calcium-dependent interaction of
calcineurin with Bcl-2 in neuronal tissue. Neuroscience 117: 541–555. 32. Girault, I, Rougier, N, Chesné, C, Lidereau, R, Beaune, P, Bieche, I et al. (2005).
Simultaneous measurement of 23 isoforms from the human cytochrome P450 families 1 to 3 by quantitative reverse transcriptase-polymerase chain reaction. Drug Metab Dispos 33: 1803–1810.
33. Girault, I, Lerebours, F, Tozlu, S, Spyratos, F, Tubiana-Hulin, M, Lidereau, R et al. (2002). Real-time reverse transcription PCR assay of CYP19 expression: application to a well-defined series of post-menopausal breast carcinomas. J Steroid Biochem Mol Biol 82: 323–332.
This work is licensed under a Creative Commons Attribution-NonCommercial-NoDerivs 4.0 International License. The images or other third party material in this article are included in the article’s Creative Commons license, unless indicated otherwise in the credit line; if the material is not included under the Creative Commons license, users will need to obtain permission from the license holder to reproduce the material. To view a copy of this license, visit http://creativecommons.org/licenses/by-nc-nd/4.0/