HAL Id: hal-00296442
https://hal.archives-ouvertes.fr/hal-00296442
Submitted on 13 Feb 2008
HAL is a multi-disciplinary open access
archive for the deposit and dissemination of
sci-entific research documents, whether they are
pub-lished or not. The documents may come from
teaching and research institutions in France or
abroad, or from public or private research centers.
L’archive ouverte pluridisciplinaire HAL, est
destinée au dépôt et à la diffusion de documents
scientifiques de niveau recherche, publiés ou non,
émanant des établissements d’enseignement et de
recherche français ou étrangers, des laboratoires
publics ou privés.
during the July 2006 heat wave ? observations and
GEM-AQ model simulations
J. Struzewska, J. W. Kaminski
To cite this version:
J. Struzewska, J. W. Kaminski. Formation and transport of photooxidants over Europe during the
July 2006 heat wave ? observations and GEM-AQ model simulations. Atmospheric Chemistry and
Physics, European Geosciences Union, 2008, 8 (3), pp.721-736. �hal-00296442�
www.atmos-chem-phys.net/8/721/2008/ © Author(s) 2008. This work is licensed under a Creative Commons License.
Chemistry
and Physics
Formation and transport of photooxidants over Europe during the
July 2006 heat wave – observations and GEM-AQ model simulations
J. Struzewska1and J. W. Kaminski2
1Faculty of Environmental Engineering, Warsaw University of Technology, Warsaw, Poland
2Atmospheric Modelling and Data Assimilation Laboratory, Centre for Research in Earth and Space Science, York
University, Toronto, Canada
Received: 30 May 2007 – Published in Atmos. Chem. Phys. Discuss.: 19 July 2007 Revised: 30 October 2007 – Accepted: 12 January 2008 – Published: 13 February 2008
Abstract. The European heat wave of July 2006 was caused by advection of very hot and dry air from North Africa. Air masses were transported on the western edge of the high pressure system, centred over Eastern Europe, resulting in exceptionally high air temperatures over large areas of the continent. In the first two weeks of July 2006 a severe heat wave affected Central and North-Eastern Europe. We present a synoptic analysis of the July 2006 European heat wave, re-sulting formation and transport of photooxidants over Europe as simulated by the on-line tropospheric chemistry model GEM-AQ. The model was executed on a global variable grid with ∼15 km resolution over the entire European continent. Modelling results have been compared with surface observa-tions and vertical soundings of meteorological and air qual-ity parameters. We find that the calculated error measures, as well as analysis of time series and trends for selected quantities, indicate good model performance over the simu-lation period. The spatial pattern of two exposure indicators – SOMO35 and AOT40 – showed similarities with the high temperatures distribution. The zone of highest exposure was located over Central Europe along the advection path of the hot African air mass. The exposure to high ozone concen-trations in higher latitudes was reduced by the dilution and aging of polluted air masses advected from over Central Eu-rope.
1 Introduction
During the last 60 years, several exceptionally hot summer periods have been observed. For example, the averaged
max-imum temperature in 1947 was ∼5◦C above the long term
Correspondence to: J. Struzewska
(joanna.struzewska@is.pw.edu.pl)
average value. Positive temperature anomalies of over 2◦C have been recorded during the summer months of 1976, 1983 and 1994 (Beniston and Diaz, 2004). In 2003 the mean June– July–August temperature exceeded the 1961–1990 mean by 3◦C over a large area (Sch¨ar et al., 2004; DWD, 2003). For Central Europe, the frequency of heat wave occurrence has been investigated using temperature records for the period 1982–2000. Seventeen consecutive periods of at least 3 days, during which the daily maximum temperature was higher than 30◦C, were detected between the beginning of June and the end of August (Kysely, 2004). According to the analysis undertaken in the frame of IPCC, in Central Europe eight of the ten warmest years in the 1851–2004 period have been ob-served from 1989 to 2003 (IPCC, 2001; Jones and Moberg, 2003). Analysis by Scherrer et al. (2005) confirmed the in-creasing variability of the temperature, found in particular for the June–July–August season in 1975–2004. A recent climate modelling study showed that European summer sur-face temperature variability might further increase within the current century (Sch¨ar et al., 2004).
Prolonged periods characterised by exceptionally high air temperature have several adverse environmental impacts
which can affect human health. Analyses in European
cities show that total mortality rises with the temperature in-crease in the summer, especially during heat wave episodes (McMichael and Kovats, 1998; Rooney et al., 1998; Kat-souyanni et al., 1988, 1993; Kunst et al., 1993; Jendritzky et al., 1997). Such periods, often associated with strong, blocking high pressure systems, are also favourable for
gen-eration of photochemical episodes. Higher temperatures
and irradiance result in enhanced biogenic VOC emission and more intensive photochemical processes which increase ozone formation. Ozone is considered to be one of the most important environmental health problems in Europe. High
photochemical pollutants concentration, interacting with ex-treme air temperature, may have harmful health effects and damage crops, and forests (Filleul et al., 2006; Katsouyanni et al., 1993). The increasing frequency and intensity of heat waves over Europe is believed to present evidence of cli-mate change and global warming. Comparatively small shifts in the seasonal mean temperature may imply pronounced changes at the tails of the statistical distribution which repre-sents extreme events (Sch¨ar et al., 2004).
Two recent heat wave periods are extensively documented in the literature, with respect to the impact on photochemical pollution: July–August 1994 and August 2003. A synthesis of these two events in the synoptic context are provided in the following subsections.
1.1 Heat wave July–August 1994
The heat wave period in July–August 1994 lasted 17 days. The meteorological situation was governed by the high pres-sure system, initially centred over the Baltic Sea. In the next few days the high pressure ridge extended towards the North Sea and the British Isles. Based on synoptic maps, very high temperatures were recorded over Southern Europe. In West-ern Europe the advection of the hot air masses formed over Sahara caused a significant temperature increase in many lo-cations. After 23 July the heat wave also affected Central Europe.
During this period a prolonged summer smog episode oc-curred over Central and Western Europe. The hourly ozone concentrations exceeded 100 ppbv over large areas. At the beginning of the episode (21 July–23 July), an ozone-rich air mass was transported with the prevailing easterly wind from the main emission regions of ozone precursors along the western and northern coasts of France and Spain, towards the North Atlantic. In the next few days, the ozone concen-tration increased further, and the polluted air mass was trans-ported towards the North Sea (24–26 July) and to Scandi-navia (27 July–30 July) (Memmesheimer et al., 1999; Lang-mann, 2000). The analysis of increased mortality during the period from 27 June to 7 August 1994 in Belgium confirmed that the number of premature deaths was associated with un-usually high outdoor temperatures and elevated ozone levels (Sartor et al., 1995).
1.2 Heat wave August 2003
In the summer of 2003, the highest temperatures were recorded in Western Europe during the first half of August (WHO, 2004). This event was associated with a very robust and persistent high pressure system over Europe that blocked the flow of a rain-bearing low-pressure system at 700 mb and 500 mb (Lyamani et al., 2006). Some weather services sug-gested that this phenomenon might be a manifestation of an exceptional northward extension of the Hadley cell (Beniston and Diaz, 2004). Such synoptic conditions remained almost
unchanged for the whole first half of August. Exceptionally high temperatures (often near 40◦C) and the stagnation of air
masses over areas of high emissions caused a long-lasting, severe photochemical episode (Vautard et al., 2005). Very high ozone concentrations occurred mainly in the first half of August. The spatial distribution of exceedances of the infor-mation threshold (180 µg m−3) (Directive 2002/3/EC, 2002) observed in summer 2003 was much more extensive than in previous periods. The averaged daily 8-h ozone concen-tration for the period June–August 2003 was 87 µg m−3, as compared to 71 µg m−3in 2002 and 61 µg m−3in 2000 (Fiala et al., 2003). In addition to enhanced photochemical pollu-tion, Southern Europe also suffered from high concentrations of carbon monoxide and biomass burning particle aerosols emitted from wild fires in the Iberian Peninsula and mineral dust transported from the Sahara (Tressol et al., 2006; Lya-mani et al., 2006).
High temperatures and poor air quality resulted in in-creased mortality in many European countries. 400–500 of the estimated 1000–1400 premature deaths in the summer pe-riod in the Netherlands occurred during the 31 July–13 Au-gust heat wave (Fisher et al., 2004). In the United Kingdom, an increase of about 2000 deaths during the same period was reported (Stedman, 2004). Mortality of an additional 28 000 people was estimated for the southern part of Europe (Por-tugal, Balkans, Italy). In France about 15 000 excess deaths were recorded, especially at the end of the episode (H´emon and Jougla, 2003).
2 European heat wave of July 2006
In the summer of 2006 an exceptionally hot weather period began in mid June. Western European countries experienced two heat waves, one from the end of June to the beginning of July, followed by a longer and more severe one from mid-July to the beginning of August. The highest temperatures during the period were recorded on 19 July in many loca-tions. It has been confirmed by the weather services that in most European countries, July 2006 was the warmest month since official measurement started. During this period, heat related deaths were reported in France, Italy, Spain, Ger-many, the Netherlands and the United Kingdom. In addi-tion to the impact on human health, abnormally high tem-peratures and very low rainfall destroyed many crops and caused droughts in most of Europe. Cuts in power supply oc-curred due to increased electricity usage by air conditioners and problems with power plants’ cooling systems caused by rising river temperatures. In addition, ozone pollution was also very high, especially during days with extremely high air temperature and low wind speed.
South-Western Europe quite frequently experiences the in-flow of sub-tropical air masses which can be advected to-wards Western Europe. The air temperature increase is en-hanced if such situations are accompanied by a high pressure
ridge or high pressure belt extending over Europe (as oc-curred during 1994 and 2003 heat waves). Further advection of hot air masses towards Central Europe can be blocked by a stable high pressure system and limited to situations in which the evolution of a pressure field allows for westerly or south-westerly circulation.
During the 1994 heat wave, the hottest period over Central Europe was associated with the advection of hot air masses from over south-western Europe. In summer 2003, high pres-sure over Central Europe as well as south-eastern anticy-clonic circulation resulted in relatively weak advection, and high temperature affected mainly Western Europe.
The origin of the heat wave that influenced Central and North-Eastern Europe in July 2006 was different from cases described in previous sections. The specific location of pres-sure patterns allowed for an enhanced meridional circulation, resulting in high temperatures over this region. The synoptic situation is presented in Sect. 2.1.
At the beginning of July, Western Europe was influenced by the cold front with extreme events that ended the first heat wave period over this area. At the same time, Central Eu-rope experienced very high temperatures, accompanied by high ozone concentrations. The location of pressure sys-tems over the continent and the circulation patterns forced the transport of hot and dry air mass from over Algeria towards Central and North-Eastern Europe (Poland, Lithuania, Swe-den). Prolonged hot weather may have particularly adverse impacts in this region because temperatures exceeding 30◦C have been a rare phenomenon. In contrast to Southern Euro-pean countries, there are no air conditioning systems in many offices, public transportation, private houses and cars. Work-ing hours are also not adjusted to limit activity, and hence reduce exposure during noon hours. In this paper we will investigate the origin of the Central-Eastern European heat wave during the first two weeks of July and the impact of the exceptionally high temperature on the photochemical pollu-tion over this area. The analysis will focus on the period from 3 July to 14 July.
2.1 Synoptic situation – 3–14 July 2006
Analysis of the synoptic situation is based on the surface weather maps and daily weather reports. In the beginning of the analysed period, the heat wave affected mainly West-ern Europe. Cyclonic circulation over this region forced the transport of air masses from over North Africa. On 3 July the highest temperatures were recorded in France, but hot air was also advected towards the British Isles; the temperature in London exceeded 32◦C. Over Central and Eastern Europe the circulation was governed by a robust and extended high pressure system centred over Ukraine. Warm air flowing on the western edge of the high pressure cell turned to the south over Scandinavia, towards the Baltic Sea and Central Euro-pean countries. On 4 July these air masses reached Central Europe, causing the significant temperature increases that
were observed in most measurement sites in Poland. Large scale subsidence resulted in decreased relative humidity and limited cloud formation. The clear sky conditions strength-ened the heat wave effect. On 5 July, due to the slow eastward movement of a high pressure system, the winds over Central Europe changed direction from north-easterly to southerly. Very high temperatures, exceeding 30◦C, were recorded over Poland during the day, and temperatures remained relatively high overnight.
Starting on 6 July a high pressure ridge was established over Eastern Europe, and together with the low pressure system over North Africa allowed for the transport of sub-tropical, continental air masses towards Central and North-Eastern Europe. The advection of hot air from over Alge-ria sustained the high temperatures over Poland, Lithuania, Latvia and Sweden. Due to almost clear sky conditions, heat radiating from the land surface enhanced the temperature in-crease. Meanwhile, over Western Europe, a cold front as-sociated with a low pressure trough started to influence the weather conditions. The inflow of humid and relatively cool Atlantic air masses over the hot land surface generated atmo-spheric instability. The thermal contrast between western and Central-Eastern Europe resulted in several extreme events. Severe gales and thunderstorms affected France, Switzerland and Germany. However, in Central Europe, due to very slow movement of the trough, blocked by the high pressure ridge as well as low specific humidity, the passage of the front did not result in a decrease in temperature. Cooler air flowing from the north was heated due to adiabatic descent and the sensible heat transfer near the hot surface. This situation re-mained almost unchanged during the following days.
After 12 July the cold front dissipated and hot African air again started to influence Western Europe. Very high temper-atures were recorded in France, Spain, Portugal and Northern Italy. Eastern and South-Eastern Europe were under the in-fluence of hot continental air from over Western Asia.
2.2 Ozone pollution – 3–14 July 2006
The description of the pollution episode is based on the available observations and EAA (European Environmen-tal Agency) reports (http://www.eea.europa.eu/maps/ozone/ map). On 3 July and 4 high ozone concentrations occurred mainly in urban and suburban areas in Western Europe. Dur-ing the next few days the passage of the cold front and the inflow of clean Atlantic air mass resulted in the decrease of ozone concentration over France (after 5 July) and over the UK (after 6 July). The near-surface eastward advection of the ozone-rich air, combined with the local production, resulted in the extended episode over Belgium, the Netherlands and Germany. High ozone concentrations transported northward over the North Sea and the Baltic Sea caused the elevated ozone concentration levels in Denmark, and the coastal sites in Sweden and Baltic countries. The low pressure trough pushed polluted air masses toward Central Europe. At the
Fig. 1. Global variable resolution model domain (every 10th grid
line is plotted).
same time, the flow of hot African air across Europe, and clear sky conditions associated with the high pressure ridge enhanced the local ozone production. The combination of these processes led to the occurrence of the elevated ozone concentration over large areas – extending from Southern to North-Eastern Europe during the following days. After 12 July high ozone concentrations were observed again in west-ern and south-westwest-ern parts of Europe.
The daily maximum 8-h average ozone concentrations
exceeded the threshold value over most of Europe. The
area exposed to the 8-h ozone running average higher than 120 µg m−3, covering initially Western Europe (France and Germany) extended eastward and northward (towards Baltic countries, southern Finland and Russia). The highest expo-sures occurred over Central Europe.
3 Modelling approach
An on-line tropospheric chemistry model, GEM-AQ
(Kaminski et al., 2007), was used to simulate the meteorolog-ical conditions and photochemmeteorolog-ical processes. The integrated model provides a consistent framework between the meteo-rological and air quality aspects of the atmospheric system, thus simplifying the use of the model as well as improving the accuracy of the predictions. The host meteorological model used in this study is the Global Environmental Multi-scale (GEM) model developed by the Meteorological Service of Canada for operational weather prediction (Cˆot´e et al., 1998). GEM can be configured to simulate atmospheric
pro-cesses over a broad range of scales, from the global scale down to the meso-gamma scale.
Air quality modules are implemented on-line in the host meteorological model. In this version of GEM-AQ, there are 36 advected and 14 non-advected gas phase species in the model. Transport of the chemically active tracers by the resolved circulation is calculated using the semi-Lagrangian advection scheme native to GEM. The vertical transfer of trace species due to subgrid-scale turbulence is parameter-ized using eddy diffusion calculated by GEM. The gas-phase chemistry mechanism used in this version of GEM-AQ com-prises 50 species, 120 chemical reactions and 16 photoly-sis reactions representing air quality and free tropospheric chemistry. Time evolution of all specie is solved using a mass-conserving implicit time stepping discretization, with the solution obtained using Newton’s method.
For the simulations carried out in the current study the model was configured with 28 hybrid vertical levels with model top at 10 hPa. Physical parameterizations employed in the model follow those presented by Mailhot et al. (2006). The horizontal model grid was configured as a global vari-able resolution with a total of 565 by 480 grid points. The model grid, position of the computational equator, and the core section of the grid is shown in Fig. 1. The core section of the grid has 400 by 350 grid points and a uniform resolution of 0.1375 degrees (∼15 km). The model time step was set to 450 s for dynamics, physics and air quality processes. Me-teorological initial conditions were taken form the Canadian Meteorological Centre global assimilation system (Gauthier et al., 2007; Laroche et al., 2007). The GEM-AQ model was run in 24 h forecast segments starting from 6-h trial fields generated in a separate GEM execution. This setup resulted in meteorological fields being forced to observations once a day. Chemical initial conditions were generated by GEM-AQ run in a global uniform configuration (1.5◦×1.5◦) (Kaminski et al., 2007).
The standard emission dataset used for global simulations was compiled using EDGAR2.0 (Olivier et al., 1996). For the current case study the EMEP emission data over Eu-rope valid for the year 2003 have been used. The NMVOC flux was disaggregated to create the information on hydro-carbon groups specific for the GEM-AQ chemical
mecha-nism. Emission fields were regridded from polar
stereo-graphic EMEP grid to uniform resolution of the core part of the model grid. The mass flux conservation was ensured af-ter regridding. Although this method conserves the total flux, it leads to a reduced amplitude and horizontal spread of the emissions field that could result in changes of ozone produc-tion (Liu et al., 1987). In addiproduc-tion, emissions were distributed within the four lowest model layers, according to vertical profiles used in CityDelta Project (http://aqm.jrc.it/citydelta). EMEP emissions were merged with industrial EDGAR2.0 emissions, and the EMEP temporal variability profile was ap-plied based on the local time in each grid cell. Biogenic cli-matological emissions for July were derived from the GEIA
Fig. 2. Monitoring stations used for analysis.
inventory (monthly means). To obtain more realistic bio-genic fluxes the diurnal variation profile was applied with the temperature-based empirical adjustment. We note that there are large uncertainties associated with biogenic emis-sion rates (Simpson et al., 1995, 1999). Also, observations made by Lee et al. (2006), in the UK, suggest that during the 2003 heat wave biogenic isoprene emissions were increased significantly as compared to non-heat wave periods and the total VOC reactivity was doubled, resulting in higher ozone production. In our case such an evaluation of biogenic VOC emission fluxes was not possible due to the unavailability of hydrocarbon measurements in Central Europe.
4 Model results and analysis
GEM-AQ model results were compared with measurements of meteorological and air quality parameters. The spatial dis-tribution of measurement sites is shown in Fig. 2. Consider-ing the model resolution (∼15 km), only rural-background stations have been selected for the comparisons. Four sta-tions from the AirParif network (France) and five stasta-tions located in England represent the variability of atmospheric pollution in Western Europe, where the passage of the cold front ended the heat wave and the ozone episode. Measure-ments from 14 monitoring stations in Poland and 2 stations in Lithuania allow for comprehensive analysis of air quality over Central Europe, where high ozone concentration per-sisted during the whole simulation period.
Statistical analysis of the model performance has been
un-dertaken for ozone, NO2 and temperature. The correlation
coefficient and three types of accuracy measures – MBE (mean bias error), MAGE (mean absolute gross error) and RMSE (root mean square error) were calculated for each sta-tion.
Table 1. Error statistics for surface ozone.
Station Correlation MBE MAGE RMSE Name Coefficient Bois Herpin 0.73 4.26 24.35 29.22 Est Saints 0.69 9.01 26.17 31.41 Purnay le templ 0.75 16.47 24.23 28.74 Ramboulliet 0.73 −2.08 20.87 28.56 Harwell 0.63 −0.73 23.48 31.70 Lullington Heat 0.50 −10.79 25.88 37.01 Rochester 0.70 0.62 19.79 27.42 St Osyth 0.70 −4.59 20.31 27.83 Wicken Fen 0.61 −4.45 23.07 31.75 Preila 0.59 −1.14 18.93 26.68 Rugsteliskes 0.68 7.42 19.11 26.05 Belsk 0.71 −4.75 18.64 24.41 Jeleniow 0.76 −4.56 19.46 24.24 Kampinos 0.73 9.32 22.34 28.45 Kedzierzyn Kozle 0.75 27.73 32.02 42.58 Krzyzowka 0.77 2.39 18.28 25.58 Legionowo 0.77 4.33 22.84 28.52 Mscigniew 0.80 −3.33 14.85 19.77 Smolary Bytnickie 0.71 −1.95 18.40 24.15 Szymbark 0.78 14.21 18.54 24.02 Tuchola 0.80 −8.28 21.57 27.51 Widuchowa 0.71 −13.07 21.63 27.28 Zloty Potok 0.78 −1.71 17.37 23.32 4.1 Surface ozone
The error values and the correlation coefficient between mod-elled and measured ozone concentrations are given in Ta-ble 1.
For most of the stations, the correlation coefficient is in a range 0.7–0.8, which indicates good agreement of measured and modelled values with respect to diurnal ozone variation and changes in the trend. Less satisfactory correlation for sites in England is a consequence of the lack of spin up pe-riod. The simulation started on 3 July, and the model was not able to reproduce the episode in Western Europe for that day. MBE values showed that the model did not have a system-atic bias. For most of the stations the error values are below
±5 µg m−3. The very high MBE value for Kedzierzyn-Kozle
station (27.73 µg m−3) is a result of insufficient emission in-ventory resolution; the impact of the emission from a nearby power plant was not captured by the model.
MAGE for all stations is about 21±4 µg m−3. The analysis
of time series revealed that the largest discrepancies between modelled and measure values occurred during the night. The night time ozone overestimation is a well known problem in air quality modelling. The thickness of the bottom GEM-AQ model layer is ∼35 m. During the daytime, due to developed mixing processes, the concentrations calculated for this layer are representative of the air quality measurements taken near the surface. However, during the night, due to the complex
0 50 100 150 200
03/Jul 04/Jul 05/Jul 06/Jul 07/Jul 08/Jul 09/Jul 10/Jul 11/Jul 12/Jul 13/Jul 14/Jul 15/Jul
Ozone ( µ g/m 3 ) Time (Days) observed modelled
Fig. 3. Observed and modelled ozone time series at Rochester; 3–14 July, hourly values.
structure of the non-stationary stable surface layer, the mod-elled concentrations might be overestimated. The most prob-able reasons are: too intensive vertical mixing resulting in the mass exchange with the layer above, underestimated de-position flux and/or overestimated temperature.
The time series of the ozone concentrations have been analysed for all monitoring sites and compared with the model results. No constant pattern of bias has emerged. The observed temporal variability of ozone concentrations in the UK, France and Central Europe differs mainly due to dif-ferent dynamical forcings described in Sect. 2.1. The four stations with representative observed variability patterns and low MBE were selected to illustrate these differences. In the UK, high ozone concentrations were measured on 3 and 4 July and decreased significantly due to the inflow of clean Atlantic air masses over the following days. Low ozone con-centrations were recorded till the end of the analysed period (Fig. 3).
At the AirParif stations very high ozone values persisted till 4 July. After 5 July, due to frontal activity, a decrease in ozone concentrations was noted. However, after 12 July the ozone concentrations again reached high levels (Fig. 4).
The pattern observed in Central European stations is not as consistent as described for Western Europe. Due to the very slow movement of the frontal zone, the western part of Poland was influence by the trough, while the north-eastern part was influenced by the high ridge. In most stations in Poland, a rapid increase in ozone concentrations was noted
till 8 July. During the following days, on some stations
the ozone levels did not change until 12 July and decreased slightly at the end of the analysed period (Fig. 5). Other sta-tions showed a slight decrease around the 9 and 10 of July and then further increased (Fig. 6). On 14 July ozone values decreased at all stations.
0 50 100 150 200
03/Jul 04/Jul 05/Jul 06/Jul 07/Jul 08/Jul 09/Jul 10/Jul 11/Jul 12/Jul 13/Jul 14/Jul 15/Jul
Ozone ( µ g/m 3 ) Time (Days) observed modelled
Fig. 4. Observed and modelled ozone time series at Ramboulliet;
3–14 July, hourly values.
The comparison presented above confirms good agree-ment of modelled ozone concentrations with observations. Due to the lack of spin up period, there are differences in ozone concentrations at the model start time. In Western Eu-rope initial conditions that were too low resulted in the under-estimation of modelled ozone concentrations during the first two days, as confirmed by the levels observed in France and England. However, the decrease connected with the frontal passage and further increase in France associated with the second heat wave were reproduced correctly. In Central Eu-rope, for most stations the model reproduced correctly the variation of ozone concentrations. However, for some sta-tions the model underestimated daylight ozone concentra-tions on 12 and 13 July. The plausible reason for these dis-crepancies is probably connected with over-predicted mod-elled cloudiness, which will be discussed in Sect. 4.2.
The ability of the model to reproduce maximum ozone concentration was also investigated. Figure 7 shows the scat-ter plot of the observed and modelled daily maximum values for each day and each station. In general the model repro-duced daily maximum with good accuracy, especially in the
range of 100–150 µg m−3for Central European stations. A
small tendency to underestimate higher values at some sta-tions has already been mentioned. Stasta-tions in Western Eu-rope show larger variance, because in this area ozone concen-trations are strongly influenced by dynamical factors. Larger discrepancies might also be explained by inadequate initial conditions for Western Europe. However, in most cases the relative difference between modelled and measured maxi-mum concentrations does not exceed 20%.
0 50 100 150 200
03/Jul 04/Jul 05/Jul 06/Jul 07/Jul 08/Jul 09/Jul 10/Jul 11/Jul 12/Jul 13/Jul 14/Jul 15/Jul
Ozone ( µ g/m 3 ) Time (Days) observed modelled
Fig. 5. Observed and modelled ozone time series at Mscigniew; 3–14 July, hourly values.
0 50 100 150 200
03/Jul 04/Jul 05/Jul 06/Jul 07/Jul 08/Jul 09/Jul 10/Jul 11/Jul 12/Jul 13/Jul 14/Jul 15/Jul
Ozone ( µ g/m 3 ) Time (Days) observed modelled
Fig. 6. Observed and modelled ozone time series at Zloty Potok;
3–14 July, hourly values.
4.2 Temperature and NO2
For better understanding of the observed and modelled vari-ability of ozone concentrations, additional analysis was un-dertaken for the near-surface air temperature and NO2 con-centrations. These two parameters control to a large extent ozone production efficiency. The temperature and NO2 mea-surements were taken in the same locations as for ozone. Temperature records were available from 7 stations (only
from Poland) and NO2 measurements from 17 sites. The
accuracy measures computed for the temperature show very good agreement between modelled and measured values. A
0 50 100 150 200 250 0 50 100 150 200 250 modelled maximum O 3 (ug/m 3 )
observed maximum O3 (ug/m3)
Fig. 7. Scatter plot of observed and modelled ozone maximum concentrations (red – Central Europe; blue – Western Europe).
Table 2. Error statistics for air temperature.
Station Correlation MBE MAGE RMSE
Name Coefficient Czerniawa 0.84 1.57 2.30 2.76 Jeleniow 0.93 −1.18 1.93 2.36 Kedzierzyn Kozle 0.95 1.81 2.24 2.72 Krzyzowka 0.92 1.99 2.36 3.02 Mscigniew 0.95 0.86 1.26 1.70 Smolary Bytnickie 0.95 1.92 2.18 2.98 Widuchowa 0.95 0.12 1.56 1.92
high correlation coefficient (∼0.94) indicates that the model performed well with respect to the diurnal cycle. Due to rel-atively small discrepancies the bias error and gross error are low. Positive values of MBE are mainly due to night time overestimation; MAGE (on average ∼2◦C) are only slightly higher than MBE (Table 2).
The analysis of time series and trend variability confirms the agreement between observed and modelled shelter-level temperature (Fig. 8). The night time minimum tempera-ture is overestimated at most stations, especially for clear-sky nights. The sharp temperature gradients in the surface layer, caused by cooling effects, are not reproduced by the model due to insufficient vertical grid resolution. Maximum temperature is predicted correctly with respect to the time of occurrence. During the second week of the episode (9–12
12 14 16 18 20 22 24 26 28 30 32 34
03/Jul 04/Jul 05/Jul 06/Jul 07/Jul 08/Jul 09/Jul 10/Jul 11/Jul 12/Jul 13/Jul 14/Jul 15/Jul
Temperature (
°
C)
Time (Days)
observed modelled
Fig. 8. Observed and modelled temperature time series at
Mscig-niew; 2–14 July, hourly values.
July) the model under-predicted the maximum temperature at some stations (e.g. underestimation of near-surface tempera-ture for 12 July is shown in Fig. 14a for temperatempera-ture vertical profile for Legionowo).
Since a similar under-prediction was observed for ozone concentrations, the plausible reason might be the overesti-mation of the modelled cloud cover associated with the cold front that dissipated over Poland at that time. This resulted in reduction of the solar irradiance and led to underestima-tion temperature and, in consequence, biogenic emissions and ozone production efficiency.
The time series of temperature variation show a similar pattern for all analysed stations. The temperature increased significantly from 3 July to 7 July. During the next few days high temperatures persisted, but from 10 July to 12 July they decreased slightly due to the frontal activity. Due to the very slow movement of the frontal zone the dynam-ical forcing were not the same over the western and north-eastern parts of Poland and hence near-surface temperature decrease was detected on different days at different measure-ment sites. After the frontal passage the temperature ini-tially rose, but the change of wind direction and the inflow of colder air from northerly directions resulted in a tempera-ture decrease. Figure 9 shows a scatter plot of observed and predicted shelter-level maximum temperature for all simu-lated days in all stations. The largest discrepancies are found for the lowest temperatures, probably impacted by the frontal
activity. For the maximum temperatures below ∼30◦C the
model tends to overestimate, while for days with observed
temperatures exceeding ∼30◦C modelled maximum
temper-atures are slightly under-predicted. However, the differences between modelled and observed daily maximum tempera-tures are relatively small, and do not exceed 10%.
15 20 25 30 35 15 20 25 30 35 modelled maximum T ( ° C) observed maximum T (°C)
Fig. 9. Scatter plot of observed and modelled daily maximum
tem-perature.
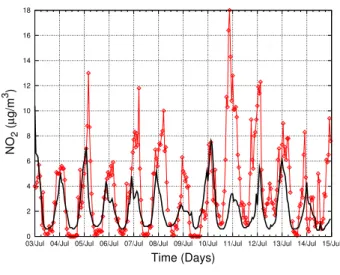
NO2 concentrations are shown in Figs. 10 and 11. The
best agreement seems to be obtained for stations influenced mainly by anthropogenic emissions (Olkusz). At the moni-toring sites where biogenic emissions are a dominant source, the agreement is the worst (Mscigniew). This is because the model uses predefined temporal variation profiles, and for biogenic emissions this profile is probably not represen-tative for the extreme heat wave conditions. Moreover, the modelled NO2concentration levels at these stations seem to be underestimated by comparison with measured values. At some stations modelled values were below the detection level of the measuring instrument.
4.3 Vertical structure
Many air quality models are designed for studying and
fore-casting near-surface air pollution. GEM-AQ model is a
tropospheric chemistry model, hence, apart from the com-parison against surface measurements, the analysis of the model’s performance in reproduction of the observed verti-cal structure of the atmosphere was undertaken. Figure 12 presents ozone vertical soundings from the Centre of Aerol-ogy in Legionowo, for 5 July and 12 July. On 5 July the model overestimates ozone partial pressure below ∼800 hPa of about 1 mPa. This corresponds to ∼10 ppb near the sur-face, which agrees with analysis of surface measurements for the Legionowo station for that day. In the free troposphere, the model tends to underestimate the ozone partial pressure by ∼1 mPa (corresponding to ∼16 ppb at 600 hPa). Major discrepancies are found at 200 hPa. The observations show a
0 20 40 60 80 100 120
03/Jul 04/Jul 05/Jul 06/Jul 07/Jul 08/Jul 09/Jul 10/Jul 11/Jul 12/Jul 13/Jul 14/Jul 15/Jul
NO 2 ( µ g/m 3 ) Time (Days) observed modelled
Fig. 10. Observed and modelled NO2time series at Olkusz; 2–14 July, hourly values.
significant increase of ozone at that height, while the model did not capture this rapid increase.
On 12 July the model underestimated the ozone par-tial pressure within the boundary layer (below 700 hPa) by ∼1 mPa. In the free troposphere the agreement is very good, but above 200 hPa the model slightly underestimates the measurements. The average gradient of the ozone profile is well represented in the troposphere.
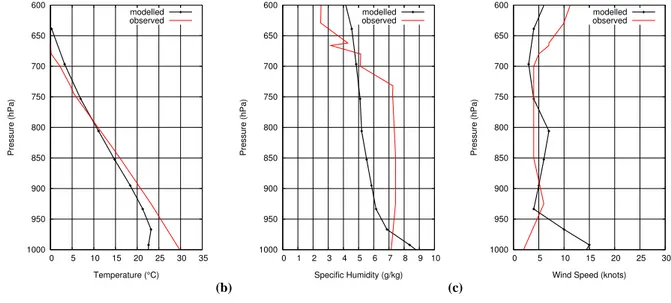
To understand the differences of ozone structure within the boundary layer, the temperature, specific humidity and wind vertical sounding from Legionowo were analysed for the whole period of simulation. Figures 13 and 14 present measurements below 600 hPa.
For the first week of the simulation, when anticyclonic conditions governed weather patterns, the observed capping inversion layer, associated with large-scale subsidence, was not reproduced by the model due to insufficient vertical res-olution. The modelled vertical structure of the lower tropo-sphere shows a thicker, weak stable layer above the mixing layer. Defining the mixing layer top at the level where the stable layer begins and the specific humidity significantly de-creases, the modelled height is usually underestimated dur-ing the daytime (12:00 UTC), as compared to observations. During the night time the agreement seems to be better de-spite the difficulties in reproducing the stable layer near the surface. On 5 July the largest discrepancies are found be-tween 850 hPa (modelled ABL top) and ∼750 hPa (observed capping inversion). The modelled ABL being too shallow is a plausible reason for the ozone overestimation within ABL for that day. The effect of accumulation was enhanced by the underestimated wind speed. During the second week of the analysed period Central Europe was influenced by frontal activity, which resulted in lack of a strong capping inversion.
0 2 4 6 8 10 12 14 16 18
03/Jul 04/Jul 05/Jul 06/Jul 07/Jul 08/Jul 09/Jul 10/Jul 11/Jul 12/Jul 13/Jul 14/Jul 15/Jul
NO 2 ( µ g/m 3 ) Time (Days) observed modelled
Fig. 11. Observed and modelled NO2time series at Mscigniew; 2–14 July, hourly values.
In most cases the agreement of vertical profiles is good, es-pecially for the daytime temperature. However, on 12 July the modelled temperature in the boundary layer was under-estimated, and the temperature profile indicates a stable con-dition below 950 hPa. This effect was probably caused by overestimated modelled cloud cover on that day. Tempera-tures that were too low, weak vertical mixing and overesti-mated wind speed resulted in ozone underestimation within the boundary layer.
In general, the model’s performance in reproducing the vertical structure of the lower troposphere is satisfactory. Discrepancies between modelled and observed ozone partial pressure are caused by insufficient vertical resolution, which had an impact on the modelled ABL structure. However, the pattern of variability and temporal evolution of ozone and meteorological parameters was captured well.
4.4 Exposure indices for temperature and ozone
The comparison with meteorological observations and air quality measurements confirmed good performance of the GEM-AQ model for the analysed period. Further investiga-tion of the exposure to high air temperatures and elevated concentrations of ozone is based on model results. The max-imum 8-h running average of ozone concentration was calcu-lated for each day of the simulation. According to the WHO guidelines for Europe applied to European Ozone Directive 2002/3/EC (2002), the highest 8-h concentration of ozone should not exceed 120 µg m−3for more than 25 days per year (target value for the year 2010). For the air temperature the 8-h average was calculated for the fixed time interval from 10:00 a.m. to 05:00 p.m. to represent mean daylight value.
On 3 and 4 July the average daylight temperature ex-ceeded 27◦C over Western Europe, with highest values over
(a) 10 100 1000 0 2 4 6 8 10 12 14 Pressure (hPa)
Ozone Partial Pressure (mPa) STN221 (52.4, 20.97) - 2006-07-05 Sonde GEM-AQ (b) 10 100 1000 0 2 4 6 8 10 12 14 Pressure (hPa)
Ozone Partial Pressure (mPa) STN221 (52.4, 20.97) - 2006-07-12
Sonde GEM-AQ
Fig. 12. Observed and modelled ozone vertical soundings from Legionowo; (a) 5 July, 12:00 UTC, (b) 12 July, 12:00 UTC.
(a) 600 650 700 750 800 850 900 950 1000 0 5 10 15 20 25 30 Pressure (hPa) Temperature (°C) modelled observed (b) 600 650 700 750 800 850 900 950 1000 0 1 2 3 4 5 6 7 8 Pressure (hPa) Specific Humidity (g/kg) modelled observed (c) 600 650 700 750 800 850 900 950 1000 0 5 10 15 20 25 30 35 Pressure (hPa)
Wind Speed (knots) modelled observed
Fig. 13. Observed and modelled vertical profiles for Legionowo on 5 July, 12:00 UTC; (a) temperature, (b) specific humidity, (c) wind speed.
France. The 8-h modelled ozone concentrations higher than
120 µg m−3occurred in Germany, the Netherlands, Belgium
and UK. After 5 July hot air masses reached Central Europe and Scandinavia. The area exposed to 8-h ozone concen-trations higher than 120 µg m−3extended to the north
(Den-mark, southern Norway and Sweden) and to the east (Poland, Lithuania, Czech Republic, Austria). From 7 July to 10 July the highest daylight air temperatures were recorded over Central-Eastern Europe (Fig. 15). Elevated concentrations of ozone were sustained over Central Europe and occurred
(a) 600 650 700 750 800 850 900 950 1000 0 5 10 15 20 25 30 35 Pressure (hPa) Temperature (°C) modelled observed (b) 600 650 700 750 800 850 900 950 1000 0 1 2 3 4 5 6 7 8 9 10 Pressure (hPa) Specific Humidity (g/kg) modelled observed (c) 600 650 700 750 800 850 900 950 1000 0 5 10 15 20 25 30 Pressure (hPa)
Wind Speed (knots) modelled observed
Fig. 14. Observed and modelled vertical profiles for Legionowo on 12 July, 12:00 UTC; (a) temperature, (b) specific humidity, (c) wind
speed.
(a) (b)
Fig. 15. Heat wave indicators; (a) 8-h averaged temperature for 8 July, (b) maximum 8-h average ozone concentrations for 8 July.
in Scandinavia and the Baltic countries. The average
day-light temperatures higher than 30◦C and 8-h ozone
aver-ages exceeding 140 µg m−3 occurred in Poland, Lithuania,
Latvia and Finland. On 11 July, despite the northern inflow, high temperatures were recorded over most of Europe. In Central-Eastern Europe very high ozone concentrations per-sisted and 8-h ozone average exceeded 140 µg m−3, but the clean air mass advected from the northerly direction termi-nated the episode over Scandinavia. After 12 July the heat wave returned to Western Europe; high temperatures were also recorded in Eastern Europe. Significant increases of ozone concentrations were recorded over Spain, France and Italy. At the same time inflow of a clear and cooler air mass
from the north reduced ozone concentrations in Central
Eu-rope, reducing O3 below the 8-h average threshold on 14
July.
To assess the heat wave exposure the number of hours
with the air temperature exceeding 30◦C was calculated
(Fig. 16a). Apart from South-Western Europe (Spain,
southern France, northern Italy) two regions in Central
Europe can be distinguished: The Hungarian Plateau
(50–70 h) and the Eastern and Central European plateau
(40–50 h). The maximum air temperatures are
pre-sented in Fig. 16b. The modelled values exceeded 32◦C
over most of Europe, even over the north-eastern part,
(a) (b)
Fig. 16. Heat wave exposure; (a) number of hours with temperature exceeding 30◦C over the simulation period, (b) maximum modelled air temperature over the simulation period.
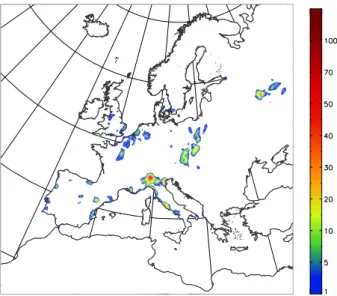
Fig. 17. Number of hours with ozone concentrations exceeding the
information threshold (180 µgm−3).
advective nature of the heat wave phenomenon in this
re-gion. It should be noted that during the analysed
pe-riod in South-Eastern Europe (Southern Italy, Adriatic Sea basin, Greece, and Bulgaria) the temperatures were rela-tively lower than in other parts of the continent, and ac-cording to MODIS images (http://earthobservatory.nasa.gov/ NaturalHazards/shownh.php3?img id=13765) lower than the 5-year (2000–2005) average for July.
The following indices defined in EU Ozone Directives 2002/3/EC were calculated to assess the exposure to photo-chemical pollution during the first two weeks of July 2006:
– number of hours with ozone concentrations exceeding the information threshold (180 µg m−3)
– number of days with maximum 8-h ozone average ex-ceeding 120 µg m−3
– SOMO35 (Sum Of Means Over 35 ppbv)
– AOT40 (Accumulated dose Over a Threshold of 40 ppbv)
SOMO35 and AOT40 are time integrals of surface ozone concentrations greater than 35 ppbv (for 8-h maximum ozone average) and 40 ppbv (for hourly ozone mean concentra-tions), respectively. SOMO35 is a measure of human ex-posure and refers to the health-relevant WHO threshold of 120 µg m−3, while AOT40 is a critical level for forests and agriculture (WHO, 2000).
The number of hours with ozone concentrations exceeding the information threshold of 180 µg m−3was calculated only over the land (Fig. 17). The location of occurrences of very high ozone concentrations seems to be related to the distri-bution of urban and industrial areas rather than to the heat wave extent. In Western and South-Western Europe the in-formation threshold was exceeded only for a few hours (in the beginning and the end of the analysed period) around ag-glomerations. The highest number of hours with ozone con-centrations exceeding 180 µg m−3are in the Po Valley around
Milan, where elevated ozone concentrations and very high temperatures persisted during the whole analysed period. In Central Europe (over Poland and Czech Republic) the num-ber of information threshold exceedances ranged from 5 to 20 h. The extent of very high ozone concentrations seem to be more widespread, but similar to other regions related to industrial areas. In Eastern Europe ozone exceedances are noted only in the vicinity of Moscow agglomeration. At
Fig. 18. Number of days with maximum 8-h ozone average
exceed-ing 120 µg m−3.
higher latitudes, despite the high temperatures, the informa-tion threshold was exceeded only three times around Helsinki and St. Petersburg. This indicated the importance of
anthro-pogenic NOxemissions.
According to the EU directive relating to ozone (2002/3/EC) the human health exposure is defined by the number of days with maximum daily 8-h mean ozone
con-centrations exceeding 120 µg m−3. The target value for
the year 2010 is 25 days per calendar year (averaged over three years). Figure 18 shows the distribution of the num-ber of days characterised by 8-h ozone average higher than the health protection threshold. During the analysed two-week period the number of such days ranged from 6 to 12 over Central Europe (Poland, Czech Republic, Hungary) and Southern Europe (Spain, Italy). At higher latitudes (Swe-den, Latvia, Estonia, Finland) the 8-h ozone averages were above the limit value from 3 to 5 days. The area exposed to a higher number of days with exceedances corresponds well to the occurrence of high temperatures in Central Eu-rope and the Baltic countries. In Eastern EuEu-rope, in spite of high temperature and anticyclonic conditions favouring pho-tochemical production, the modelled maximum and 8-h aver-age ozone concentrations over Ukraine, Belarus and South-Western Russia were below the critical thresholds. These results cannot be confirmed due to the lack of available air quality measurements, but it is plausible. The industrial ac-tivity and the precursors’ emissions over this area are lower than in Western and Central Europe. In addition, the diver-gence associated with the high pressure system prevented the inflow of polluted air masses from Central Europe.
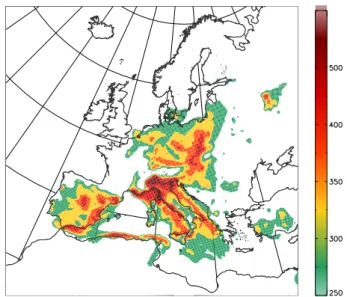
Another health-related index – SOMO35 – has been pro-posed by WHO/UNECE Task Force on Health for an
expo-Fig. 19. SOMO35 index [ppb days] calculated for the simulation
period.
sure proportional to the mortality (United Nations Economic and Social Council, 2004). In terms of impact, it is assumed that a decrease in the SOMO35 value of 600 ppb days will reduce the number of premature deaths by approximately 13 people per million inhabitants (EEA, 2006). SOMO35 values calculated for the 12-day period are very high – in the range of 300–500 ppb days, and expand widely over Central and Southern Europe (Fig. 19). The highest values are over northern Italy and Central Europe. The zone of higher expo-sure extended from Genova Bay towards the Baltic countries, following the advection pattern of hot air masses from over Algeria, described in Sect. 2.1. However, at the higher lati-tudes the exposure is significantly lower and reached 250 ppb days only over urban sites (Helsinki and St. Petersburg). In eastern Europe elevated values of SOMO35 are present around Moscow conurbation.
For the assessment of vegetation exposure, the AOT40 in-dicator was calculated. According to EU regulations (Direc-tive 2002/3/EC, 2002), for sensi(Direc-tive crops the critical level is set at 3000 ppb hours during the daytime over a three-month growing season (May–July). For forests, the critical level is set to 10 000 ppb hours, calculated over a six-month growing period. The AOT40 distribution calculated for the analysed period (Fig. 20) shows that in the first two weeks of July ozone levels already exceeded the 3-month critical exposure for crops. Over Central and Southern Europe AOT40 ranged from 3000 to 5000 ppb hours. Taking into account that cen-tral Europe is an agriculture region, such high exposure to ozone concentrations accompanied by high temperatures and droughts resulted in significantly reduced harvest. The spa-tial distribution of exposure zones is similar to the SOMO35 index.
Fig. 20. AOT40 index [ppb days] calculated for the simulation
pe-riod.
5 Conclusions
In the first two weeks of July 2006 a severe heat wave af-fected Central and North-Eastern Europe. In view of putative future increase of heat wave occurrences over Europe, the in-vestigation of its impact on photochemical pollution levels over different geographical regions is of major importance.
The on-line tropospheric chemistry model GEM-AQ was used to simulate the meteorological situation and photo-chemical processes over Europe for the time span from 3 July to 14 July 2006. Based on modelling results, an attempt has been made to analyse the nature of the heat wave observed over Central and North-Eastern Europe in the beginning of July 2006 and to investigate related exposure on photochem-ical pollution. The ozone episode occurred over most of the area exposed to high temperatures. Based on modelling re-sults, the zone of highest exposure was located over Central Europe along the advection path of the hot African air mass. At higher latitudes the heat wave impact was limited due to the advective nature of this phenomenon. The exposure to high ozone concentrations in this area was also reduced by the dilution and aging of polluted air masses advected from over Central Europe. In Eastern Europe, in spite of high tem-perature and anticyclonic conditions favouring photochemi-cal production, elevated ozone concentrations (in terms of maximum hourly values and exposure indices) were mod-elled only around Moscow agglomeration. In South-Eastern Europe, negative temperature anomalies were noted, which should be further studied in terms of synoptic situation and advection pathways. The calculated ozone exposure was rel-atively low in this region and limited to urban agglomera-tions.
A general outcome from this study is that the impact of heat wave conditions on the photochemical pollution is con-trolled by many independent factors. The three major factors are: the circulation patterns, the geographical location (e.g. lower solar radiation flux in higher latitudes) and the inten-sity of anthropogenic NOx emissions. Circulation patterns seem to play the major role in the frequency of occurrence of heat waves over Central-Eastern Europe. Also, atmospheric circulation governs the advection and/or blocking of polluted air masses in this region. Despite the wide heat wave ex-pansion towards north-eastern Europe, the calculated ozone exposure indices were relatively small in this area.
Assuming more frequent occurrence of the heat wave phe-nomena observed in July 2006, one can anticipate the in-crease of human and vegetation exposure indices (SOMO35 and AOT40) in central and North-Eastern Europe. Maximum concentrations would exceed information thresholds only in urban and industrial locations. However, the level of the ex-posure will strongly depend on applied emission reduction strategy in the future and on the possible changes in circula-tion patterns due to global and regional climate changes. Acknowledgements. The authors wish to acknowledge financial support from the Canadian Foundation for Climate and Atmo-spheric Sciences, Environment Canada, the Canadian Foundation for Innovation, and the Ontario Innovation Trust. Also, we thank R. Girgzdiene for providing ozone measurements from Lithuania. The authors also thank the anonymous reviewers for their helpful comments.
Edited by: R. Vautard
References
Beniston, M. and Diaz, H. F.: The 2003 heat wave as an exam-ple of summers in a greenhouse climate? Observations and cli-mate model simulations for Basel, Switzerland, Global Planet. Change, 44, 73–81, 2004.
Cˆot´e, J., Gravel, S., M´ethot, A., Patoine, A., Roch, M., and Stan-iforth, A.: The operational CMC–MRB Global Environmental Multiscale (GEM) Model. Part I: Design considerations and for-mulation, Mon. Weather Rev., 126, 1373–1395, 1998.
Directive 2002/3/EC: Directive 2002/3/EC of the European Parlia-ment and of the Council of 12 February 2002 relating to ozone in ambient air, Official Journal of European Communities, L 067, 09/03/2002, 14–30, 2002.
DWD: Der Recordsommer 2003, Tech. rep., Deutscher Wetterdi-enst, http://www.dwd.de/de/WundK/Klimadaten, 2003. EEA: Air quality and ancillary benefits of climate change policies,
Tech. rep., European Environment Agency, 2006.
Fiala, J., Cernikovsky, L., de Leeuw, F., and Kurfuerst, P.: Air pol-lution by ozone in Europe in summer 2003, Tech. rep., European Environment Agency, 2003.
Filleul, L., Cassadou, S., M´eDina, S., Fabres, P., Lefranc, A., Eil-stein, D., Tertre, A. L., Pascal, L., Chardon, B., Blanchard, M., Declercq, C., Jusot, J.-F., Prouvost, H., and Ledrans, M.: The relation between temperature, ozone, and mortality in the nine
French cities during the heat wave of 2003, Environ. Health Per-spect., 114, 1344–1347, 2006.
Fisher, P. H., Brunekreef, B., and Lebret, E.: Air pollution related deaths during the 2003 heat wave in the Netherlands, Atmos. En-viron., 38, 1083–1085, 2004.
Gauthier, P., Tanguay, M., Laroche, S., Pellerin, S., and Morneau, J.: Extension of 3D–Var to 4D–Var: implementation of 4D–Var at the Meteorological Service of Canada, Mon. Weather Rev., 135, 2339–2354, 2007.
H´emon, D. and Jougla, E.: Surmortalit´e li´ee `a la canicule d’aoˆut 2003, Rapport d’´etape INSERM, Paris, 2003.
IPCC: The Scientific Basis: Contribution of Working Group I to the Third Assessment Report of the Intergovernmental Panel on Climate Change, in: Climate Change 2001, edited by: Houghton, J., Ding, Y., Griggs, D., Noguer, M., van der Linden, P., and Xiaosu, D., Cambridge University Press, Cambridge, 881 pp., 2001.
Jendritzky, G., Bucher, K., and Bendisch, F.: Die Mortalitatsstudie des Deutschen Wetterdienstes, Annalen der Meteorologie, 33, 46–52, 1997 (in German).
Jones, P. D. and Moberg, A.: Hemispheric and large-scale surface air temperature variations: An extensive revision and an update to 2001, J. Climate, 16, 206–223, 2003.
Kaminski, J. W., Neary, L., Struzewska, J., McConnell, J. C., Lupu, A., Jarosz, J., Toyota, K., Gong, S. L., Liu, X., Chance, K., and Richter, A.: GEM–AQ, an on-line global multiscale chemical weather system: model description and evaluation of gas phase chemistry processes, Atmos. Chem. Phys. Discuss., 7, 14 895– 14 937, 2007.
Katsouyanni, K., Trichopoulos, D., Zavitsanos, X., and Touloumi, G.: The 1987 Athens heatwave, Lancet, 573, 1988.
Katsouyanni, K., Pantazopoulou, A., and Touloumi, G.: Evidence for interaction between air pollution and high temperature in the causation of excess mortality, Archives of Environmental Health, 48, 235–242, 1993.
Kunst, A. E., Looman, C. W. N., and Mackenbach, J. P.: Outdoor air temperature and mortality in the Netherlands: a time-series analysis, An. J. Epidemiol., 137, 331–341, 1993.
Kysely, J.: Mortality and displaced mortality during heat waves in the Czech Republic, Int. J. Biometeorol., 49, 91–97, 2004. Langmann, B.: Numerical modelling of regional scale transport and
photochemistry directly together with meteorological processes, Atmos. Environ., 34, 3585–3598, 2000.
Laroche, S., Gauthier, P., Tanguay, M., Pellerin, S., and Morneau, J.: Impact of the different components of 4D–Var on the global forecast system of the Meteorological Service of Canada, Mon. Weather Rev., 135, 2355–2364, 2007.
Lee, J. D., Lewis, A. C., Monks, P. S., Jacob, M., Hamilton, J. F., Hopkins, J. R., Watson, N. M., Saxton, J. E., Ennis, C., Car-penter, L. J., Carslaw, N., Fleming, Z., Bandy, B. J., Oram, D. E., Penkett, S. A., Slemr, J., Norton, E., Rickard, A. R., Whalley, L. K., Heard, D. E., Bloss, W. J., Gravestock, T., Smith, S. C., Stanton, J., Pilling, M. J., and Jenkin, M. E.: Ozone photochemistry and elevated isoprene during the UK heat-wave of August 2003, Atmos. Environ., 40, 7598–7613, doi: 10.1016/j.atmosenv.2006.06.057, 2006.
Liu, S. C., Trainer, M., Fehsenfelf, F., Parrish, D. D., Williams, E. J., Fahey, D. W., Hubler, G., and Murphy, P. C.: Ozone pro-duction in the rural troposphere and the implications for regional
and global ozone distribution, J. Geophys. Res., 92, 4191–4207, 1987.
Lyamani, H., Olmo, F. J., Alcantara, A., and Alados-Arboledas, L.: Atmospheric aerosols during the 2003 heat wave in southeastern Spain I: Spectral optical depth, Atmos. Environ., 40, 6453–6464, 2006.
Mailhot, J., Belair, S., Lefaivre, L., Bilodeau, B., Desgagne, M., Girard, C., Glazer, A., Leduc, A. M., Methot, A., Patoine, A., Plante, A., Rahill, A., Robinson, T., Talbot, D., Tremblay, A., Vaillancourt, P., Zadra, A., and Qaddouri, A.: The 15-km version of the Canadian regional forecast system, Atmospheric-Ocean, 44, 133–149, 2006.
McMichael, A. J. and Kovats, R. S.: Assessment of the impact on mortality in England and Wales of the heatwave and asso-ciated air pollution episode of 1976, Tech. rep., Department of Health, London School of Hygiene and Tropical Medicine, Lon-don, United Kingdom, 1998.
Memmesheimer, M., Jakobs, H. J., Tippke, J., Ebel, A., Piekorz, G., Weber, M., Geiss, H., Jansen, S., Wickert, B., Friedrich, R., Schwarz, U., and Smiatek, G.: Simulation of summer-smog episode in July 1994 on the European and urban scale with spe-cial emphasis on the photo-oxidant plume of Berlin., in: A con-tribution to the subproject GLOREAM and GENEMIS., edited by: Borrel, P. M. and Borrel, P., WITPress, Southampton, 1999. Olivier, J. G. J., Bouwman, A. F., van der Maas, C. W. M.,
Berdowski, J. J. M., Veldt, C., Bloos, J. P. J., Visschedijk, A. J. H., Zandveld, P. Y. J., and Haverlag, J. L.: Description of EDGAR version 2.0: A set of global emission inventories of greenhouse gases and ozone-depleting substances for all anthro-pogenic and most natural sources on a per country basis and on a 1×1 degree grid, RIVM report 771060 002/TNO-MEP report R96/119, Tech. rep., National Institute of Public Health and the Environment, Bilthoven, The Netherlands, 1996.
Rooney, C., McMichael, J. J., Kovats, R. S., and Coleman, M. P.: Excess mortality in England and Wales, and in Greater London, during the 1995 heatwave, Epidemiol Community Health, 52, 482–486, 1998.
Sartor, F., Snacken, R., Demuth, C., and Walckiers, D.: Tempera-ture, ambient ozone levels, and mortality during summer 1994, in Belgium, Environ. Res., 70, 105–113, 1995.
Sch¨ar, C., Vidale, P. L., Luthi, D., Frei, C., Haberli, C., Liniger, M. A., and Appenzeller, C.: The role of increasing temperature variability in European summer heatwaves, Nature, 427, 332– 336, 2004.
Scherrer, S. C., Appenzaller, C., Liniger, M. A., and Sch¨ar, C.: European temperature distribution changes in observations and climate change scenarios, Geophys. Res. Lett., 32, L19705, doi:10.1029/2005GL024108, 1–5, 2005.
Simpson, D., Guenther, A., Hewitt, C. N., and Steinbrecher, R.: Biogenic emissions in Europe. 1. Estimates and uncertainties, J. Geophys. Res., 100, 22 875–22 890, 1995.
Simpson, D., Winiwarter, W., B¨orjesson, G., Cinderby, S., Ferreiro, A., Guenther, A., Hewitt, C. N., Janson, R., Khalil, M. A. K., Owen, S., Pierce, T. E., Puxbaum, H., Shearer, M., Skiba, U., Steinbrecher, R., Tarras´on, L., and ¨Oquist, M. G.: Inventorying emissions from nature in Europe, J. Geophys. Res., 104, 8113– 8152, 1999.
Stedman, J. R.: The predicted number of air pollution related deaths in the UK during the August 2003 heatwave, Atmos. Environ.,
38, 1087–1090, 2004.
Tressol, M., Brioude, J., Mari, C., Thouret, V., Zbinden, R., and Cammas, J.-P.: Impact of Portugal fires on 2003 European pollu-tion, Geophys. Res. Abstr., 8, 07357, 2006.
United Nations Economic and Social Council: Modelling and as-sessment of the health impact of particulate matter and ozone, Summary report prepared by the joint Task Force on the Health Aspects of Air pollution of the WHO/ECEH and the Executive Body, 2004.
Vautard, R., Honore, C., Beekmann, M., and Rouil, L.: Simulation of ozone during August 2003 heat wave and emission control scenarios, Atmos. Environ., 39, 2957–2967, 2005.
WHO: Air Quality guideline for Europe, in: WHO Regional Publi-cations Second edition for Europe, Copenhagen, 2000.
WHO: Extreme weather and climate events and public health re-sponses, in: Report on a WHO meeting Bratislava, EUR/04/5036 794, Slovakia, 9–10 February 2004, World Health Organization, Regional Committee for Europe, 2004.