HAL Id: hal-02459574
https://hal.archives-ouvertes.fr/hal-02459574
Submitted on 29 Jan 2020
HAL is a multi-disciplinary open access
archive for the deposit and dissemination of
sci-entific research documents, whether they are
pub-lished or not. The documents may come from
teaching and research institutions in France or
abroad, or from public or private research centers.
L’archive ouverte pluridisciplinaire HAL, est
destinée au dépôt et à la diffusion de documents
scientifiques de niveau recherche, publiés ou non,
émanant des établissements d’enseignement et de
recherche français ou étrangers, des laboratoires
publics ou privés.
Allele Dependent DNA Methylation of the Human
Insulin Gene Promoter in T2D patients and Controls
Delphine Fradin, Clémence Mille, Nadia Naoui, Chris Groves, Mark Mccarthy,
Samy Hadjadj, François Paeou, Pierre Bougnères
To cite this version:
Delphine Fradin, Clémence Mille, Nadia Naoui, Chris Groves, Mark Mccarthy, et al.. Allele Dependent
DNA Methylation of the Human Insulin Gene Promoter in T2D patients and Controls. Epigenomics
of Common Diseases, Oct 2012, Baltimore, United States. �hal-02459574�
Allele Dependent DNA Methylation of the Human Insulin Gene Promoter
in T2D patients and Controls.
Delphine Fradin
1, Clémence Mille
1, Nadia Naoui
1, Chris Groves
2, Mark I McCarthy
2, Samy Hadjadj
3, François PaEou
4, Pierre Bougnères
11 INSERM U986 and Department of Pediatric Endocrinology, Bicêtre Hospital, Paris Sud University, Paris, France
2 Oxford Centre for Diabetes, Endocrinology and Metabolism, Churchill Hospital, Oxford, United Kingdom
3 Department of Endocrinology and metabolic diseases, CHU PoiVers, PoiVers, France
4UMR1101, Medicine University, Lille, France
Introduc)on
Numerous SNPs located at various gene loci related to insulin secreVon have been idenVfied by GWAS of T2D or of insulin-‐related traits (review in Bonnefondd et al. 2010). GeneVcs however seems to explain yet a limited part of these phenotypes (Wheeler et al. 2011). Non geneVc factors are certainly of utmost importance, and possibly include epigeneVc factors at the interface of geneVcs and environment (Chen et al. 2011).
Genotype dependent variaVons of neighboring epigenotype have been reported at several other loci across the genome and called ASM (Allele Specific DNA MethylaVon). Shoemaker et al. showed that 23% to 37% of heterozygous SNPs are associated with epigeneVc variaVon in several cell line (Shoemaker et al. 2010) while Zhang et al. found that ASM is likely to affect 10% of all human genes (Zhang et al. 2009). The finding of a link between geneVc variants and epigenomic marks may have major consequences for a beEer understanding of the “missing heritability”.
Several studies have established a significant associaVon between the class III VNTR, in complete linkage disequilibrium with the allele T of rs689, and T2D (On et al. 1999, PermuE et al. 1990).
Previous studies have found that INS gene expression is regulated by epigeneVc mechanisms (ChakrabarV et al. 2003, Mutskov et al. 2007 et 2009) such as DNA methylaVon (Kuorda et al. 2009, Yang et al. 2010). We also found an associaVon between DNA methylaVon of INS promoter and Type 1 Diabetes (Fradin et al. 2012).
The INS proximal promoter encompasses 7 CpGs located at posiVon -‐234, -‐206, -‐180, -‐135, -‐69 and -‐19bp relaVve to the TSS, too sparse to be considered a CpG island, thus the INS gene promoter is considered as a low CpG promoter. Three CpG residues are important to the binding of regulatory transcripVon factors: the -‐234 CpG site is part of the E2 box, -‐206 and -‐180 CpG sites are parts of cAMP responsive element (CRE) 1 and 2 respecVvely (Figure 1).
We performed geneVc and epigeneVc analysis of the INS promoter in whole blood cell (WBC) from two T2D case-‐control cohorts to study the relaVonship between DNA methylaVon levels and rs689 genotypes.
Results
Influence of cis genotype upon methyla4on.
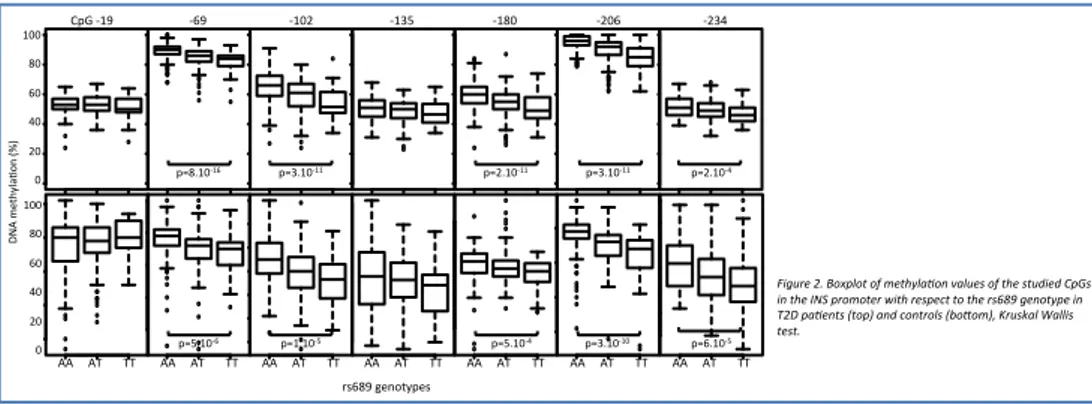
DNA methylaVon at CpG -‐69, -‐102, -‐180, -‐206 and -‐234 were found to be associated with rs689 genotypes in T2D paVents (N=491) and controls (N=361) from France (Figure 2). We replicated this finding in a second T2D case-‐control cohort from the UK where methylaVon at CpGs -‐69, -‐180 and -‐206 showed a comparable associaVon with rs689 genotypes.
Materials and Methods
Pa4ents. Non-‐immortalized WBC samples were taken from parVcipants of the Type 2 diabetes cohorts from PoiVers (T2D cases) and from parVcipants of the MONA LISA Lille study (controls). A sample of 132 non obese T2D paVents aged less than 65 years, studied in mean 7 yrs aoer T2D diagnosis, as well as 186 age-‐ and BMI-‐matched controls was provided by M. McCarthy.
Tissues. Human liver (n=14), peritoneum (n=26), skin (n=4), intesVne (n=2) and islets of Langerhans (n=4) were provided by F. PaEou. Each Vssue comes from a different person.
Isola4on of genomic DNA and bisulfite genomic conversion and pyrosequencing. Nucleic acids were extracted from WBC or Vssue using phenol/chloroform procedure. Genomic DNA was treated with EZ-‐96 DNA MethylaVon-‐Gold Kit, according to manufacturer’s protocol (Zymo Research CorporaVon). We PCR-‐amplified the bisulfite treated genomic DNA using unbiased nested primers (sequences on request) and performed quanVtaVve pyrosequencing (PyroMark Q96 MD, Qiagen). The percentage of methylaVon for each CpG site was determined for each subject using the Q-‐CpG methylaVon sooware (Qiagen) according to the standards in Tost and Gut (2001).
Rs689 genotyping. Rs689 was genotyped by restricVon fragment length polymorphism as previously described (Le Stunff et al. 2001). Sta4s4cal analysis. Differences in DNA methylaVon of the insulin promoter between rs689 genotypes were analyzed using non-‐parametric Kruskal-‐Wallis test. CorrelaVons were calculated as adjusted R square that measures the proporVon of the variaVon in the dependent variable accounted for by the explanatory variables. Differences in DNA methylaVon of the insulin promoter between T2D paVents and non-‐ diabeVc controls were analyzed using non-‐parametric Wilcoxon rank sum test. All staVsVcal analysis were conducted using R 2.10.1.
Conclusion
Our study reports the characteriza)on of the DNA methyla)on pa=ern of the INS gene promoter in human WBC. DNA methyla)on at CpG -‐19 of the INS promoter was consistently decreased in T2D cases compare to controls in our French and UK cohorts. We iden)fied an influence of the rs689 genotype upon DNA methyla)on in certain CpGs of the INS promoter.
These observed methyla)on differences emphasize the importance to consider both gene)c and epigene)c varia)on when studying genotype-‐phenotype associa)ons.
CG-234 CG-206 CG-180 CG-135 CG-102 CG-69 CG-19! +215pb! rs689! A/T!
Insuline!
Figure 1. Epigne0cs and gene0c of INS locus.
Rela4onship of methyla4on with age.
Age related changes in methylaVon were not uniform across the insulin gene promoter. MethylaVon of CpGs -‐135, -‐180 and -‐206 decreased slightly but significantly with age in the two French and UK cohorts (Figure 4) by losing 1.4, 1.8 and 1% methylaVon per 10 years. Other CpGs showed weaker but consistent changes with age, except for CpG -‐19 and -‐234.
AA AT TT 0 20 40 60 80 100 AA AT TT 0 20 40 60 80 100 AA AT TT 0 20 40 60 80 100 AA AT TT 0 20 40 60 80 100 AA AT TT 0 20 40 60 80 100 AA AT TT 0 20 40 60 80 100 AA AT TT 0 20 40 60 80 100 !""# $"# %"# &"# '"# "# ()*#+!,# # #+%, # ########+!"'# # ##+!-.# # ##########+!$"# # #####+'"%## # #+'-&# AA AT TT 30 40 50 60 70 AA AT TT 60 70 80 90 100 AA AT TT 30 40 50 60 70 80 90 AA AT TT 40 50 60 70 80 AA AT TT 20 40 60 80 AA AT TT 60 70 80 90 AA AT TT 35 40 45 50 55 60 65 //#####/0#######00# //#####/0#######00# //#####/0#######00# //#####/0#######00# //#####/0#######00# //#####/0#######00# //#####/0#######00# !""# $"# %"# &"# '"# "# 1 2 /# 3 456 78 9: ;< #=> ?#
)@$A!"+!%# )@-A!"+!!# )@'A!"+!!# )@-A!"+!!# )@'A!"+&#
)@.A!"+%# )@!A!"+.# )@.A!"+&# )@-A!"+!"# )@%A!"+.#
BC%$,#D4<;57)4C#
Figure 2. Boxplot of methyla0on values of the studied CpGs in the INS promoter with respect to the rs689 genotype in T2D pa0ents (top) and controls (boKom), Kruskal Wallis test. !" #!" $!" %!" &!" '!!" '#!" !" #$ %& '( )* +,-. + !""# $"# %"# &"# '"# "# #()*#+!,#########+%,############+!"'#############+!-. ####+!$"## #+'"% #####+'-&# / 0 1# 2 345 67 89 :; #<= >#
Figure 3. DNA methyla0on paKern at the INS promoter in several human 0ssues. Each sample is represented by a dashed line and mean by 0ssue is represented by a solid line (WBC in yellow, liver in bleu, skin in green, peritoneuml in red, intes0ne in black and islets of Langerhans in purple).
Methyla4on has a comparable paHern in whole blood cells and other 4ssues
Comparable methylaVon levels and paEern were found in WBC, liver, skin, peritoneum and intesVne (Figure 3). In contrast, islets of Langerhans, while following a comparable paEern of methylaVon had lower levels of methylaVon than WBC at all studied CpGs.
French cohort
T2D cases Controls p-value
n 491 361 CpG -19 54 ± 6 58 ± 7 2.10-16 CpG -69 86 ± 7 86 ± 7 0.6 CpG -102 61 ± 1 62 ± 1 0.51 CpG -135 50 ± 8 57 ± 8 2.10-16 CpG -180 56 ± 9 55 ± 10 0.24 CpG -206 91 ± 7 86 ± 6 2.10-16 CpG -234 50 ± 7 50 ± 6 0.67 UK cohort
T2D cases Controls p-value
n 348 337 CpG -19 48 ± 12 55 ± 10 1.10-10 CpG -69 89 ± 10 88 ± 7 0.004 CpG -102 67 ± 18 66 ± 13 0.05 CpG -135 59 ± 10 56 ± 9 0.0007 CpG -180 58 ± 18 62 ± 12 0.012 CpG -206 91 ±11 93 ± 7 0.84 CpG -234 57 ± 9 52 ± 7 1.10-15 20 304050 607080 90 0 20 40 60 80 100 all$age all$CG206 203040 5060 708090 0 20 40 60 80 100 all$age all$CG180 20 304050 607080 90 0 20 40 60 80 100 all$age all$CG135 2030 405060 708090 0 20 40 60 80 100 all$age all$CG102
!"#$%&'$ $ $%(' $ $$$$$$$$%&)*$ $ $$%&+,$ $ $$$$$$$$$$%&-)$ $ $$$$$%*)($$ $ $%*+.$
*)$$$$.)$$$$$()$$$$-)$ /01$2314567$ 58)9&,$ :8&9&)%'$ 58)9&;$ "8*9&)%&+$ 58)9),$ "8)9)&$ &))$ -)$ ()$ .)$ *)$ )$ <= /$ > 1?@ 3A 4B CD $2E 7$ 58)9&*$ "8,9&)%;$ 2030 405060 708090 0 20 40 60 80 100 all$age all$CG19 203040 506070 8090 0 20 40 60 80 100 all$age all$CG69 58)9)-$ "8)9))*$ 203040 506070 8090 0 20 40 60 80 100 all$age all$CG234 *)$$$$.)$$$$$()$$$$-)$ *)$$$$.)$$$$$()$$$$-)$ *)$$$$.)$$$$$()$$$$-)$ *)$$$$.)$$$$$()$$$$-)$ *)$$$$.)$$$$$()$$$$-)$ *)$$$$.)$$$$$()$$$$-)$
Figure 4. Correla0on between age and INS promoter methyla0on in our two T2D case-‐control cohorts.
Intergroup varia4on of methyla4on.
We found no T2D-‐related global direcVonal change in methylaVon level that would affect all CpGs, nor did neighbouring CpGs adopt systemaVc changes in methylaVon in T2D cases or controls.
Consistently, CpG -‐19 showed a decreased DNA methylaVon in T2D cases compared with non-‐diabeVc controls (p=2.10-‐16) in French and UK cohorts (Table 1).
Table 1. CpG methyla0on in the INS promoter in our two case-‐control cohorts. Results are expressed as mean ± sd. P-‐values are calculated by Wilcoxon rank sum test.