HAL Id: hal-02637545
https://hal.inrae.fr/hal-02637545
Submitted on 27 May 2020
HAL is a multi-disciplinary open access
archive for the deposit and dissemination of
sci-entific research documents, whether they are
pub-lished or not. The documents may come from
teaching and research institutions in France or
abroad, or from public or private research centers.
L’archive ouverte pluridisciplinaire HAL, est
destinée au dépôt et à la diffusion de documents
scientifiques de niveau recherche, publiés ou non,
émanant des établissements d’enseignement et de
recherche français ou étrangers, des laboratoires
publics ou privés.
Fine mapping of a large-effect QTL conferring Fusarium
crown rot resistance on the long arm of chromosome 3B
in hexaploid wheat
Zhi Zheng, Jian Ma, Jiri Stiller, Qiang Zhao, Qi Feng, Frédéric Choulet,
Catherine Feuillet, You-Liang Zheng, Yuming Wei, Bin Han, et al.
To cite this version:
Zhi Zheng, Jian Ma, Jiri Stiller, Qiang Zhao, Qi Feng, et al.. Fine mapping of a large-effect QTL
conferring Fusarium crown rot resistance on the long arm of chromosome 3B in hexaploid wheat. BMC
Genomics, BioMed Central, 2015, 16 (850), 7 p. �10.1186/s12864-015-2105-0�. �hal-02637545�
R E S E A R C H A R T I C L E
Open Access
Fine mapping of a large-effect QTL conferring
Fusarium crown rot resistance on the long arm of
chromosome 3B in hexaploid wheat
Zhi Zheng
1,2,3†, Jian Ma
1,4†, Jiri Stiller
1, Qiang Zhao
5, Qi Feng
5, Frédéric Choulet
6, Catherine Feuillet
6,
You-Liang Zheng
4, Yuming Wei
4, Bin Han
5, Guijun Yan
3, John M. Manners
1and Chunji Liu
1,2*Abstract
Background: Fusarium crown rot (FCR) is a major cereal disease in semi-arid areas worldwide. Of the various QTL reported, the one on chromosome arm 3BL (Qcrs.cpi-3B) has the largest effect that can be consistently detected in different genetic backgrounds. Nine sets of near isogenic lines (NILs) for this locus were made available in a previous study. To identify markers that could be reliably used in tagging the Qcrs.cpi-3B locus, a NIL-derived population consisting of 774 F10lines were generated and exploited to assess markers selected from the existing
linkage map and generated from sequences of the 3B pseudomolecule.
Results: This is the first report on fine mapping a QTL conferring FCR resistance in wheat. By three rounds of linkage mapping using the NILs and the NIL-derived population, the Qcrs.cpi-3B locus was mapped to an interval of 0.7 cM covering a physical distance of about 1.5 Mb. Seven markers co-segregating with the locus were developed. This interval contains a total of 63 gene-coding sequences based on the 3B pseudomolecule, and six of them were known to encode disease resistance proteins. Several of the genes in this interval were among those responsive to FCR infection detected in an earlier study.
Conclusions: The accurate localization of the Qcrs.cpi-3B locus and the development of the markers co-segregating with it should facilitate the incorporation of this large-effect QTL conferring FCR resistance into breeding programs as well as the cloning of the gene(s) underlying the QTL.
Keywords: Fusarium crown rot, Fine mapping, Hexaploid wheat, Co-segregating, SSR marker Background
Fusarium crown rot (FCR) is a chronic and serious disease of cereals. Field surveys showed that F. pseudograminearum is the most prevalent pathogen for FCR in Queensland and New South Wales in Australia but many different species of Fusarium can cause this disease [1]. Due most likely to the high intensity of cereal in cropping system combined with wider adoption of minimum tillage for moisture conservation, FCR has become more prevalent in many parts of the semiarid regions in recent years [2]. A survey in 2009 found that FCR causes an estimated annual yield
loss of $80 million Australia dollars in the wheat industry alone [3]. A study in the Pacific Northwest in USA showed that FCR could significantly reduce yield of both wheat and barley [4]. Additionally, FCR infected plants could also produce mycotoxins in grains as well as other tissues. The presence of these compounds in food and feeds can be harmful for human and livestock [5].
Growing resistant varieties has long been recognised as an integral part in effectively managing FCR [6]. Working toward the breeding of varieties resistant to this disease, sources of resistance were identified by germplasm screenings [6, 7]. Over the last decade, significant effort has also been made in identifying QTL conferring FCR resistance. Several QTL have been detected from several different sources of resistance [8]. Of the QTL reported so far, the one on 3BL consistently
* Correspondence:chunji.liu@csiro.au
†Equal contributors
1CSIRO Agriculture, 306 Carmody Road, St Lucia, QLD 4067, Australia 2
School of Plant Biology, Faculty of Science and The UWA Institute of Agriculture, The University of Western Australia, Perth, WA 6009, Australia Full list of author information is available at the end of the article
© 2015 Zheng et al. Open Access This article is distributed under the terms of the Creative Commons Attribution 4.0 International License (http://creativecommons.org/licenses/by/4.0/), which permits unrestricted use, distribution, and reproduction in any medium, provided you give appropriate credit to the original author(s) and the source, provide a link to the Creative Commons license, and indicate if changes were made. The Creative Commons Public Domain Dedication waiver (http://creativecommons.org/publicdomain/zero/1.0/) applies to the data made available in this article, unless otherwise stated.
gave the largest effects and was identified from several genotypes [9–11]. Limited data indicates that the 3BL locus also confers field resistance to FCR and it reduces whitehead incidence significantly under field conditions [8].
QTL mapping has become a routine procedure in locating genes controlling quantitative traits to specific genomic regions. However, QTL mapping has only limited resolution and markers obtained from such studies may not be reliably used in tagging the targeted loci [12]. The main reason why QTL mapping provides only limited resolution is due to the heterogeneity in genetic back-grounds in QTL mapping populations in regard to a targeted locus. Some non-targeted traits segregating in the QTL mapping populations could interfere with the accurate phenotyping of a targeted trait thus lines containing the same allele may exhibit different levels of resistance. Recent studies showed that both plant height and heading date have significant effects on FCR severity in both wheat and barley. LOD values and magnitudes of QTL conferring FCR resistance were both reduced when the effect of height and head-ing date were accounted for by the covariance analysis [13–15]. Thus these traits need to be fixed in segregat-ing populations which are suitable for developsegregat-ing markers tightly linked to a FCR locus.
Fixing genetic backgrounds in regarding to a targeted locus can be achieved with near-isogenic lines (NILs) [16–19] or populations generated from NILs [20]. Taken advantage of the newly released chromosome 3B pseudo-molecule [21], we used both NILs [22] and a NIL-derived population in developing tightly linked markers to the large-effect FCR locus on 3BL and results obtained are reported in this paper.
Results
Twenty SSR markers selected from the existing linkage map [23] for the Qcrs.cpi-3B interval were assessed. Nine of these markers detected polymorphism between isolines of the nine sets of NILs used in this study. Five of these markers (Xgwm247, Xwmc274, Xgwm547, Xgwm340 and Xgwm181) detected difference between the isolines for each of the nine NIL sets. Markers Xcfp1822 detected difference between isolines for eight of the nine NIL sets and Xgpw4513 detected differences between the isolines for seven of the nine NIL sets (Fig. 1a). Based on their order in the linkage map of chromosome 3B [23], Xcfp1822 and Xgpw4513were tentatively selected as candidates flanking the Qcrs.cpi-3B locus.
To determine the order of these SSR markers and con-firm the results obtained from the NILs, a subpopulation containing the first 160 lines of the fine mapping population were then analysed. Disease ratings of this subpopulation fell into two classes, one ranging from 0 to 1 (resistant) and the other from 4 to 5 (susceptible). There were no intermediate rantings and all individuals could be placed in one of the two classes (Additional file 1: Figure S1). The locus Qcrs.cpi-3B was successfully placed within the interval flanked by Xcfp1822 and Xgwm181 (Fig. 1b). Assessing the whole fine mapping population of 774 lines with these two flanking markers identified 40 recombinants. Aligning the two flanking markers against the 3B pseudomolecule (https://urgi.versailles.inra.fr/.) placed the distal marker Xgwm181 at the position of 773.7Mbp and the proximal marker Xcfp1822 at the position of 160Mbp. Eighteen new markers were designed based on the 3B pseudomolecule targeting this interval. Three of them (01, 02 and CS3BLCR-03) were polymorphic and they were all successfully
Fig. 1 Map location of the FCR locus Qcrs.cpi-3B based on data from the nine sets of near-isogenic lines (a) and based on the use of 160 NIL-derived lines (b)
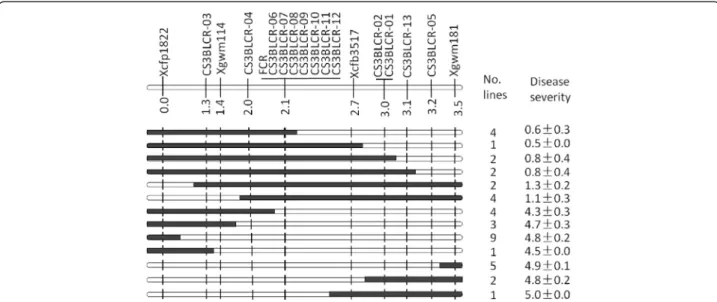
mapped in the targeted interval (Table 1). The targeted locus was mapped between marker CS3BLCR-01 and CS3BLCR-03 and the physical locations of these two flanking markers on the 3B pseudomolecule were at the positions 773.0 Mbp and 750.8 Mbp, respectively. Against this newly defined interval, another 20 markers were then designed based on the 3B pseudomolecule at a distance of about 10 Mbp between two adjacent markers. Four of these markers (Xgwm114, CS3BLCR-04, Xcfb3157 and CS3BLCR-05) detected polymorphism in the fine mapping population (Table 1) and their placements on the linkage map reduced the FCR locus to a 0.7 cM or 1.5Mbp interval flanked by CS3BLCR-04 and Xcfb3517 (Fig. 2).
To further define the FCR locus, the 3B pseudomolecule was used again to develop new markers for the targeted interval. Sixty markers were designed in this third round of marker development with an average density of about 0.2 Mbp between the markers (Additional file 2: Table S1). Seven of the 60 markers (including CS3BLCR-06, CS3BLCR-07, CS3BLCR-08. CS3BLCR-09, CS3BLCR-10, CS3BLCR-11and CS3BLCR-12) detected polymorphism in the mapping population and they all co-segregated with the FCR locus (Fig. 2).
Based on the 3B pseudomolecule, there were 63 CDSs in this 0.7 cM interval (or 1.5 Mb) containing the FCR locus. Six of them were known to encode disease resistance proteins (Additional file 3: Table S2). Further, we aligned RNA reads obtained from a recent study [24] and retrieved original paired reads for all aligned reads and de novo assembled them using CLC Genomic Workbench 7. This de novo assembly of the expressed reads identified 121 as-sembled contigs in the targeted interval. Of them, five were related to disease resistance (Additional file 4: Table S3).
This targeted interval also contains six of the differen-tially expressed genes following FCR infection and genes with SNPs between the resistant and susceptible NILs [24]. Together, the 17 genes and contigs from these three sources represent 15 unique sequences. Of them, nine were known to encode disease resistance proteins (Table 2).
Discussion and conclusions
FCR is a serious threat to cereal production in semi-arid areas worldwide and growing resistant varieties is an essential component in effectively managing the disease. Working toward the breeding of resistant varieties, sources of resistance have been identified and several QTL control-ling FCR have been reported. In the study reported here, we attempted to develop markers that can be reliably used to tag the FCR locus on 3BL. Using markers developed from the chromosome 3B pseudomolecule, the large-effect QTL was successfully mapped to an interval of 0.7 cM or 1.5 Mbp based on the nine sets of NILs and a NIL-derived population consisting of 774 lines. Within this interval, seven markers co-segregating with the targeted locus were developed and 15 unique genes or contigs related to disease resistance were identified. These results should facilitate not only the incorporation of this locus into breeding programs but also the effort of cloning gene(s) underlying the FCR locus.
The 18 markers mapped in this study covers a distance of 3.5 cM (Fig. 1). These markers covered a distance of 7.1 cM in the linkage map reported previously [23]. It is known that recombination rates at meiosis can be affected by many factors. In addition to the relateness of the parental genotypes [25], recombination frequencies can be regulated by major genes [26] and may also differ
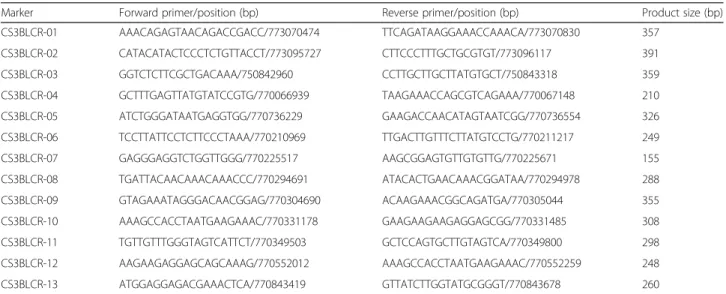
Table 1 Primers for new markers successfully mapped near the Qcrs.cpi-3B locus#
Marker Forward primer/position (bp) Reverse primer/position (bp) Product size (bp) CS3BLCR-01 AAACAGAGTAACAGACCGACC/773070474 TTCAGATAAGGAAACCAAACA/773070830 357 CS3BLCR-02 CATACATACTCCCTCTGTTACCT/773095727 CTTCCCTTTGCTGCGTGT/773096117 391 CS3BLCR-03 GGTCTCTTCGCTGACAAA/750842960 CCTTGCTTGCTTATGTGCT/750843318 359 CS3BLCR-04 GCTTTGAGTTATGTATCCGTG/770066939 TAAGAAACCAGCGTCAGAAA/770067148 210 CS3BLCR-05 ATCTGGGATAATGAGGTGG/770736229 GAAGACCAACATAGTAATCGG/770736554 326 CS3BLCR-06 TCCTTATTCCTCTTCCCTAAA/770210969 TTGACTTGTTTCTTATGTCCTG/770211217 249 CS3BLCR-07 GAGGGAGGTCTGGTTGGG/770225517 AAGCGGAGTGTTGTGTTG/770225671 155 CS3BLCR-08 TGATTACAACAAACAAACCC/770294691 ATACACTGAACAAACGGATAA/770294978 288 CS3BLCR-09 GTAGAAATAGGGACAACGGAG/770304690 ACAAGAAACGGCAGATGA/770305044 355 CS3BLCR-10 AAAGCCACCTAATGAAGAAAC/770331178 GAAGAAGAAGAGGAGCGG/770331485 308 CS3BLCR-11 TGTTGTTTGGGTAGTCATTCT/770349503 GCTCCAGTGCTTGTAGTCA/770349800 298 CS3BLCR-12 AAGAAGAGGAGCAGCAAAG/770552012 AAAGCCACCTAATGAAGAAAC/770552259 248 CS3BLCR-13 ATGGAGGAGACGAAACTCA/770843419 GTTATCTTGGTATGCGGGT/770843678 260
#Primer positions and the product sizes were based on those reported in the chromosome 3B pseudomolecule; the annealing temperature used for all of the primer sets was 55 °C
between egg and pollen mother cells [27, 28]. It is also well known that the presence of structural rearrangements between the parental genotypes can significantly reduce the recombination rates [29]. As the NILs and the NIL-derived population used for fine mapping in this study were all obtained from crosses between bread wheat (Triticum aestivumL.) and T. spelta genotypes [9, 22], the relatively distant genetic relatedness between the parental genotypes likely contributed to the reduced linkage distances obtained in this study. A population significantly larger than the one
used in this study is being produced and will be used to fur-ther define the targeted interval and identify the gene(s) conferring FCR resistance at this locus.
The availability of the chromosome 3B pseudomolecule [21] significantly facilitated the study reported here and there is no reason why the same approach can not be used to fine map genes of other traits on this chromosome. However, of the 98 pairs of primers designed in this study only 13 detected polymorphism and were successfully mapped in the targeted interval. This rate of success does not seem to be very high but could be even lower if populations generated from more closely related genotypes were used. The 3B pseudomolecule makes it feasible now to exploit a high-throughput genotyping approach in identifying genes controlling any trait on this chromosome. The one based on low-coverage whole genome resequencing [30] is very appealing especially in considering that chromosome 3B is readily sortable by flow cytometry [31].
Methods
Plant materials
Nine sets of NILs for the 3BL FCR locus derived from three segregating populations (including 120 F4 lines
from ‘Aus13832’/’CSCS6’, 108 BC1F4 lines from‘Janz’*2/
’CSCR6’ and 125 F7 lines from ‘Lang’/’CSCR6’) were
available [22] and they were used in identifying markers flanking the locus in this study. The resistance donor ‘CSCR6’ belongs to the taxon T. spelta. It is one of the genotypes which showed the best resistance among the over 2200 genotypes screened [7]. The three susceptible parents are all Australian varieties. Detailed mapping of the 3BL locus was conducted using a NIL-derived population consisting of 774 F10 lines. This fine mapping population Fig. 2 Genotypes and phenotypes of the haplotypes identified based on markers surrounding the FCR locus Qcrs.cpi-3B
Table 2 Unique sequences in the targeted interval harbouring the Qcrs.cpi-3B locus
Gene/sequences Putative function
TRAES3BF024600100CFD_c1 Disease resistance-responsive family protein
TRAES3BF279000170CFD_c1 Disease resistance rpp13-like protein 3-like TRAES3BF279000190CFD_c1 Disease resistance protein rga2
TRAES3BF279000200CFD_c1 Disease resistance rpp13-like protein 3-like TRAES3BF279000210CFD_c1 Disease resistance rpp13-like protein 2-like TRAES3BF279000290CFD_c1 NBS-LRR resistance partial
contig_11 Disease resistance protein rpm1 contig_55 Disease resistance protein rga4 contig_118 Disease resistance protein rga4 Ta#S32545039a AP3-complex subunit beta-A-like
Ta#S18011610a Metallothionein
Ta#S26024264a Unknown
Ta#S16266522a Unknown
Ta#S37789723a Unknown
Ta#S32500938a Gibberellin 2-beta-dioxygenase 8-like
a
UniGenes from the National Center for Biotechnology Information (NCBI) (downloaded fromftp://ftp.ncbi.nih.gov/repository/UniGene/Triticum_aestivum/)
was developed as part of this study from a single plant of Janz/CSCR6 [9] based on the heterogeneous inbred family (HIF) method [32]. An SSR marker, gwm181 locating near the peak of the FCR QTL on 3BL [9], was used to identify heterozygous lines in developing NILs. A single hetetozygous plant was used in developing the fine mapping population (at F10 generation) using the
fast-generation technique [33].
Genotyping and linkage analyses
Leaf tissues from the NILs and the fine mapping population were collected and stored at −80 °C until processing. Genomic DNA was extracted using the CTAB protocol [34]. PCR reactions for the marker analyses were carried out using α [33P] dCTP (3000 ci/mmol) following the manufacturer’s protocol (Multiplex-Ready Marker User Handbook, version 2.0). The amplified products were mixed with an equal volume of loading dye, denatured at 95 °C for 10 min, and 3.8 μl amplified samples were separated on a 5 % polyacrylamide gel containing 8 M urea at 100 W for 2 h. The gels were subsequently dried using a gel dryer for 50 min at 80 °C and exposed to Kodak X-Omat X-ray film for 4–6 days.
To construct a linkage map for the 3BL region, SSR markers from the existing linkage maps [23, 35] and new PCR-based markers developed based on the sequence of the 3B pseudomolecule [21] were screened for polymorph-ism against the nine sets of NILs [22]. Gene-coding sequences (CDSs) and 3B pseudomolecule sequence were downloaded from https://urgi.versailles.inra.fr/gb2/ gbrowse/wheat_annot_3B/. Primers for all of the new markers were designed with SSRPrimerII [36]. Linkage analysis was carried out using the computer package JoinMap 4.0 [37].
Evaluation of resistance to FCR
A highly aggressive F. pseudograminearum isolate, CS3096, was used in FCR assessment. This isolate was collected in northern New South Wales, Australia and maintained in CSIRO collection [1]. The methods used for inoculums preparation, inoculation and FCR assessment were based on that described by Li et al. [38]. Briefly, inoculums was prepared using plates of ½ strength potato dextrose agar (PDA). The inoculated plates were incubated for 7 days at room temperature before the mycelium was scraped. The plates were then incubated for a further 5–7 days under a combination of cool white and black (UVA) fluorescent lights with a 12 h photoperiod. The spores were harvested and the concentration of spore suspension was adjusted to 1 × 10⁶ spores per millilitre in distilled water. Tween 20 was added (0.1 % v/v) to the spore suspension prior to use for inoculation.
Seeds were germinated in Petri dishes on two layers of filter paper saturated with water. The germinated seedlings
were immersed in the spore suspension for 1 min and two seedlings were planted into square punnets of a 56-well tray (Rite Grow Kwik Pots, Garden City Plastics, Australia) containing stem sterilized University of California mix C (50 % sand and 50 % peat v/v). The punnets were arranged in a randomized block design in a controlled environment facility (CEF). Settings for the CEF were: 25/16 (±1) °C day/night temperature and 65/85(±5)% day/night rela-tive humidity, and a 14-hour photoperiod with 500 μmol m−2s−1 photon flux density at the level of the
plant canopy. To promote FCR development, water-stress was applied during the FCR assessment. Inoculated seedlings were watered only when wilt symptoms ap-peared. Three trials were conducted using the fine map-ping population and five additional trials were then carried out to assess those recombinant lines identified based on markers flanking the targeted interval containing the FCR locus. Each trial contains two replicates, each with 14 seed-lings. FCR severity was assessed 35 days post inoculation, using a 0 (no obvious symptom) to 5 (whole plant severely to completely nectrotic) scale as described by Li et al. [38].
Identification of genes of interest in the target region
Based on the fine mapping results described above, CDSs located in the targeted genomic region were retrieved from the 3B pseudomolecule [21]. Paired RNA reads from the first of the nine sets of NILs obtained from an earlier study [24] were re-analysed for identifying transcripts of interest in the targeted genomic region. RNA datasets were trimmed by SolexaQA scripts (http://solexaqa.sourceforge. net/) to a minimum quality value of 30 and a minimum length of 70. Alignments of RNA reads from resistant and sensitive NILs were performed using the Biokanga suite (a tool developed at CSIRO, not published) with 2 mismatches allowed per read. Paired reads for all reads aligned to the defined region containing the FCR locus were retrieved by in house built Perl scripts and de novo assembled using CLC Genomics Workbench 7.
Ethical standard
The authors state that the experiments conducted in this study comply with the current laws in Australia where they were conducted.
Availability of data and materials
All the supporting data are included as supplementary files.
Additional files
Additional file 1: Figure S1. Distribution of FCR severity in the subpopulation containing 160 lines. Disease severity was scored using a scale of 0 (no obvious symptom) to 5 (whole plant severely to completely nectrotic). (DOCX 39 kb)
Additional file 2: Table S1. Markers not polymorphic in the interval harboring the Fusarium crown rot resistance locus Qcrs.cpi-3B. (DOCX 26 kb) Additional file 3: Table S2. Annotations of the 63 coding sequences identified between markers CS3BLCR-04 and Xcfb3517 from the 3B pseudomolecule of Chinese Spring#. (DOCX 25 kb)
Additional file 4: Table S3. Annotations of assembled contigs from expressed RNA reads locating in the targeted interval harboring the FCR resistance locus Qcrs-cpi-3B#. (DOCX 30 kb)
Competing interests
The authors declare that they have no conflict of interest. Authors’ contributions
CL, JMM, and BH designed the study. ZZ, JM, JS, QZ, and QF conducted the experiments and analysed the data. FC and CF contributed sequence data of the chromosome 3B pseudomolecule before they were published. ZZ, JM, and CL wrote the manuscript. GY, YW and Y-LZ contributed to the design of the study and preparation of the manuscript. All authors read and approved the submitted manuscript.
Acknowledgements
This publication is based upon work supported by a joint CAS/CSIRO project (Project No R-1910-1) and an project from the International Science & Cooperation Program of China (No. 2015DFA30600). ZZ is grateful to the University of Western Australia and China Scholarship Council (CSC) for his PhD scholarships, and JM thanks the Sichuan Agricultural University and the China Scholarship Council for funding his visit to CSIRO Agriculture.
Author details
1CSIRO Agriculture, 306 Carmody Road, St Lucia, QLD 4067, Australia.2School
of Plant Biology, Faculty of Science and The UWA Institute of Agriculture, The University of Western Australia, Perth, WA 6009, Australia.3National
Foxtail Millet Improvement Centre, Institute of Millet Crops, Hebei Academy of Agricultural and Forestry Sciences, Shijiazhuang, China.4Triticeae Research
Institute, Sichuan Agricultural University, Wenjiang, Chengdu 611130, China.
5National Center for Gene Research, Shanghai Institutes for Biological
Sciences, Chinese Academy of Sciences, 500 Caobao Road, Shanghai 200233, China.6INRA-UBP Joint Research Unit 1095, Genetics, Diversity and
Ecophysiology of Cereals Clermont-Ferrand, Clermont-Ferrand F-63100, France.
Received: 16 June 2015 Accepted: 16 October 2015
References
1. Akinsanmi OA, Mitter V, Simpfendorfer S, Backhouse D, Chakraborty S. Identity and pathogenicity of Fusarium spp. isolated from wheat fields in Queensland and northern New South Wales. Crop Pasture Sci. 2004;55(1):97–107. 2. Chakraborty S, Liu CJ, Mitter V, Scott JB, Akinsanmi OA, Ali S, et al. Pathogen
population structure and epidemiology are keys to wheat crown rot and Fusarium head blight management. Australas Plant Pathol. 2006;35(6):643–55. 3. Murray GM, Brennan JP. Estimating disease losses to the Australian wheat
industry. Australas Plant Pathol. 2009;38(6):558–70.
4. Smiley RW, Gourlie JA, Easley SA, Patterson L-M, Whittaker RG. Crop damage estimates for crown rot of wheat and barley in the Pacific Northwest. Plant Dis. 2005;89(6):595–604.
5. Mudge AM, Dill-Macky R, Dong Y, Gardiner DM, White RG, Manners JM. A role for the mycotoxin deoxynivalenol in stem colonisation during crown rot disease of wheat caused by Fusarium graminearum and Fusarium pseudograminearum. Physiol Mol Plant Pathol. 2006;69(1):73–85.
6. Purss G. Studies of varietal resistance to crown rot of wheat caused by Fusarium graminearum Schw. Queensland J Agric Anim Sci. 1966;23:475–98.
7. Liu C, Ma J, Li H, Liu Y, Liu G, Wen S, et al. The homoeologous regions on long arms of group 3 chromosomes in wheat and barley harbour major crown rot resistance loci. Czech J Genet Plant Breed. 2011;47(SI):S109–14.
8. Liu C, Ogbonnaya FC. Resistance to Fusarium crown rot in wheat and barley: a review. Plant Breed. 2015;134(4):365–72.
9. Ma J, Li HB, Zhang CY, Yang XM, Liu YX, Yan GJ, et al. Identification and validation of a major QTL conferring crown rot resistance in hexaploid wheat. Theor Appl Genet. 2010;120(6):1119–28.
10. Li HB, Xie GQ, Ma J, Liu GR, Wen SM, Ban T, et al. Genetic relationships between resistances to Fusarium head blight and crown rot in bread wheat (Triticum aestivum L.). Theor Appl Genet. 2010;121(5):941–50.
11. Poole GJ, Smiley RW, Paulitz TC, Walker CA, Carter AH, See DR, et al. Identification of quantitative trait loci (QTL) for resistance to Fusarium crown rot (Fusarium pseudograminearum) in multiple assay environments in the Pacific Northwestern US. Theor Appl Genet. 2012;125(1):91–107. 12. Paterson AH, Lander ES, Hewitt JD, Peterson S, Lincoln SE, Tanksley SD.
Resolution of quantitative traits into Mendelian factors by using a complete linkage map of restriction fragment length polymorphisms. Nature. 1988;335(6192):721–6.
13. Liu YX, Yang XM, Ma J, Wei YM, Zheng YL, Ma HX, et al. Plant height affects Fusarium crown rot severity in wheat. Phytopathology. 2010;100(12):1276–81. 14. Zheng Z, Kilian A, Yan G, Liu C. QTL conferring fusarium crown rot resistance in
the elite bread wheat variety EGA Wylie. PLoS One. 2014;9(4):e96011. 15. Chen G, Liu Y, Ma J, Zheng Z, Wei Y, McIntyre CL, et al. A Novel and major
quantitative trait locus for fusarium crown rot resistance in a genotype of Wild Barley (Hordeum spontaneum L.). PLoS One. 2013;8(3):e58040. 16. Young ND, Zamir D, Ganal MW, Tanksley SD. Use of isogenic lines and
simultaneous probing to identify DNA markers tightly linked to the tm-2a gene in tomato. Genetics. 1988;120(2):579–85.
17. Paterson AH, DeVerna JW, Lanini B, Tanksley SD. Fine mapping of quantitative trait loci using selected overlapping recombinant chromosomes, in an interspecies cross of tomato. Genetics. 1990;124(3):735–42.
18. Pumphrey MO, Bernardo R, Anderson JA. Validating the QTL for Fusarium head blight resistance in near-isogenic wheat lines developed from breeding populations. Crop Sci. 2007;47(1):200–6.
19. Kaeppler S, Phillips R, Kim T. Use of near-isogenic lines derived by backcrossing or selfing to map qualitative traits. Theor Appl Genet. 1993;87(1–2):233–7.
20. Liu S, Zhang X, Pumphrey MO, Stack RW, Gill BS, Anderson JA. Complex microcolinearity among wheat, rice, and barley revealed by fine mapping of the genomic region harboring a major QTL for resistance to Fusarium head blight in wheat. Funct Integr Genomics. 2006;6(2):83–9.
21. Choulet F, Alberti A, Theil S, Glover N, Barbe V, Daron J, et al. Structural and functional partitioning of bread wheat chromosome 3B. Science. 2014;345(6194):1249721.
22. Ma J, Yan GJ, Liu CJ. Development of near-isogenic lines for a major QTL on 3BL conferring Fusarium crown rot resistance in hexaploid wheat. Euphytica. 2012;183(2):147–52.
23. Paux E, Sourdille P, Salse J, Saintenac C, Choulet F, Leroy P, et al. A physical map of the 1-gigabase bread wheat chromosome 3B. Science.
2008;322(5898):101–4.
24. Ma J, Stiller J, Zhao Q, Feng Q, Cavanagh C, Wang P, et al. Transcriptome and allele specificity associated with a 3bl locus for fusarium crown rot resistance in bread wheat. PLoS One. 2014;9(11):e113309.
25. Liu C, Devos K, Witcombe J, Pittaway T, Gale M. The effect of genome and sex on recombination rates in Pennisetum species. Theor Appl Genet. 1996;93(5–6):902–8.
26. Temin RG, Marthas M. Factors influencing the effect of segregation distortion in natural populations of Drosophila melanogaster. Genetics. 1984;107(3):375–93.
27. De Vicente M, Tanksley S. Genome-wide reduction in recombination of backcross progeny derived from male versus female gametes in an interspecific cross of tomato. Theor Appl Genet. 1991;83(2):173–8. 28. Busso C, Liu C, Hash C, Witcombe J, Devos K, De Wet J, et al. Analysis of
recombination rate in female and male gametogenesis in pearl millet (Pennisetum glaucum) using RFLP markers. Theor Appl Genet. 1995;90(2):242–6.
29. Devos KM, Atkinson M, Chinoy C, Francis H, Harcourt R, Koebner R, et al. Chromosomal rearrangements in the rye genome relative to that of wheat. Theor Appl Genet. 1993;85(6–7):673–80.
30. Huang X, Zhao Y, Wei X, Li C, Wang A, Zhao Q, et al. Genome-wide association study of flowering time and grain yield traits in a worldwide collection of rice germplasm. Nat Genet. 2012;44(1):32–9.
31. Doležel J, Kubaláková M, Paux E, Bartoš J, Feuillet C. Chromosome-based genomics in the cereals. Chromosome Res. 2007;15(1):51–66.
32. Tuinstra M, Ejeta G, Goldsbrough P. Heterogeneous inbred family (HIF) analysis: a method for developing near-isogenic lines that differ at quantitative trait loci. Theor Appl Genet. 1997;95(5–6):1005–11.
33. Zheng Z, Wang H, Chen G, Yan G, Liu C. A procedure allowing up to eight generations of wheat and nine generations of barley per annum. Euphytica. 2013;191(2):311–6.
34. Anderson JA, Ogihara Y, Sorrells ME, Tanksley SD. Development of a chromosomal arm map for wheat based on RFLP markers. Theor Appl Genet. 1992;83(8):1035–43.
35. Somers DJ, Isaac P, Edwards K. A high-density microsatellite consensus map for bread wheat (Triticum aestivum L.). Theor Appl Genet. 2004;109(6):1105–14. 36. Jewell E, Robinson A, Savage D, Erwin T, Love CG, Lim GA, et al. SSRPrimer
and SSR taxonomy tree: Biome SSR discovery. Nucleic Acids Res. 2006;34 suppl 2:W656–9.
37. Van Ooijen JW. JointMap 4. Software for the calculation of genetic linkage maps in experimental populations. Wageningen: Kyazma BV; 2006. 38. Li X, Liu C, Chakraborty S, Manners JM, Kazan K. A simple method for the
assessment of crown rot disease severity in wheat seedlings inoculated with Fusarium pseudograminearum. J Phytopathol. 2008;156(11–12):751–4.
Submit your next manuscript to BioMed Central and take full advantage of:
• Convenient online submission • Thorough peer review
• No space constraints or color figure charges • Immediate publication on acceptance
• Inclusion in PubMed, CAS, Scopus and Google Scholar • Research which is freely available for redistribution
Submit your manuscript at www.biomedcentral.com/submit