HAL Id: inserm-00336202
https://www.hal.inserm.fr/inserm-00336202
Submitted on 3 Nov 2009
HAL is a multi-disciplinary open access
archive for the deposit and dissemination of
sci-entific research documents, whether they are
pub-lished or not. The documents may come from
teaching and research institutions in France or
L’archive ouverte pluridisciplinaire HAL, est
destinée au dépôt et à la diffusion de documents
scientifiques de niveau recherche, publiés ou non,
émanant des établissements d’enseignement et de
recherche français ou étrangers, des laboratoires
signals in the time and frequency domain: identification
of epileptogenic networks in partial epilepsy.
Fabrice Wendling, Fabrice Bartolomei, Lotfi Senhadji
To cite this version:
Fabrice Wendling, Fabrice Bartolomei, Lotfi Senhadji. Spatial analysis of intracerebral
electroen-cephalographic signals in the time and frequency domain: identification of epileptogenic networks
in partial epilepsy.. Philosophical Transactions of the Royal Society A: Mathematical, Physical and
Engineering Sciences, Royal Society, The, 2009, 367 (1887), pp.297-316. �10.1098/rsta.2008.0220�.
�inserm-00336202�
electroencephalographic signals in the
time and frequency domain: identification
of epileptogenic networks in partial
epilepsy
B y Fabrice Wendling1,2, Fabrice Bartolomei3,4,5 and Lotfi Senhadji1,2
1INSERM, U642, Rennes, F-35000, France 2Universit´e de Rennes 1, LTSI, Rennes, F-35000, France
3INSERM, U751, Marseille, F-13000, France
4Aix Marseille Universit´e, Facult´e de M´edecine, Marseille, F-13000, France 5AP-HM, Hˆopital de la Timone, Service de Neurophysiologie Clinique, Marseille,
F-13000, France
Electroencephalography (EEG) occupies an important place for studying human brain activity in general, and epileptic processes in particular, with appropriate time resolution. Scalp-EEG or intracerebral-EEG signals recorded in patients with drug-resistant partial epilepsy convey important information about epileptogenic networks that must be localized and understood prior to subsequent therapeutic procedure. However, this information, often subtle, is “hidden” into the signals. It is precisely the role of signal processing to extract this information and to put it into a “coherent and interpretable picture” that can participate into the therapeu-tic strategy. Nowadays, the panel of available methods is very wide depending on the objectives like, for instance, the detection of transient epileptiform events, the detection and/or prediction of seizures, the recognition and/or the classification of EEG patterns, the localization of epileptic neuronal sources, the characterization of neural synchrony, the determination of functional connectivity, among others. The intent of this paper is to focus on a specific category of methods providing relevant information about epileptogenic networks from the analysis of spatial properties of EEG signals in the time and frequency domain. These methods apply either to interictal or to ictal recordings and share the common objective of localizing the subsets of brain structures involved in both types of paroxysmal activity. Most of these methods were developed by our group and are routinely used during pre-surgical evaluation. Examples are detailed. Results, as well as limitations of the methods, are also discussed.
Keywords: Electroencephalography, intracerebral, epilepsy, interictal, ictal, statistical signal processing, spike detection, bivariate analysis, time-frequency
1. Introduction
Epilepsy is a neurological disease that directly affects 50 million people worldwide (Prilipko et al., 2006). It is characterized by the recurrence of seizures that markedly deteriorate the patient’s quality of life. Epilepsy is a complex disease because there are many possible causes for seizures. In fact, any disturbance of the normal neu-ronal activity due to illness, brain damage or abnormal brain development can provoke seizures and subsequently epilepsy (Hauser & Lee, 2002).
In 20 % to 30 % of the cases, anti-epileptic drugs do not allow for efficient con-trol of seizures. In most patients, these drug-resistant epilepsies are “partial” or “focal”, i.e. seizures are generated in a hyperexcitable brain region, often referred to as the epileptogenic zone (EZ), located in one or both hemispheres. In partial epilepsies, the localization and the precise definition of the EZ are the two main issues to be solved in order to propose to the patient an alternative therapeutic strategy like surgery which, for these patients, may at present be the only option to suppress seizures. Therefore, during the pre-surgical evaluation of patients with drug-resistant partial epilepsy, a number of clinical investigations providing both anatomical (presence of a lesion, for instance) and functional (presence of abnor-malities in brain electrical or metabolic activity, for instance) data are performed in order to determine the organization of the EZ which often corresponds to a network of structurally and functionally connected brain structures (Bartolomei et al., 2001; Bragin et al., 2000; Briellmann et al., 2004). Among these investigations, electroencephalography (scalp EEG) and stereoelectroencephalography (intracere-bral EEG) consist in the measurement of brain electrical activity using electrodes positioned either on the head or directly implanted into brain structures respec-tively, potentially involved into the generation of epileptic events, either during ictal periods (seizures) and during interictal periods (outside seizures). Therefore, in a given patient, EEG signals contain essential information about the topology of his/her epileptogenic network. This information must be “extracted” from signals and must be “decoded” by clinicians in order to define the best surgical procedure aimed at suppressing seizures while keeping the patient’s cognitive, sensory and/or motor functions intact.
The visual inspection of intracerebral EEG signals remains a difficult task, es-pecially in the context of pre-surgical evaluation where epileptic patients are mon-itored for several days, twenty four hours a day. This visual inspection can be partly helped by the use of signal analysis methods that make the processing of large amounts of data easier and that can characterize some information which can hardly be quantified visually (like the coherence between signals recorded from dis-tant sites). Although the concept of “quantified EEG” started in the early 1960s, the past decades have seen a considerable development of digital signal processing methods due, in particular, to the use in clinical practice of digitized video-EEG monitoring systems which progressively replaced analogous systems since the 1990s. Nowadays, the panel of available methods is very wide depending on the objec-tives like, for instance, the detection of transient epileptiform events (Senhadji & Wendling, 2002), the detection and/or prediction of seizures (Gotman, 1999; Lehn-ertz et al., 1999; Iasemidis, 2003), the recognition and/or the classification of EEG patterns (Creutzfeldt et al., 1985; Wendling et al., 1997), the localization of epileptic neuronal sources (Ebersole & Hawes-Ebersole, 2007), the characterization of neural
synchrony (Uhlhaas & Singer, 2006), the determination of functional connectivity (Stam et al., 2007), among others.
The intent of this paper is not to cover all the aforementioned topics but to concentrate on a specific category of methods providing relevant information about the EZ from the analysis of time-frequency and spatial properties of EEG signals (here, the terminology “spatial” refers to the concept of interdependency between signals recorded from distinct brain regions). Some of the methods presented in this paper can be applied to transient events (epileptic spikes) occurring during interic-tal periods, some can be applied on the on-going EEG activity, in particular, during the transition from interictal to ictal activity. In all cases, as used in the context of epilepsy, the general purpose of reviewed methods is to derive relevant information about the topology of neural networks involved in both types of paroxysmal ac-tivity from invasive (intracerebral EEG) observations. Detailed examples are based on methods that are routinely used during pre-surgical evaluation. These meth-ods provide interpretable and useful information about epileptogenic networks and therefore about subsequent surgical procedure to be performed in the singularity of the problem posed by each patient.
To end with, it is noteworthy that some other approaches that are also used dur-ing pre-surgical evaluation for focus localization and extent are not dealt with in this paper as spatial methods developed in the field of epilepsy over the past decades (see (Michel et al., 2004) for review). Along these lines, we did not report results about linear methods (based on multivariate autoregressive model) proposed to estimate causality (in Granger sense) between signals like the directed coherence method (DCOH) or the partial directed coherence (PDC), among others (see (Gourevitch et al., 2006) for review on potential applications in neurophysiology).
2. Intracerebral EEG recording in partial epilepsies
Generally speaking, electroencephalography is used for both clinical and research purpose. It consists in measuring the electrical activity of the brain using electrodes positioned on the surface of the head (i.e. scalp). From biophysical considerations, it is known that the EEG is mainly sensitive to the post-synaptic activity of neu-ronal cells aligned in space, like the pyramidal cells of the neocortex (organized in “palisades”), for instance (Lopes da Silva, 2002). In partial epilepsies, for pre-surgical evaluation purpose, direct recording from intracerebral electrodes can also be performed.
In the context of partial epilepsies, most of the clinical units make use of 23 to 32 scalp electrodes in routine. The sampling rate of EEG signals also dramatically increased during the past years as the presence of fast (gamma frequency band, 30-80 Hz) and very fast activity (beyond gamma) might be a signature of some particular types of epilepsy (Rampp & Stefan, 2006). The analysis of scalp EEG recordings (always performed in conjunction with the video) is intended to extract information on the presence of epileptiform events in interictal periods (epileptic spikes, spike-waves), on the presence of abnormal rhythms (slow waves), on lateral-ization (i.e. the hemisphere in which seizures start), on the approximate locallateral-ization of the EZ in a given brain region (frontal, temporal, ). Such information provides essential arguments to determine which brain structures are potentially involved in the epileptogenic network. It is thus directly used to define the position of
in-tracerebral electrodes, prior to surgery. Indeed, inin-tracerebral EEG recording may be necessary when hypotheses about the precise location and organization of the EZ (formulated from non invasive data) are not sufficient to define the surgical procedure (brain resection). Several techniques are available for direct recording of the brain activity depending on the type of electrode that is used and on the way electrodes are positioned in target brain structures. One of the gold stan-dard is the “stereoelectroencephalography” (SEEG) introduced by Bancaud and Talairach in the 1960s (Bancaud & Talairach, 1973). This technique is illustrated in figure 1. It is based on the stereotaxic registering of the target anatomical struc-tures and allows for recording of electrical activity within the intracranial space. This attempt to characterize the epileptic activity according to a three-dimensional topography remains in contrast to the other existing neurophysiological methods of presurgical exploration based on electrocorticography (ECoG) that uses subdural grid electrodes. The SEEG has been therefore developed in part with the aim of overcoming certain limitations linked with the 2-D and surface features of EcoG recording. The core of the method is the “anatomo-electro-clinical correlation”: a close analysis of clinical signs (semiology) and their relationship with the regions primarily and secondarily involved in the epileptic discharge. The aim is to define a temporo-spatial profile of the seizure’s origin and propagation, thus aiding the decision for accurate surgical intervention to be performed.
3. From intracerebral EEG signals to epileptogenic networks
(a) Identification of subsets of structures involved in interictal activity (i) Research context and problem statement
As mentioned previously, two types of epileptic activity reflect in EEG signals: seizures and paroxysmal transient events, often referred to as “interictal spikes” when they show a sharp component. The exact relationship between networks of structures involved in both types of activity is a recurrent question in epileptol-ogy. Although this relationship remains unclear, the analysis of interictal events is complementary to the analysis of seizures and is recognized as useful in the study of the epileptogenic zone. For the past decades, numerous studies were performed on interictal paroxysmal events both in human (Talairach & Bancaud, 1966) and animal models (Avoli & Barbarosie, 1999). Their morphology was first studied by Penfield and Jasper (Penfield & Jasper, 1954) who introduced two classes (primary and propagated) and found that sharper spikes were markers of the epileptogenic lesion. Then a central question was raised about the characterization of their spatio-temporal distribution, both in surface and intracerebral EEG signals (Barth et al., 1984; Chauvel et al., 1987; Stefan et al., 1990). Mapping techniques were devel-oped (Badier & Chauvel, 1995) and revealed the origin of interictal spikes as well as possible propagation schemes. Several studies based on intracerebral recording in human also suggested that regions leading interictal activity may match seizure onset zones (Asano et al., 2003; Hufnagel et al., 2000). Their identification could therefore help to tailor resections in order to improve seizure control as suggested earlier in (Alarcon et al., 1997).
This brief literature review indicates that the co-occurrence of interictal spikes generated within distant structures can be considered as a key information. It also
Figure 1. a) Stereoelectroencephalography (SEEG) recording technique used during pre– surgical evaluation of patients with drug-resistant epilepsy. b) An example of intracerebral EEG recording performed in a patient with TLE (interictal activity). Capital letters A, B, C, , B’ refer to electrode labels. Targeted structures: A: amygdala and middle temporal gyrus, B: anterior hippocampus and middle temporal gyrus, C: posterior hippocampus and middle temporal gyrus, TP: temporal pole, H’: insula and superior temporal gyrus, TB: temporo-basal cortex, GC: cingular gyrus, B’: anterior hippocampus (contra-lateral electrode)
shows that questions related to the organization of transient epileptic events (in time and space) remain open: in a given patient, what are the cerebral structures involved during these events? Are these structures involved in a reproducible way? How can reproducibility be objectively characterized? The central question to be
solved from multichannel depth-EEG signals is therefore to automatically identify the multiple structures that are conjointly involved in the generation of transient epileptic events, in a reproducible way. This problem is particularly complex if one considers i) the tremendous amount of spikes (up to several thousands per hour) that can be recorded during pre-surgical evaluation that usually lasts for 5 to 8 days and ii) the apparent variability of electrophysiological patterns (in terms of EEG waveforms and involved brain structures during interictal events).
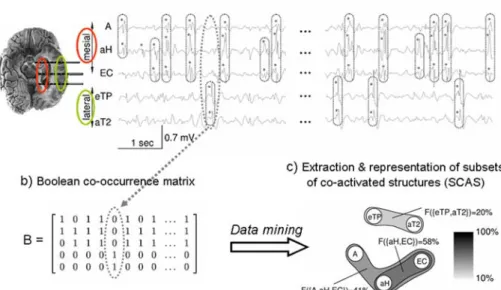
(ii) Method: automatic identification of subsets of co-activated structures (SCAS) Only few information processing methods able to statistically characterize the spatio-temporal distribution of interictal transient events in large data sets have been reported up to now. The objective of this section is to present the approach proposed in (Bourien et al., 2005; Bourien et al., 2004) that can be seen as a com-plement to the visual analysis performed by the epileptologist. From the processing of long duration intracerebral EEG recordings, this approach can automatically extract the subsets of brain structures frequently and conjointly involved in the generation of intracerebral interictal spikes (referred to as “subsets of co-activated structures” or “SCAS”). The approach is summarized in figure 2. It proceeds ac-cording to three steps that are briefly described below: a) the automatic detection of monochannel intracerebral interictal spikes (mono-IIS), b) the formation of mul-tichannel intracerebral interictal spikes (multi-IIS), c) the automatic extraction of SCAS which makes use of a data mining algorithm and statistical tests.
1) Detection of monochannel intracerebral interictal spikes (mono-IIS)
Mono-IIS are transient events frequently observed in EEG signals recorded in epilep-tic patients. The detection of interictal spikes is considered as a difficult problem. It has been - and is still - the topic of a large number of publications in the field of EEG analysis. Many algorithms have been proposed based on Fourier or wavelet transforms, on mimetic and rule-based approaches, on neural networks, on adap-tive filtering (template matching), on principal or independent component analysis. Readers may refer to (Gotman, 1999) and to (Senhadji & Wendling, 2002; Tzal-las et al., 2006) for partial reviews. As shown in many studies, even very recent (Brown et al., 2007), the ideal spike detector does not exist as the specificity and the sensitivity remain difficult to control in a context where i) the frequency of spikes is modulated by the patient state (Gotman & Wang, 1992) and ii) where human experts have themselves difficulties, in some cases, to assess the presence of spikes in EEG signals (Dumpelmann & Elger, 1999).
From electrographic viewpoint, interictal events are generally characterized by a sharp component called spike, sometimes followed by a slow wave (Chatrian et al., 1974). The spike component (the “useful signal”) is high amplitude and short duration compared to background EEG activity (the “noise”). In this section, we present a time-frequency domain method that makes use of a first stage for en-hancing the signal-to-noise ratio and of a second stage for deciding whether or not a spike is present. The first stage is based on a wavelet decomposition which has proven particularly suited for enhancing transient signals well localized in time and in frequency. More specifically, a quadratic approach is used in which the cumula-tive valueq(t) of squared modulus of outputs of a wavelet filter banks is computed at each sample time t (Senhadji et al., 1995). The amplitude of quantityq(t) is
ran-dom and depend on the signal content. During background EEG, its mean value is low. Conversely, during spike episodes, its mean value become higher as coeffi-cients associated with high frequency bands transiently increase. This behaviour is used in the second stage which makes use of a Page-Hinkley change-point algorithm (Basseville & Nikiforov, 1993) in order to automatically estimate time instants cor-responding to abrupt changes of q(t). In this method, two parameters (the bias and the threshold) are to be adjusted separately to adapt detection performances (in terms of false negatives and false positives). Using simulations (not reported here), authors showed that this detection method produces only few false negatives even if the rate of false positives may be higher compared to other methods. This feature was considered as acceptable since it minimizes the lost information (spikes not detected) and consequently has a limited effect on the next steps of the entire procedure of SCAS extraction. For the first stage of the whole detection procedure, authors also found that performances obtained for a wavelet based approach were similar to those obtained for a Gabor decomposition based approach in which fil-ters have a uniform bandwidth (see for example (Senhadji et al., 1997) in which different quadratic spike detectors are quantitatively compared).
2) Identification of multichannel intracerebral interictal spikes (multi-IIS) The purpose of this step is to identify muti-IIS, defined as electrographic events appearing in multichannel EEG signals and including at least 2 mono-IIS that “co-occur” in the same temporal interval of duration D. Typically, this issue can be solved using an algorithm based on a window of durationD sliding on multichannel EEG signals, after detection of mono-IIS (previous step), as described in (Bourien et al., 2004). This algorithm leads to the construction of an boolean matrix whose element is equal to 1 if a mono-IIS is present on channel within the jth multi-IIS, and is equal to zero otherwise. The columns of matrixB contain the co-occurrence information extracted from multichannel EEG data. This information is the input of the third step on the procedure aimed at extracting SCAS. In the following, this matrix is referred to as the “co-occurrence boolean matrix”. In the identification of multi-IIS, the critical parameter isD which is dependant on both the duration of multi-IIS and on the time separating distinct multi-IIS. It must be sufficiently short to avoid fusion of temporally unrelated monochannel events but it must be long enough to avoid the situation where temporally related events are not detected. Experimentally, authors obtained good extraction of multi-IIS in mesial temporal lobe epilepsy (MTLE) for D values ranging between 100 msec and 250 msec in accordance with range values indicated in (Alarcon et al., 1994).D was then chosen to be equal to 150 msec.
3) Extraction of subsets of co-actived structures (SCAS)
This third step consists in extracting, from matrix B, “maximal” and “frequent” SCAS, i.e. the subsets including a maximal number distant brain structures that fre-quently co-activate during transient events. A straightforward exhaustive method for solving this problem is to classify all subsets present in B (each class corre-sponding to a set of column vectors with the same coordinates equal to 1) and to compute the frequency of occurrence of each class. However, for a high numberN of channels, the algorithmic complexity becomes very high. As described in (Bourien et al., 2004), an alternative solution is to use algorithmic techniques coming from data mining that were proposed to efficiently extract frequent sets of items (or “itemsets”) from large databases with reduced computation time. Such techniques
were initially developed by Agrawal et al. (Agrawal & Srikant, 1994) and Mannila et al. (Mannila et al., 1994) who first proposed iterative methods that considerably reduce the number of candidate itemsets to be tested at each step. The key idea starts from the fact that i) a set of n items (or “n-itemset”) is composed of at least 2 parent (n-1)-itemsets which partially overlap and ii) a n-itemset is frequent only if its two parents are themselves frequent. Based on these ideas, an algorithm called APRIORI was developed. The basic principle of APRIORI is quite simple: at iteration n, the candidate n-itemsets are built from the frequent (n-1)-itemsets and are compared to a threshold in order to evaluate if they are frequent. If so, they are called -frequent itemsets. Finally, for each discrete value of -frequent itemsets containing a maximum number of items can also be extracted by the algorithm. In our case, these maximal -frequent itemsets correspond to the SCAS to be extracted from co-occurrence matrixB, itself constructed from the detection of mono-IIS. At this level, Monte-Carlo simulations and statistical tests can be performed to evalu-ate the significance of extracted SCAS (“organized spatial distribution of mono-IIS” versus “random spatial distribution of mono-IIS”).
Figure 2. Signal processing method for identifying subsets of structures involved in interictal epileptic events (adapted from Bourien et al. 2005). See text for details.
(iii) Results and discussion
In this section, we report the main findings obtained from the application of the method in fifteen patients with intractable partial epilepsy of temporal origin. From simultaneous intracerebral recording of mesial (hippocampus, amygdala, en-torhinal cortex, temporo-basal cortex, internal temporal pole) and lateral (superior, middle and inferior temporal gyri, insula, external temporal pole) structures, the first objective was to characterize the subsets of structures that co-activate during
the generation of interictal spikes. The second objective was to relate these subsets to particular anatomo-functional systems in the temporal lobe.
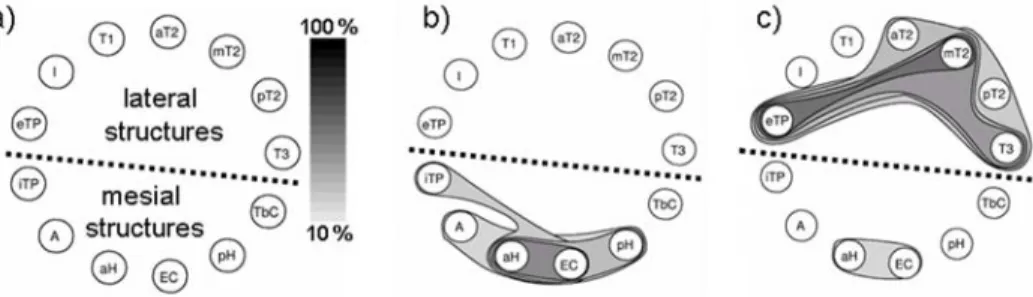
In order to give an idea, for a 1-hour interictal recording selected in each of the fifteen patients, the number of multi-IIS was found to vary from 492 to 7600 (mean± SD, 3322 ± 2190) and fifty seven SCAS were automatically extracted for all patients. Figure 3 illustrates the type of result generated by the method. In this figure, the SCAS are represented in the same schematic way: cerebral structures are positioned along a circle (bottom: mesial temporal lobe, top: lateral temporal lobe) and extracted SCAS are represented using closed contour lines. Surfaces delineated by contours are colored using a grey scale that indicates the SCAS occurrence fre-quency (figure 3 -a). Results obtained from the visual inspection of SCAS in the fifteen cases showed that patients may be divided into two groups depending on the involvement of lateral structures of the temporal lobe. In the first subgroup of patients (8 out of 15) the networks generating epileptic spikes remain limited to the mesial structures of the temporal lobe (figure 3 -b). Therefore, a good spatial correspondence with the epileptogenic zone (defined as the site of primary orga-nization of the ictal discharge) was observed. Conversely, in a second subgroup patients (7 out of 15), the networks generating epileptic spikes extend far beyond the mesial structures as most lateral neocortical structures were found to be in-volved in extracted SCAS (figure 3 -c). Moreover, in all patients, at least one SCAS was localized in the mesial part of the temporal lobe with a significant incidence of the subset formed by the anterior hippocampus and entorhinal cortex. This result is consistent with respect to available data about hippocampal pathways (axons of the perforant path - major input to the hippocampus - arise principally in layers II and III of the entorhinal cortex which is, in return, an output from the hippocam-pus). Among mesial structures, the temporobasal cortex and the internal part of the temporal pole were found to belong to SCAS identified in the mesial temporal lobe as well as SCAS identified in the lateral temporal lobe. This “pivotal role” can mainly be interpreted by the anatomy of the temporal region as these structures are connected to both the limbic system and the lateral neocortex.
To end with, the whole method provides spatial information about mesial and/or lateral structures that are more likely to be conjointly involved in the generation of interictal spikes and allows for categorization of patients with respect to this infor-mation. This may be the first step towards better understanding of the relationship that may exist between networks involved in interictal activity and networks in-volved in seizure activity and therefore towards enhanced use of interictal activity for diagnosis.
(b) Identification of subsets of structures involved in ictal activity (i) Research context and problem statement
In human partial epilepsies, the identification of neuronal networks that are in-volved in the genesis and in the propagation of seizures is the main issue. Indeed, accurate localization and determination of these epileptogenic networks (that may extend over distant brain structures) is the pre-requisite for defining the subse-quent therapeutic strategy, precisely aimed at suppressing seizures by annihilation of epileptogenic networks. The question of identifying such networks in the brain is closely related to the question of characterizing ’abnormal’ functional couplings
Figure 3. Examples of results obtained from the method illustrated in figure 2. a) Recorded brain structures are placed over a circle for graphical representation. The method was ap-plied in 15 patients with mesial TLE. Results showed that in a first subgroup of patients (8 out of 15), the networks generating epileptic spikes remain limited to the mesial structures of the temporal lobe. In the second subgroup (7 out of 15), the networks generating epilep-tic spikes extend far beyond the mesial structures as most lateral neocorepilep-tical structures can also be involved in extracted subsets. b) and c) Examples of automatically-identi-fied SCAS in both cases. Abbreviations: A=amygdala; aH=anterior hippocampus; EC= entorhinal cortex; pH=posterior hippocampus; TbC=temporobasal cortex; iTP=internal temporal pole; T3=middle part of inferior temporal gyrus; pT2=posterior part of middle temporal gyrus; mT2=middle part of middle temporal gyrus; aT2=anterior part of middle temporal gyrus; T1=superior temporal gyrus; I=insula; eTP=external temporal pole.
among neuronal ensembles possibly distributed over distant areas. Tackled ques-tions relate to the characterization of interconnecques-tions between structures during the transition from preictal activity to ictal activity: are some structures function-ally connected? Can abnormal couplings be identified? How do couplings evolve during the interictal to ictal transition and during the time course of seizures? Do some structures play a leading role in the seizure generation process?
Such questions can be approached using signal processing techniques applied on electrophysiological signals recorded from these ensembles. As far as depth-EEG signals (that are local field potentials as recorded by macroscopic intracerebral elec-trodes) are concerned, numerous studies have been dedicated to the development and/or to the use of methods aimed at quantifying the functional coupling between recorded sites.
Formally, the two questions that are addressed can be stated as follows. Given two field signalsX(t) and Y (t), respectively recorded from two groups of neurons and GX and GY, 1) how can we quantify, from X(t) and Y (t), the functional coupling (in the wide sense) betweenGX andGY? And 2) how can we estimate, by signal processing, which of the four following situations is the most likely to occur:
GX is leadingGY,GY leadingGX,GX andGY mutually influence each other, and finallyGX andGY are independent?
To solve these issues, proposed methods all rely on the same main assump-tion: the functional coupling between two neuronal ensembles can be quantified by measuring the statistical relationship between the two signals, each signal arising from one neuronal ensemble. In the literature, various terms are used to denote this statistical relationship, such as the “degree of coupling”, the “degree of asso-ciation”, the “synchronization” or the “interdependency” between signals, among
others. Proposed methods can be divided into two categories depending on the as-sumptions regarding the relationship between signals. Linear methods include the linear cross-correlation or the coherence function. They were proposed and used to study functional couplings between brain regions during cognitive tasks or dur-ing epileptic seizures. In this field, pioneer works were initiated by Brazier et al. (Brazier, 1972) who made use of the coherence function to study the propagation of epileptic activity from intracerebral recordings. They were followed by Gotman (Gotman, 1987) who studied interhemispheric relationships in partial seizures and by Duckrow et al. (Duckrow & Spencer, 1992) and Franaszczuk et al. (Franaszczuk & Bergey, 1999) who analyzed synchronization mechanisms occurring at the on-set of seizures. Besides these linear methods, the potential usefulness of nonlinear techniques in the field of EEG was also studied from the early 80’s. A first fam-ily of methods based on mutual information (Mars & Lopes Da Silva, 1983) or on nonlinear regression (Pijn & Lopes Da Silva, 1993; Wendling et al., 2001) was first introduced. A second family then developed based on methods coming from nonlinear physics (nonlinear dynamical systems) and chaos theory (Iasemidis et al., 1990; Lehnertz, 1999).
(ii) Method: nonlinear regression analysis
Nonlinear regression analysis is a non parametric method aimed at evaluating the dependency of random process (a time-series signalY recorded from GY, for instance) on another process (signalX recorded from GX, for instance) from sam-ples only (no data model) and independently of the type of relation between the two processes. This method was first used in the field of EEG analysis by Pijn and colleages (Pijn, 1990; Pijn et al., 1992) who showed that it performed better than methods based on linear regression or mutual information for analyzing the inter-dependences between intracerebral EEG signals (experimental model of generalized epilepsy). An evaluation of this method was then performed based on realistic sim-ulation of EEG signals generated by coupled popsim-ulations of neurons (Wendling et al., 2000). We showed that this method can be applied to human intracerebral EEG data for characterizing seizure patterns (Wendling et al., 2001). In particular, we used it to study ictal processes in patients with TLE. Results led to the proposition of a new classification of seizures based on the early involvement of medial and/or lateral structures of the temporal lobe (Bartolomei et al., 2001).
Nonlinear regression analysis is a bivariate method that measures the degree of association between two variables. This measure is often referred to as the “non-linear correlation coefficienth2”, by analogy with the well-known linear correlation coefficientr2. Formally, the nonlinear correlation coefficient h2 is computed from the signalsX(t) and Y (t), by considering that the amplitude y of signal Y (t + τ) is a perturbed function of the amplitudex of signal X(t) (i.e. equal to the conditional mean ofY (t + τ) given X(t) = x). The variance of the perturbation corresponds to the conditional variance ofY (t + τ) (i.e. the residual variance on Y (t + τ) after prediction of y values from x values). In pratice, this conditional variance can be estimated from a piecewise linear regression curveY (t + τ) = h(X(t)).
h2(τ) = 1 − V AR[Y (t + τ)/X(t)]
where
V AR[Y (t + τ)/X(t)] ˆ= argmin
h E[Y (t + τ) − h(X(t))]
2) (3.2)
The computation ofh2(τ) is reiterated for different values of the time shift τ between
X(t) and Y (t + τ), leading to the time shift τ∗, or time delay, for whichh2(τ) is
maximum:
h2= max τmin<τ<τmax[h
2(τ)] = h2(τ∗) (3.3)
h2 is the non linear correlation coefficient. Its values are comprised between 0 (X
and Y are independent) and 1 (Y is determined by X). The main advantage of nonlinear regression is that it does not require any assumption of the nature (linear or nonlinear) of the relationship between the two signals, bringing a solution to a common pitfall of linear regression. Another interesting property of the nonlinear correlation coefficienth2is that is asymmetrical: theh2value, when computed from signalX to signal Y , differs from the value computed from signal Y to signal X. This information was shown to be useful for characterizing the causality between signals (Arnhold et al., 1999). Following this idea, a “direction index” (namedD) was proposed by (Wendling et al., 2001). It makes uses of both this asymmetry information and the time delay information to provide an indication about which of the two signals is most likely driving the other one. More recently, rigorous studies confirmed the usefulness ofh2 parameter for quantifying statistical relationships between random signals (Kalitzin et al., 2007).
(iii) Results
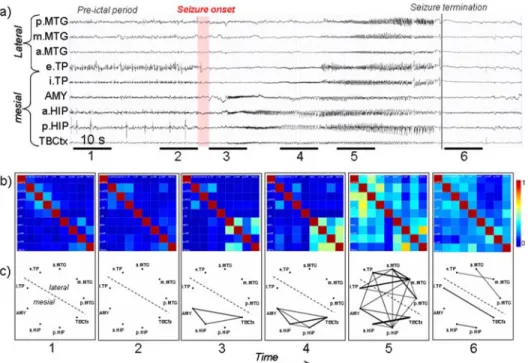
An example of results obtained with nonlinear regression analysis in TLE is illustrated in figure 4. Analyzed EEG signals (figure 4 - a) were recorded from intracerebral electrodes positioned in medial (amygdala, hippocampus, temporo-basal cortex, internal part of the temporal pole) and in lateral (external temporal pole, middle temporal gyrus from anterior to posterior part) during the transition from preictal activity to seizure activity. h2 values were computed pair wise (81 possible pairs for the 9 signals recorded from 9 structures in the temporal lobe) and averaged over 6 periods of 10 seconds each (2 pre-ictal, 3 per-ictal and 1 post-ictal). They were then represented in two complementary ways: color-coded nonlinear correlation matrices (figure 4 - b) and graphs (figure 4 - c) in which the nodes correspond to brains structures and in which the links are proportional toh2values (i.e. thick line denote highh2and is interpreted as strong coupling between consid-ered structures). In nonlinear correlation matrices, all information is represented. In the graphs, only significantly-highh2values (i.e. greater than averageh2values computed over the interictal period +2 standard deviations) are displayed. One can see that dramatic modifications ofh2 values (interpreted as couplings between structures) occur during the transition from “normal” background activity to ictal activity. In particular, a strong increase ofh2values is observed just after the onset of the seizure marked by the appearance of fast oscillations in the limbic system (amygdala, hippocampus, temporo-basal cortex) (figure 4 - b, period 3). As the seizure develops (figure 4 - b, period 4 and 5), the spread of ictal activity is charac-terized byh2 values which become higher, not only among signals from the limbic system but also between signals from the limbic system and signals from lateral
neocortical structures. Detailed inspection of correlation matrices also reveals the possible strong asymmetry of the nonlinear correlation coefficient. For instance,h2 value computed from e.TP to p.MTG over period 5 is higher than that computed in the opposite way. This denotes the possible propagation of the seizure from the external temporal pole (e.TP) to the posterior middle temporal gyrus (p.MTG) which is plausible from the anatomo-functional point of view.
Figure 4. Characterization of epileptogenic networks in the temporal lobe during the tran-sition from preictal to seizure activity. a) Intracerebral EEG recoding performed in a patient with mesial TLE. b) Color-coded nonlinear correlation matrices obtained from the pair-wise computation of nonlinear correlation coefficienth2 over 6 different ten-sec-ond intervals chosen during the pre-ictal period (1, 2), the ictal period (3, 4, 5) and after seizure termination (6). c) Graphical representation in which the lines indicate “ab-normally strong” couplings between the two considered structures (graph nodes). Only significantly high interdependencies are represented (i.e.h2 values greater than 0.32. This value corresponds to the averageh2value computed over the interictal period +2 standard deviations). Line thickness is proportional toh2 values.
(iv) Discussion
This example shows the usefulness of methods aimed at characterizing the in-teractions between structures before and during seizures. However, the nonlinear regression analysis is not the only method that can provide such information and the user is often confronted to the delicate situation where several methods can be used and where discrepancies can be observed in the results provided by these methods. Recently, two important issues were debated in this context: i) whether
or not nonlinear methods perform better than linear ones and ii) whether or not frequency-dependent methods should be preferred, as some epileptic phenomena may occur in a restricted frequency domain. Regarding this second point, one should notice that the frequency of EEG signals has long been considered as a key param-eter that directly relate to the oscillatory behavior of recorded brain systems. As mentioned, nonlinear methods have the capability to account for the nonlinearity of relationship. However, the fact that most the existing ones are generally inde-pendent from frequency or at most related to large frequency sub-bands can be considered as a limitation. Conversely, linear methods can not provide information about the possibly nonlinear nature of the relationship but they can easily account for the signal frequency with a good resolution. The best example is probably the coherence function defined as the cross-spectral density normalized by the power spectral densities of the two signals. Indeed, linear coherence-based methods have been widely used in the field of EEG analysis. However, as underlined in (Zaveri et al., 1999), the coherence function is estimated, in practice, from the Fast Fourier Transform (periodogram method) and proposed estimators are generally character-ized by strong bias and variance which make the interpretation of results difficult, especially when the correlation between signals is weak. This problem was addressed by defining frequency bands. For instance, classical delta, theta, alpha, beta and gamma EEG bands were used to average the coherence function (Razoumnikova, 2000) or to filter signals before computation of the cross-correlation (Nikolaev et al., 2001; Wendling et al., 2003). However, this is again not entirely satisfactory as the choice of frequency bands is critical (some important phenomena may be neglected if are bridging two user-defined sub-bands). Some of these difficulties are addressed in (Ansari-Asl et al., 2005). The authors proposed a novel estimator for characterizing the evolution of linear relationship between signals both in the time-frequency domain. This estimator, denoted byr2(t, f), is based on the computation of the Pearson Product-Moment correlation between EEG signals filtered in nar-row and overlapping frequency bands (a continuous filter bank is used). Briefly, this estimator has two advantages: i) no assumption on frequency bands is required and ii) although it asymptotically behaves like the classical coherence estimator, it was shown to perform better in terms of bias and variance under certain conditions about frequency dependent time delay values between signals.
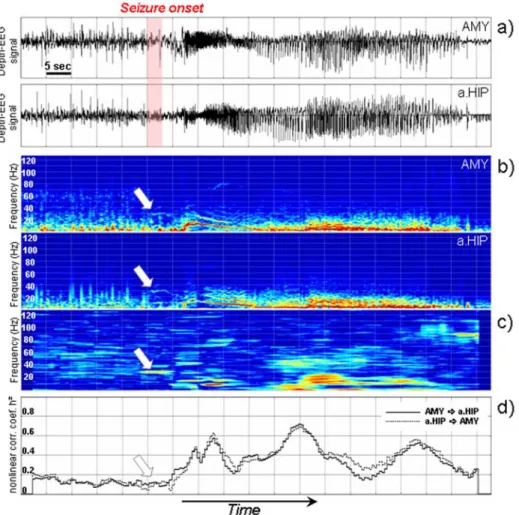
An example is provided in figure 5 which shows two depth-EEG signals respec-tively recorded from the amygdala and the anterior hippocampus during the transi-tion to seizure in a patient with TLE (figure 5 -a). Both signals are nonstatransi-tionary as depicted in figure 5 -b which provides respective spectrograms. Typically, at seizure onset, a high frequency activity (fast oscillations around 30 Hz) is observed in the brain structures involved in the seizure process (arrows on the spectrograms). The time-frequency characterization of the relationship between the two signals using ther2(t, f) estimator is illustrated in figure 4 -c. It reveals that a strong relation-ship exists between the narrow-band activities generated by the two structures and previously observed on spectrograms (around 30 Hz, see arrow). Such “hypersyn-chronization” would be very difficult to detect visually. Moreover, this phenomenon is not revealed by the frequency-independent nonlinear regression analysis method, as illustrated in figure 5 -d. Indeed, any method that globally performs an averag-ing over the frequency domain can be “blind” to synchronization processes highly localized in frequency. Therefore, this example shows the usefulness of
frequency-dependent methods able to track the evolution of the relationship between signals in the time-frequency plane with a good resolution.
Figure 5. Results obtained on real data. a) Depth-EEG signals recorded from amygdala (AMY) and hippocampus (HIP) in human during transition to seizure activity in tem-poral lobe epilepsy. b) Spectrograms corresponding to depth-EEG signals obtained from short-term Fourier transform. c) Estimated relationship between the two signals in the time-frequency plane using ther2(t, f) method (frequency-dependent). The method re-veals a synchronization process well localized in frequency at seizure onset. d) Estimated relationship between the two signals using theh2(t) nonlinear regression analysis method (frequency-independant). The method is not sensitive to the narrow-band synchronization process at seizure onset.
4. Conclusions
Among electrophysiological investigation methods, electroencephalography still oc-cupies an important place as it allows for studying brain activity in general, and epileptic processes in particular, with appropriate time resolution.
Epilepsy is a complex dynamical disease (Lopes da Silva et al., 2003). The term “epilepsy” refers to a wide variety of neurological syndromes and disorders. In this panorama, partial epilepsies in which seizures start in a relatively circumscribed area of the brain represent 60% of the cases. In this paper, we focused on pharmaco-resistant partial epilepsies which are considered as severe forms of epilepsy (since significant reduction of the frequency of seizures can not be obtained with drugs) and in which surgery may be indicated.
Scalp-EEG or depth-EEG signals recorded in patients with drug-resistant par-tial epilepsy convey important information about epileptogenic networks that must be localized and understood prior to any therapeutic procedure. However, this in-formation, often subtle, is “hidden” into the signals. It is precisely the role of signal processing to reveal this information and put it into a “coherent and interpretable picture” that can participate to the elaboration of the decision about which part of the network should be operated on in order to suppress seizures (i.e. the therapeutic strategy).
The methods presented in this paper apply to intracerebral EEG. We think that progress must still be accomplished in the analysis of scalp EEG recorded in patients with partial epilepsy. This modality has the enormous advantage of being non invasive. However, it only allows for a global recording of the brain activity, conversely to intracerebral EEG in which electrodes implanted in brain structures record local field potentials. Therefore, the problem of identifying epileptogenic networks from scalp recordings is highly complex in a context where signals are also largely contaminated by patient-related artefacts (like muscular activity due to the movements of the patient during seizures). Among recent advances in quantified scalp EEG analysis, one can mention the use of blind source separation techniques for removal of ocular artefacts and noise (see (James & Hesse, 2005) for a review on the use of independent component analysis for biomedical signals and (Kachenoura et al., 2008) for performance comparisons of ICA methods or the use of nonlinear regression for the lateralization of seizures in TLE (Caparos et al., 2006).
Finally, presented and quoted methods belong to a more general approach, often referred to as data-driven processing. They provide quantities which participate in the description of the observations and subsequently in the decision that can be taken from EEG signals. We think that such a descriptive approach can be valu-ably complemented by a model-driven processing aimed at providing clues about the pathophysiological mechanisms involved into the generation of signals. In the field of epilepsy, several studies already showed that neurophysiologically-relevant computational models can be used to interpret quantities provided by signal pro-cessing methods. For instance, it was shown that models of coupled populations of neurons can be used to explain the time-course of interdependencies between depth-EEG signals during partial seizures (Wendling et al., 2001). Following the same idea, the statistics of occurrence of absence seizures could be explained by the bi-stable property of a model of the thalamo-cortical loop (Suffczynski et al., 2005). More generally, the development of computational models is rapidly
grow-ing as there is also a need for integratgrow-ing and structurgrow-ing the tremendous amount of data that is continually accumulating in epilepsy research at both clinical and experimental level (Suffczynski et al., 2006, Chakravarthy et al. 2007).
5. References
Agrawal, R. & Srikant, R. 1994 Fast Algorithms for Mining Association Rules. Proc. of the 20th Int’l Conference on Very Large Databases, Santiago, Chile, 487.
Alarcon, G., Garcia Seoane, J. J., Binnie, C. D., Martin Miguel, M. C., Juler, J., Polkey, C. E., Elwes, R. D. & Ortiz Blasco, J. M. 1997 Origin and propagation of interictal dis-charges in the acute electrocorticogram. Implications for pathophysiology and surgical treatment of temporal lobe epilepsy. Brain 120 ( Pt 12), 2259-82.
Alarcon, G., Guy, C. N., Binnie, C. D., Walker, S. R., Elwes, R. D. & Polkey, C. E. 1994 Intracerebral propagation of interictal activity in partial epilepsy: implications for source localisation. J Neurol Neurosurg Psychiatry 57, 435-49.
Ansari-Asl, K., Bellanger, J. J., Bartolomei, F., Wendling, F. & Senhadji, L. 2005 Time-frequency characterization of interdependencies in nonstationary signals: application to epileptic EEG. IEEE Trans Biomed Eng 52, 1218-26.
Arnhold, J., Grassberger, P., Lenhertz, K. & Elger, C. 1999 A robust method for detecting interdependences: application to intracranially recorded EEG. Physica D 134, 419-430. Asano, E., Muzik, O., Shah, A., Juhasz, C., Chugani, D. C., Sood, S., Janisse, J., Ergun, E. L., Ahn-Ewing, J., Shen, C., Gotman, J. & Chugani, H. T. 2003 Quantitative interictal subdural EEG analyses in children with neocortical epilepsy. Epilepsia 44, 425-34. Avoli, M. & Barbarosie, M. 1999 Interictal-ictal interactions and limbic seizure generation.
Rev Neurol (Paris) 155, 468-71.
Badier, J. & Chauvel, P. 1995 Spatio-temporal characteristics of paroxysmal interictal events in human temporal lobe epilepsy. J Physiol(Paris) 89, 255-264.
Bancaud, J. & Talairach, J. 1973 [Methodology of stereo EEG exploration and surgical intervention in epilepsy]. Rev Otoneuroophtalmol 45, 315-28.
Barth, D. S., Sutherling, W., Engle, J., Jr. & Beatty, J. 1984 Neuromagnetic evidence of spatially distributed sources underlying epileptiform spikes in the human brain. Science 223, 293-6.
Bartolomei, F., Wendling, F., Bellanger, J. J., Regis, J. & Chauvel, P. 2001 Neural net-works involving the medial temporal structures in temporal lobe epilepsy. Clin Neuro-physiol 112, 1746-60.
Basseville, M. & Nikiforov, I. 1993 Detection of Abrupt Changes:Theory and Application. Information and system science series. Englewood Cliffs, N.J: Prentice-Hall, Inc. Bourien, J., Bartolomei, F., Bellanger, J. J., Gavaret, M., Chauvel, P. & Wendling, F. 2005
A method to identify reproducible subsets of co-activated structures during interictal spikes. Application to intracerebral EEG in temporal lobe epilepsy. Clin Neurophysiol 116, 443-55.
Bourien, J., Bellanger, J. J., Bartolomei, F., Chauvel, P. & Wendling, F. 2004 Mining reproducible activation patterns in epileptic intracerebral EEG signals: application to interictal activity. IEEE Trans Biomed Eng 51, 304-15.
Bragin, A., Wilson, C. L. & Engel, J., Jr. 2000 Chronic epileptogenesis requires devel-opment of a network of pathologically interconnected neuron clusters: a hypothesis. Epilepsia 41 Suppl 6, S144-52.
Brazier, M. A. 1972 Spread of seizure discharges in epilepsy: anatomical and electrophys-iological considerations. Exp Neurol 36, 263-72.
Briellmann, R. S., Jackson, G. D., Pell, G. S., Mitchell, L. A. & Abbott, D. F. 2004 Structural abnormalities remote from the seizure focus: a study using T2 relaxometry at 3 T. Neurology 63, 2303-8.
Brown, M. W., 3rd, Porter, B. E., Dlugos, D. J., Keating, J., Gardner, A. B., Storm, P. B., Jr. & Marsh, E. D. 2007 Comparison of novel computer detectors and human performance for spike detection in intracranial EEG. Clin Neurophysiol 118, 1744-52. Caparos, M., Louis-Dorr, V., Wendling, F., Maillard, L. & Wolf, D. 2006 Automatic
later-alization of temporal lobe epilepsy based on scalp EEG. Clin Neurophysiol 117, 2414-23. Chakravarthy N., Sabesan S. , Iasemidis L.D. & Tsakalis K. 2007 Modeling and controlling synchronization in a neuron-level population model. Int. J. Neural Systems 17, 123-138. Chatrian, G., Bergamini, L., Dondey, M., Klass, D., Lennox-Buctal, M. & Petersen, I. 1974 A glossary of terms most commonly used by clinical electroencephalographers. Electroencephalogr Clin Neurophysiol, 538-48.
Chauvel, P., Buser, P., Badier, J. M., Liegeois-Chauvel, C., Marquis, P. & Bancaud, J. 1987 [The “epileptogenic zone” in humans: representation of intercritical events by spatio-temporal maps]. Rev Neurol (Paris) 143, 443-50.
Creutzfeldt, O. D., Bodenstein, G. & Barlow, J. S. 1985 Computerized EEG pattern classification by adaptive segmentation and probability density function classification. Clinical evaluation. Electroencephalogr Clin Neurophysiol 60, 373-93.
Duckrow, R. & Spencer, S. 1992 Regional coherence and the transfer of ictal activity during seizure onset in the medial temporal lobe. Electroencephalography and Clinical Neurophysiology 82, 415-422.
Dumpelmann, M. & Elger, C. E. 1999 Visual and automatic investigation of epileptiform spikes in intracranial EEG recordings. Epilepsia 40, 275-85.
Ebersole, J. S. & Hawes-Ebersole, S. 2007 Clinical application of dipole models in the localization of epileptiform activity. J Clin Neurophysiol 24, 120-9.
Franaszczuk, P. J. & Bergey, G. K. 1999 An autoregressive method for the measurement of synchronization of interictal and ictal EEG signals. Biol Cybern 81, 3-9.
Gotman, J. 1987 Interhemispheric interactions in seizures of focal onset: data from human intracranial recordings. Electroenceph. Clin. Neurophysiol 67, 120-133.
Gotman, J. 1999 Automatic detection of seizures and spikes. J Clin Neurophysiol 16, 130-40.
Gotman, J. & Wang, L. Y. 1992 State dependent spike detection: validation. Electroen-cephalogr Clin Neurophysiol 83, 12-8.
Gourevitch, B., Bouquin-Jeannes, R. L. & Faucon, G. 2006 Linear and nonlinear causality between signals: methods, examples and neurophysiological applications. Biol Cybern 95, 349-69.
Hufnagel, A., Dumpelmann, M., Zentner, J., Schijns, O. & Elger, C. E. 2000 Clinical relevance of quantified intracranial interictal spike activity in presurgical evaluation of epilepsy. Epilepsia 41, 467-78.
Iasemidis, L. D., Sackellares, J. C., Zaveri, H. P. & Williams, W. J. 1990 Phase space topography and the Lyapunov exponent of electrocorticograms in partial seizures. Brain Topogr 2, 187-201.
Iasemidis, L.D. 2003 Epileptic seizure prediction and control. IEEE Trans Biomed Eng, 50, 549-558.
James, C. J. & Hesse, C. W. 2005 Independent component analysis for biomedical signals. Physiol Meas 26, R15-39.
Kachenoura, A., Albera, L., Senhadji, L. & Comon, P. 2008 ICA: A Potential Tool for BCI Systems. IEEE Signal Processing Magazine 25, 57-68.
Kalitzin, S. N., Parra, J., Velis, D. N. & Lopes da Silva, F. H. 2007 Quantification of unidi-rectional nonlinear associations between multidimensional signals. IEEE Trans Biomed Eng 54, 454-61.
Lehnertz, K. 1999 Non-linear time series analysis of intracranial EEG recordings in patients with epilepsy–an overview. Int J Psychophysiol 34, 45-52.
Lehnertz, K., Widman, G., Andrzejak, R., Arnhold, J. & Elger, C. E. 1999 Is it possible to anticipate seizure onset by non-linear analysis of intracerebral EEG in human partial epilepsies? Rev Neurol (Paris) 155, 454-6.
Lopes da Silva, F. 2002 Electrical potentials. Encyclopedia of the human brain, V.S. Ramachandran, Ed., New York vol. 2, 147-67.
Lopes da Silva, F., Blanes, W., Kalitzin, S. N., Parra, J., Suffczynski, P. & Velis, D. N. 2003 Epilepsies as dynamical diseases of brain systems: basic models of the transition between normal and epileptic activity. Epilepsia 44 Suppl 12, 72-83.
Mannila, H., Toivonen, H. & Verkamo, A. 1994 Efficient algorithms for discovering as-sociation rules. AAAI Workshop on Knowledge Discovery in Databases (KDD-94), ed. UMFaR Uthurusamy, Seattle: AAAI Press, 181.
Mars, N. & Lopes da Silva, F. 1983 Propagation of seizure activity in kindled dogs. Elec-troencephalography and Clinical Neurophysiology 56, 194-209.
Michel, C. M., Murray, M. M., Lantz, G., Gonzalez, S., Spinelli, L. & Grave de Peralta, R. 2004 EEG source imaging. Clin Neurophysiol 115, 2195-222.
Nikolaev, A. R., Ivanitsky, G. A., Ivanitsky, A. M., Posner, M. I. & Abdullaev, Y. G. 2001 Correlation of brain rhythms between frontal and left temporal (Wernicke’s) cortical areas during verbal thinking. Neurosci Lett 298, 107-10.
Penfield, W. & Jasper, H. 1954 Epilepsy and the functional anatomy of the human brain. Boston: Little Brown & Co.
Pijn, J. 1990 Quantitative evaluation of EEG signals in epilepsy, nonlinear associa-tions,time delays and nonlinear dynamics, PhD Thesis. Amsterdam:University of Am-sterdam.
Pijn, J. & Lopes Da Silva, F. 1993 Propagation of electrical activity: nonlinear associations and time delays between EEG signals. In Basic Mechanisms of the EEG (ed. Zschocke & Speckmann). Boston: Birkauser.
Pijn, J., Veli, s., DN & Lopes da Silva, F. 1992 Measurement of interhemispheric time differences in generalised spike-and-wave. Electroencephalogr Clin Neurophysiol 83, 169-71.
Prilipko, L., M de Boer, H., Dua, T. & Bertolote, J. 2006 Epilepsy Care -The WHO/ILAE/IBE Global Campaign Against Epilepsy. US Neurological Disease, 39-40. Rampp, S. & Stefan, H. 2006 Fast activity as a surrogate marker of epileptic network
function? Clin Neurophysiol 117, 2111-7.
Razoumnikova, O. M. 2000 Functional organization of different brain areas during con-vergent and dicon-vergent thinking: an EEG investigation. Brain Res Cogn Brain Res 10, 11-8.
Senhadji, L., Bellanger, J. J. & Carrault, G. 1997 EEG Spike detectors based on different decompositions : a comparative study. In Time Frequency and Wavelets in Biomedical Signal Processing (ed. M. Akay), pp. 407-421. New York: IEEE Press.
Senhadji, L., Dillenseger, J. L., Wendling, F., Rocha, C. & Kinie, A. 1995 Wavelet analysis of EEG for three-dimensional mapping of epileptic events. Ann Biomed Eng 23, 543-52. Senhadji, L. & Wendling, F. 2002 Epileptic transient detection: wavelets and
time-frequency approaches. Neurophysiol Clin 32, 175-92.
Stam, C. J., Nolte, G. & Daffertshofer, A. 2007 Phase lag index: assessment of functional connectivity from multi channel EEG and MEG with diminished bias from common sources. Hum Brain Mapp 28, 1178-93.
Stefan, H., Schneider, S., Abraham-Fuchs, K., Bauer, J., Feistel, H., Pawlik, G., Neubauer, U., Rohrlein, G. & Huk, W. J. 1990 Magnetic source localization in focal epilepsy. Mul-tichannel magnetoencephalography correlated with magnetic resonance brain imaging. Brain 113 ( Pt 5), 1347-59.
Suffczynski, P., Lopes da Silva, F., Parra, J., Velis, D. & Kalitzin, S. 2005 Epileptic transitions: model predictions and experimental validation. J Clin Neurophysiol 22, 288-99.
Suffczynski, P., Wendling, F., Bellanger, J. & Lopes Da Silva, F. 2006 Some insights into computational models of (Patho)physiological brain activity. Proceedings of the IEEE 94, 784- 804.
Talairach, J. & Bancaud, J. 1966 Lesion, “irritative” zone and epileptogenic focus. Confin Neurol 27, 91-4.
Tzallas, A. T., Oikonomou, V. P. & Fotiadis, D. I. 2006 Epileptic spike detection using a kalman filter based approach. Conf Proc IEEE Eng Med Biol Soc 1, 501-4.
Uhlhaas, P. J. & Singer, W. 2006 Neural synchrony in brain disorders: relevance for cog-nitive dysfunctions and pathophysiology. Neuron 52, 155-68.
Wendling, F., Badier, J., Chauvel, P. & Coatrieux, J. 1997 A method to quantify invariant information in depth-recorded epileptic seizures. Electroenceph Clin Neurophysiol 102, 472-485.
Wendling, F., Bartolomei, F., Bellanger, J. J., Bourien, J. & Chauvel, P. 2003 Epileptic fast intracerebral EEG activity: evidence for spatial decorrelation at seizure onset.Brain 126, 1449-59.
Wendling, F., Bartolomei, F., Bellanger, J. J. & Chauvel, P. 2001 Interpretation of inter-dependencies in epileptic signals using a macroscopic physiological model of the EEG. Clin Neurophysiol 112, 1201-18.
Wendling, F., Bellanger, J. J., Bartolomei, F. & Chauvel, P. 2000 Relevance of nonlinear lumped-parameter models in the analysis of depth-EEG epileptic signals.Biol Cybern 83, 367-78.
Zaveri, H., Williams, W., Sackellares, J., Beydoun, A., Duckrow, R. & Spencer, S. 1999 Measuring the coherence of intracranial electroencephalograms.Clin Neurophysiol 110, 1717-25.