Feasibility of integrated CT-liver perfusion
in routine FDG-PET/CT
Patrick Veit-Haibach,
1Valerie Treyer,
1Klaus Strobel,
1Jan D. Soyka,
1Lars Husmann,
1Niklaus G. Schaefer,
1,2Alois Tschopp,
3Thomas F. Hany
11
Department of Medical Radiology, Division of Nuclear Medicine, University Hospital Zuerich, Raemistrasse 100, 8091 Zuerich, Switzerland
2
Department of Medical Oncology, University Hospital Zuerich, Zuerich, Switzerland
3
Department of Biostatistics, University Hospital Zuerich, Zuerich, Switzerland
Abstract
Objective: To integrate CT-perfusion into a routine, clinical contrast-enhanced (ce) PET/CT protocol for the evaluation of liver metastases and to compare functional CT and PET parameters.
Materials and methods: Forty-six consecutive patients (mean age: 60 (34–82) years; 20 f, 26 m) with known liver lesions (colorectal metastases (n = 34), primary liver cancer (n = 4), breast cancer (n = 3), anal cancer, gastric cancer, esophageal cancer, GIST, duodenal cancer (all: n= 1) who were referred for staging or therapy follow-up by [18F]-Fluoro-2-deoxy-D-glucose-positron-emission-tomography/computed-tomography imaging (FDG-PET/ CT) were included. After acquisition of a low-dose PET/ CT, a split-injection (70–90 mL) ce-CT-protocol, including a 35-s CT-perfusion scan of the liver and a diagnostic ce-CT of the thorax and/or abdomen (70 s delay, iv-contrast volume: 90 mL, 4 mL/s) was performed. CT-perfusion parameters (BF, BV, MTT,) and semi-quantitative PET-parameters (SUVmax, SUVmean, TLG, PETvol) were analyzed and compared.
Results: CT-perfusion data could be obtained in all but one patient with shallow breathing. In all patients, diagnostic ce-PET/CT quality was adequate without the use of additional contrast media. Significant correlations (P < 0.05) were found for each of BF, BV, MTT, and SUVmax, further, BF and MTT correlated with TLG. Several other correlations were seen for other perfusion and PET-parameters.
Conclusion: Combined CT-perfusion/PET/CT-protocol without the use of additional contrast media is feasible and can be easily integrated in clinical routine. Perfusion
parameters and PET-parameters are only partly correlat-ing and therefore have to be investigated further at fixed time points during the course of disease and therapy. Key words: PET/CT—CT-perfusion—Liver
metastases—PET/CT-perfusion—Oncological imaging
Computed-tomography perfusion (CT-perfusion) is a robust, non-invasive technique, which has been primarily invented for brain perfusion and now has found its way also into perfusion of different tumors of the body [1–6]. It uses the enhancement pattern of contrast media over time to determine different perfusion parameters, which already provided effective measurements in humans and animal experiments for evaluation of tumor angiogenesis and antivascular chemotherapy [3, 4, 7–10]. To date, it has been only partly integrated in a clinical routine and perfusion results are still under investigation concerning their clinical impact. However, based on the increasing availability of multi-slice scanner and easy-to-use soft-ware for perfusion evaluation, there is increasing interest in such perfusion data.
[18F]-Fluoro-2-deoxy-D-glucose-positron-emission-tomography/computed-tomography imaging (FDG-PET/CT) on the other side is currently one of the most used oncological staging and therapy follow-up tech-niques and is worldwide used and reimbursed for a wide variety of cancers [11–15]. It overcomes the classical limitation of a single-entity approach and serves as a valuable tool in clinical routine for therapy decision [16]. However, FDG—by far the most commonly used tracer in oncological PET/CT-imaging—provides information about viability of the cell but no information about
Correspondence to:Patrick Veit-Haibach; email: [email protected]
CT-perfusion into a routine, clinical, intravenous con-trast-enhanced PET/CT protocol (ce-PET/CT) for the evaluation of liver metastases; second: to compare and to correlate CT-perfusion parameters (BF, blood volume (BV), and mean transit time (MTT)) and semi-quanti-tative PET-parameters (SUVmax, SUVmean, tumor lesion glycolysis (TLG) volume of the lesion (PETvol)) in our patient population.
Materials and methods
Patients
The study population consisted of 46 consecutively in-cluded patients (mean age: 60 years; range: 34–82 years; 20 female, 26 male) with known or highly suspected liver lesions who were referred for staging or therapy follow-up by FDG-PET/CT. No further selection was applied to the patient population. Thirty-four patients had a history of a colon/rectal cancer. In this subgroup, 18 patients were pre-therapeutic and 16 patients had chemotherapy within the last 2 month (post-therapy). Nine of those patients received standard chemotherapy (FOLFOX, FOLFIRI), seven patients received additional antivas-cular therapy (Bevacizumab/Cetuximab). Another four patients had a history of a primary liver cancer, three patients had metastases of a breast cancer, five patients had different singular cancers (one anal cancer, one gastric cancer, one esophageal cancer, one gastro-intes-tinal stromal tumor, and one duodenal carcinoma). On average, the patients had 3.8 metastases (range: 1–12 metastases), the mean size was 2.7 cm (range: 1.5–7 cm). None of the patients suffered from a known abdom-inal inflammatory disease. In all patients, the primary tumor was histologically verified, in the majority of cases, at least one of the liver lesions was histologically verified, also. The study was performed in accordance with the regulations of the local institutional review board and ethics committee. Written, informed consent was obtained from all patients before the examination and enrollment into the study.
Integrated FDG-PET/CT imaging
All data were acquired on a combined PET/CT in-line system (Discovery VCT, GE Healthcare, Milwaukee, WI, USA). These dedicated systems integrate a last-generation, full-ring PET scanner with a multislice helical 64-slice-CT scanner and permit the acquisition of co-registered CT and PET images in one imaging pro-cedure. The patients were instructed to fast for 4 h prior to the examination. PET/CT-imaging with integrated CT-perfusion was started 60 min after the injection of a
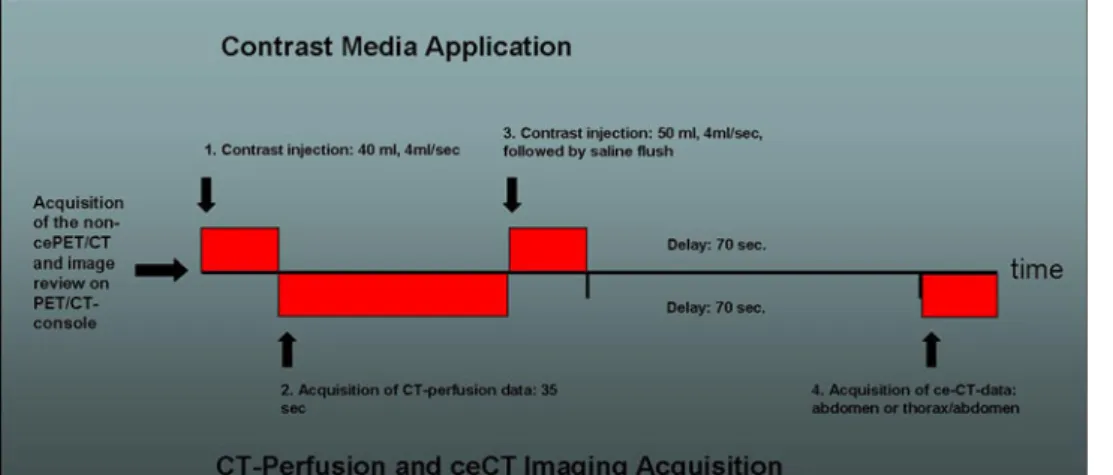
Schering Pharma, Berlin, Germany diluted with 970 mL water) was administered during the uptake period. Patients were examined in supine position. All patients received a non-enhanced CT scan, which was acquired with the following parameters: 80 mA, 140 kV, 0.5 s tube rotation, 4.25-mm section thickness. The CT scans were acquired during shallow breathing in the head and neck area, the thorax, and the lower abdomen and dur-ing non-forced expiration in the upper abdomen. The scan included the area from the head to the upper thighs. Directly after the CT-acquisition, the PET-emission scan was acquired with an acquisition time of 2 min per bed position. The patient stayed in the same supine position on the PET/CT table during the whole procedure. Immediately after the non-ce-PET/CT, the images were reviewed directly on the scanner console and the largest target liver lesion was defined based on the focal glucose metabolism on the PET-images or anatomical changes seen in the low dose CT of the metastases (43 patients, mean SUVmax:18.1). In cases the lesion had no or only as much FDG-avidity as the surrounding liver tissue (e.g., post-therapeutic patients), the non-contrast CT-images were reviewed carefully for the largest target lesion as already demonstrated in other studies (three patients, mean SUVmax: 2.0) [3]. Then, the intravenous contrast injection was started by injecting a total dose of 90 mL contrast media (Ultravist 370, Bayer Schering Pharma, Germany); the first part: for the CT-perfusion, the second part for completion of routine ce-CT for fusion with the PET-data. Ninety milliliter contrast media represents the standard dose for imaging of the abdomen in standard ce-CT and ce-PET/CT in our department. First, 40 mL of contrast media (Ultravist 370, Bayer Schering Pharma, Germany) with a flow of 4 mL/s was applied via a cubital vein for 10 s with an automated power injector (Vistron, Medrad, Indianola, PA) at the above determined position in the region of the liver. This represents the default protocol as suggested by the vendor. After a 5-s delay, the perfusion data were acquired for 35 s in the area of interest (1 s rotations time, cine duration 35 s, 8 slices, 5-mm slice thickness, 80 mA, 80 kV). Breathing was not suspended, but the patients were instructed prior to the scan to breath very shallowly to minimize respiratory excurses as already proposed in other studies, which investigated breathing-sensitive abdominal lesions [17]. By this technique, an anatomical cranio-caudal coverage of 4 cm was achieved for the perfusion scan of the liver target lesion. Directly after the perfusion-scan, a second bolus of another 50 mL of contrast media (Ultravist 370, Bayer Schering Pharma, Germany) was applied, again with 4 mL/s followed by a saline flush of 30 mL. After a delay of 70 s
(portal-venous phase), the routine ce-CT (120 kV, dose modulated tube current up to 700 mA, 2.5 mm, pitch 1.375:1, 13.75 mm/rotation speed) was applied breath hold (Fig.1). Total data acquisition time for the whole procedure ranged between 18–22 min. The initially acquired non-enhanced low-dose CT-data (4.25-mm slices) was used for attenuation correction, and images were reconstructed by using a standard fully 3 D-iterative algorithm (ordered subset expectation maximization). For image co-registration and analysis, all reconstructed images (non-enhanced CT, ce-CT, CT-perfusion images) were then transferred to a commercially available workstation (Advantage Workstation, 4.4, GE Healt-care, Milwaukee, WI, USA), where image data can be evaluated in all three planes as a single procedures and in a co-registered mode. Also CT-perfusion data were evaluated on the same platform using a commercially available perfusion software, which uses the deconvolu-tion method to calculate the perfusion values. (CT-Per-fusion 3, Body-Protocol, see also image evaluation below).
Image evaluation
CT-perfusion evaluation. CT-perfusion data were evalu-ated by one dual-board certified nuclear medicine phy-sician/radiologist using the default body-protocol of the commercially available CT-perfusion software as above mentioned. A threshold of 20–400 HU was defined for soft tissue visualization. The arterial input was defined by a circular ROI of 40 mm2 size in the aorta, which was displayed within the perfusion volume. The consecutive time enhancement curve and the parametric imaging maps for BF (mL/100 mg tissue/min), BV (mL/100 mg tissue), and MTT (s) were automatically calculated by the software. The permeability surface was not calculated in this study because the study protocol is too short for adequate permeability calculation.
A freehand ROI defined by the margin of the target liver metastases was placed in every slice of the perfusion
volume (4-cm detector coverage, 5-mm slice thickness). A second ROI (when possible, equally sized and shaped as the ROI, which was used for the liver metastases evalu-ation, otherwise: standard 250 mm2ROI) was positioned the non-diseased liver parenchyma (normal liver paren-chyma) in every slice, too. The 250 mm2ROI was used in cases when there was not enough space for an equally sized and shaped as the ROI, for example in the lower parts of liver segment six or at the edges of the liver.
CT-perfusion data of the non-diseased liver paren-chyma and CT-perfusion data of the liver metastases were calculated in every slice. Mean values for all per-fusion data (liver metastases and non-diseased (normal) liver parenchyma) were calculated and compared to evaluate the differences in perfusion behavior between metastases and non-diseased liver parynchema. Fur-thermore, the CT-perfusion data of the pre-therapeutic subgroup were compared versus the post-therapeutic subgroup (see ‘‘Patients’’ section above).The total effec-tive radiation dose was estimated for CT (DLP 9 0.017 mSv/cGy/cm) as previously suggested [18].
PET-data evaluation. PET-data were evaluated by one dual-board certified nuclear medicine physician/radiolo-gist. A cubic volume of interest (VOI) was placed over the target liver metastases in the PET-images. The VOI automatically calculated the Standard Uptake Value (SUVmax, SUVmean), TLG as well as the volume of the lesion (PETvol) based on a defined PET-threshold. The PET-threshold was chosen based to the non-diseased liver tissue. All evaluated PET-values were correlated with the CT-perfusion data of the liver metastases to demonstrate possible correlations or interactions. CT-data evaluation. To evaluate and to demonstrate the clinical adequacy of the divided contrast media protocol for routine clinical PET/CT-evaluation, mea-surements (Hounsfield Units) of the aorta, the portal vein, one liver vein, and a standard 250 mm2ROI in the
Fig. 1. The course of the examination protocol. The non-enhanced PET/CT is acquired first. After review of the images, the position of the target lesion was defined and the perfusion volume was adjusted
accordingly. Directly after the acquisition of the perfusion data, the routine ce-CT was
Statistical analysis
To demonstrate the differences between the liver lesion and the surrounding, non-diseased (normal) liver parenchyma the two-sided paired t-test was used. A P-value of 0.05 was considered significant. Differences of means, standard error of differences of means as well as 95% confidence intervals were calculated, too.
Generally, for relatively small samples, we always cross check results of parametric significance tests with more robust non-parametric tests and therefore, two tests were used for all perfusion parameters. The signif-icant results, which are reported arised from paired t-tests. The Wilcoxon signed rank test produced analo-gous results and, thus, under such circumstances it makes sense to report t-test results because these are in-line with means of differences and its confidence intervals, which are presented too. Thus, no Wilcoxon’s signed rank test results are presented. The correlation between all CT-perfusion data and all evaluated PET-data were calculated using Spearman’s rho, a non-parametric rank correlation coefficient. However, this was not done be-cause the variables were not normally distributed, but it means that we wanted to relax the normality assumption. Last, to demonstrate differences in CT-perfusion and/or PET-data between pre- and post-therapeutic patients, the Mann–Whitney test was used.
Statistical analyses were performed with SPSS statis-tical software (Version 16.0.1, SPSS Inc, Chicago, IL).
Results
Feasibility and image quality of the combined
CT-perfusion-PET/CT-protocol
Patients were included between May 2007 and June 2008. All 46 patients tolerated the PET/CT-procedure with integrated CT-perfusion well. Whole-body non-ce-PET/ CT data as well as clinical ce-PET/CT could be evaluated for routine clinical staging in all 46 patients. CT-perfusion
obtained in one single imaging procedure (Table1, Fig.2).
Based on the fixed CT-parameters for the acquisition of the perfusion data, the total effective radiation dose was 5 mSv in all patients.
CT-perfusion evaluation
Perfusion data could be obtained in 45 patients (98%). In one patient, perfusion data of the metastases could not be evaluated due to breathing artefacts (highly volatile breathing during the perfusion data acquisition). Table2
demonstrates the perfusion values of the liver metastases versus the perfusion values of the normal liver tissue.
A statistically significant difference was found when comparing the BF (difference of mean: 18.2, P < 0.001, standard error of difference of mean: 3.6, 95% CI: 10.9–25.5) and MTT (difference of mean: -5.7, P < 0.001, standard error of difference of mean: 0.7, 95% CI: -7.2 to -4.3) of the liver metastases versus normal liver parenchyma.
Overall correlation of CT-perfusion data
and PET-data
All perfusion data (BF, BV, MTT) were correlated with all acquired PET-parameter (SUVmax, SUVmean, TLG and PETvol). Statistically significant relations could be demonstrated for BF and SUVmax (Spearman’s rho: 0.54, P < 0.001), for BF and SUVmean (Spearman’s rho: 0.41, P = 0.005), and for BF and TLG (Spearman’s rho: 0.35, P = 0.02) (Fig.3). Statistically significant inverse relations could be also demonstrated for MTT and SUVmax (Spearman’s rho: -0.40, P = 0.006), for MTT and PETvol (Spearman’s rho: -0.34, P = 0.02), and MTT and TLG (Spearman’s rho: -0.37, P = 0.02). Finally, statistically significant correlations were found for BV and SUVmax (Spearman’s rho: 0.38, P = 0.01) and for BV and SUVmean (Spearman’s rho: 0.33, P= 0.03).
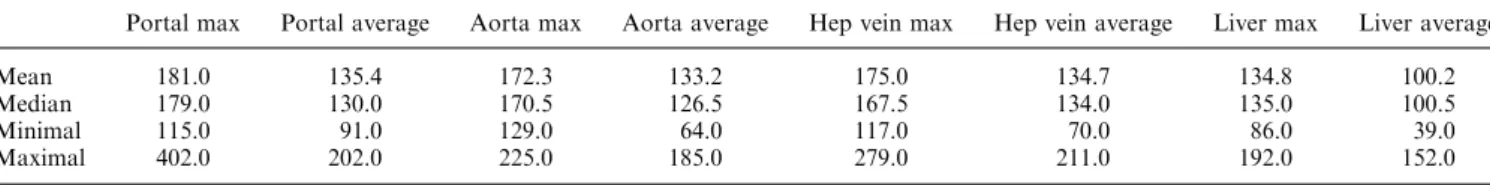
Table 1. The measured Hounsfield units (HU) in different vessels and the liver parenchyma to demonstrate adequacy of the integrated contrast protocol. Hounsfield units are displayed as mean, median, as well as the maximal and the minimal HU (range)
Portal max Portal average Aorta max Aorta average Hep vein max Hep vein average Liver max Liver average Mean 181.0 135.4 172.3 133.2 175.0 134.7 134.8 100.2 Median 179.0 130.0 170.5 126.5 167.5 134.0 135.0 100.5 Minimal 115.0 91.0 129.0 64.0 117.0 70.0 86.0 39.0 Maximal 402.0 202.0 225.0 185.0 279.0 211.0 192.0 152.0 Portal max/average, maximal and average HU measured in the portal vein
Aorta max/average, maximal and average HU measured in the aorta
Hep vein max/average, maximal and average HU measured in one hepatic vein
Comparison of pre-therapeutic versus
post-therapeutic patients (subgroup)
Table3demonstrates the CT-perfusion values as well as the PET-data of patients with pre-therapeutic liver metastases (n = 18) and patients with post-therapeutic liver metastases (n = 15, non-evaluable in one patient). Statistically significant differences could be demonstrated when comparing pre- and post-therapeutic MTT (P < 0.05) while none of the PET-data showed any sta-tistically significant difference.
Discussion
Our study demonstrates the feasibility of an integrated CT-perfusion protocol into a ce-PET/CT examination without use of additional contrast compared to a stan-dard ce-PET/CTin a clinical routine environment. The combined protocol proved to be robust as the clinical cePET/CT could be evaluated in all patients and all cePET/CT’s demonstrated adequate image quality. Per-fusion data could be evaluated in all but one patient. First clinical experiences when comparing CT-perfusion data and PET-data are showing partial correlations be-tween CT- and PET-parameters.
General considerations
Several issues have to be addressed when implementing a CT-perfusion protocol into a whole-body FDG-PET/ CT-protocol. Such a new imaging concept should, ide-ally, provide additional useful parameters at equal or only minimally higher procedure complexity at the same image quality. The non-ce-PET/CT images had to be reviewed prior to the contrast administration at the PET/ CT-console to define the position for the perfusion scan, which took on average 2 min. Thus, the in-room-time of our protocol was only slightly longer than for standard PET/CT-procedures. However, it is definitively less time-consuming than a multi-step approach where the clinical ce-PET/CT is performed first and the patient has to be examined twice because CT-perfusion is still considered a research examination.
Thus, such a protocol may represent a psychological and physical advantage when considering the burden set upon the patient by different imaging procedure but providing at the same time dedicated research data for further evaluation. Overall, there are only minor work-flow challenges to be solved, because the physician has to be available at the scanner console to define the position of the target lesion. Since the physician has to be at the scanner for the contrast-media application in our insti-tution anyway, there is only additional physician time required concerning the acquisition of the perfusion.
Regarding the additional radiation dose introduced by the perfusion part, an addition of 5 mSv for the CT-perfusion part might be an acceptable additional dose to 18–22 mSv for the entire ce-PET/CT protocol in an oncological patient population [19].
Specific technical considerations
Most of the available CT-perfusion studies were con-ducted with a 2-cm field-of-view (FOV) and thus, resulting perfusion data are only give a relatively small insight into the tumor’s perfusion behavior [1,17,19,20].
Fig. 2. The image quality of the divided contrast protocol in ce-CT (A) and ce-PET/CT (B). The aorta and portal vein (white double-arrow) as well as liver parenchyma and small
liver vessels (transparent gray arrow) show adequate image quality. New metastases at the resection site after hemihep-atectomy (lateral white arrow).
Table 2. The mean perfusion values of the malignant liver lesion compared to the non-diseased liver parenchyma
Mean N Standard deviation Standard error mean CTL-BF 37.8 45 26.5 3.9 CTN-BF 19.6 45 14.2 2.1 CTL-MTT 13.2 45 4.0 0.6 CTN_MTT 18.9 45 5.2 0.8 CTL-BV 4.6 45 1.7 0.3 CTN-BV 4.6 45 2.3 0.3 Significant differences were noted between BF and liver parenchyma as well as MTT and liver parenchyma
CTL-BF/MTT/BV/, perfusion parameters of the malignant lesion CTN-BF/MTT/BV/, perfusion parameters of the non-diseased liver parenchyma
N= evaluated patient number (overall 46 patients, one drop-out as described in the ‘‘results’’ section
As our PET/CT scanner provides a 4-cm detector range (64-slice CT-scanner), our perfusion data might give a larger insight into the perfusion behavior and the mean perfusion parameter might reflect more stable values. Recently, introduced scanner techniques like the 320-slice CT scanner and scanners with ‘‘shuttle-mode’’ are probably able to overcome the limitation of a small FOV. However, they are expected to increase radiation, too, and are not yet available in a combined PET/CT scanner. Although Meijerink et al. already introduced a protocol to cover the whole liver with a 64-slice scanner, this protocol significantly increased the radiation dose up to 24 mSv just for the perfusion scan and is therefore adding significant radiation to the patient [21]. Addi-tionally, the presented total liver perfusion protocol was found to be time-consuming, and in 14/20 cases, the time–density curves were considered unacceptable to
calculate the perfusion maps and had therefore to undergo compensation image fusion and registration.
We did not suspend breathing for several reasons. First, to maximize patients’ comfort. However, the patients were instructed prior to the scan to breathe very shallowly to minimize respiratory excurses. Other studies have already used such an approach in other breathing-sensitive and movement-breathing-sensitive abdominal lesions, too [17]. Furthermore, breathing protocols have been already recommended earlier as clinically adequate when used in conjunction with PET-acquisitions [22]. Finally, in an initial trial phase, we experienced that a significant number of our oncological, and therefore physically limited, patients could not hold the breath long enough for the perfusion scan and that in this case, we had much more breathing artefacts by the end of the perfusion scan due to overcompensating wheezing. Overall, it is
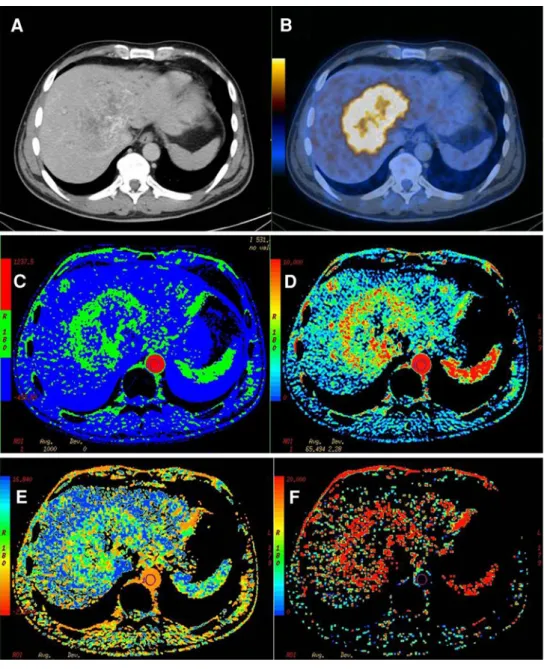
Fig. 3. Fifty y/o male patient with history of a colorectal cancer and hepatic metastases 1 week after chemotherapy. The ce-CT (A) shows partly necrotic areas in this large liver
metastases, the corresponding PET/CT (B) shows high FDG-avidity in the peripheral vital and centrally necrotic metastases. Corresponding parametric perfusion images shows the metastases of the patient as blood flow (C) and blood volume image (D). E and F showing the corresponding images for mean transit time and permeability surface. The metastases of this patient showed a high FDG-avidity (SUVmax: 11.5) and high perfusion values (BF: 47.4 mL/ 100 g tissue/min, BV: 6.2 mL/ 100 g tissue, MTT: 11.4 s, PS: 20.8 mL/100 g tissue/min). SUVmax/mean, PETvol/TLG: PET-data of the liver lesions.
certainly controversial how much more accurate a breathhold approach might be, especially considering that there are no studies available comparing both ap-proaches with an accepted gold-standard (e.g., flow-cytometry).
No significant differences in image quality could be detected when comparing our contrast protocol (first injection for the perfusion, second injection for comple-tion for the diagnostic cePET/CT) and the HU given in the current literature [23]. Most of the other studies used a single injection to conduct the perfusion study and a potential consecutive diagnostic scan [1, 4, 17]. The rationale to use a divided protocol in our study was to use the default protocol (40 mL at 4 mL/s) as recom-mended by the vendor, to acquire a clinically adequate CT-component within the PET/CT for evaluation of other distant metastases and to have a combined perfu-sion PET/CT in one step without significant disruption of the clinical routine.
Specific considerations concerning comparison
of perfusion and PET-data
To date, several body-perfusion studies have been per-formed for different tumor entities, but most of them have been conducted for lung cancer patients and expe-rience with CT-perfusion of the liver is limited [3, 20]. There are recent studies, which also integrated CT-per-fusion into PET/CT, however, in different body com-partments [2,5,6].
In the study of Miles and co-workers, no general correlation (only for small tumors) between tumor size and SUV and SPV (standardized perfusion value) was found, while in our study a statistically significant cor-relation between the tumor volume (PETvol) and BF and
MTT was detected. In another study by Groves et al. in patients with primary breast cancer, a correlation between SUV and perfusion values normalized to cardiac output was found, whereas no correlation between SUV and tumor perfusion or permeability was found [24].
However, there are major differences to be consid-ered. Our correlation is based on a larger patient popu-lation with different malignant liver lesions, whereas Miles and co-workers and Groves and co-workers eval-uated smaller patient populations with NSCLC and breast cancer and thus, making a reasonable comparison almost impossible. In a recent study in head and neck cancers, differences between tumor and normal surrounding tissue could be demonstrated [5].
The two studies that evaluated (partly) liver lesions also found significant differences between the perfusion values of liver lesions and the normal liver parenchyma [3,20]. However, as demonstrated in other tumor enti-ties, we could not detect significant differences of BV and the liver lesions and the surrounding parenchyma [1]. One reason for the non-significant differences in BVs might be the different sizes of the measured ROI’s. Whenever possible, the ROI measuring the normal liver parenchyma had the same size and shape as the ‘‘tumor ROI’’. However, this was not possible in all slices of the perfused volume, for example, in the basal parts of liver segment six or the edges of the liver. Sabir et al. and several other authors demonstrated that perfusion parameters (BF and MTT) are showing the closest cor-relation with laser-flowmetry, histopathology, and clini-cal outcome and therefore, those seem to represent the most reliable parameter [25–27].
Interestingly, highest correlations were detected between BF and MTT and SUVmax. This might be due to the fact, that cells, which are supplied best by BF, are able to have a high metabolism. Both parameters also correlate with the TLG, a combined ‘‘metabolic-volu-metric’’ parameter, which is considered to represent a more accurate tumor burden [28–30]. One explanation for this could be that a high tumor volume (one part of the TLG) of viable tumor cells (SUV, second part of the TLG) requires a higher flow. However, this remains to be proven since there is no explanation available in the current literature and no other comparison with micro-vessel density or flowmetry and TLG has been conducted so far.
There was only a significant difference between pre-and post-therapy MTT detectable in our patient popu-lation. Values, e.g., for BF and PETvol were different, too, but showed higher standard deviations, which might be the reason that they did not achieved significant dif-ference levels. We do not have pre- and post-therapy comparisons in the same patients, patients had further-more different chemotherapy schemes and thus, those results have to be interpreted with caution. However, they might give an indication that perfusion parameters
Table 3. The comparison of the mean values of perfusion values and PET-data in the subgroup of patients with colorectal carcinoma
Therapy Mean Standard deviation Standard error mean CTL-BF Post 40.3 26.6 6.9 Pre 28.8 10.8 2.6 CTL-MTT Post 12.5 3.8 1.0 Pre 15.0 3.2 0.8 CTL-BV Post 4.2 1.5 0.4 Pre 4.7 1.6 0.4 SUVmax Post 6.0 2.7 0.7 Pre 7.0 4.3 1.0 SUVmean Post 3.5 1.1 0.3 Pre 4.0 1.6 0.4 PET-vol Post 157.3 371.9 99.4 Pre 46.7 93.9 22.1 PET-TLG Post 5.3E5 1.1E6 3.01E5
Pre 2.2E5 4.8E5 1.1E5 Significant differences were detected between pre-and post MTT Therapy, pre/post: mean values of the perfusion values and PET-data pre-therapy and post-therapy
Controversials/limitations
Several issues are discussed controversially in the current literature. Although we already used a 4-cm FOV for the perfusion, we still do not have a full tumor coverage in all tumors—which would be desirable. Other perfusion pro-tocols have been already introduced but have their draw-backs, too (see above). Another topic is the shape of the ROI for perfusion measurement. Goh et al. [17] found that a ROI outlining the tumor is the currently most appro-priate method to provide consistent measurements within a study. Hence, measurements from the edge, the center, and the entire tumor volume would add more accuracy in perfusion measurements but are time consuming and are adding additional complexity. Since there is no software-based auto-detection yet available, we chose the outlining approach. We did not have histopathological verification of every liver lesion, however, this is not possible and ethically not justifiable in a routine clinical setting. The breathing approach in our study might be controversially, too (see above). However, since other studies already used a breathing approach in a breathing sensitive area, too, such a protocol might be considered adequate in a clinical routine setting. There is currently no consensus in which way and how much integrated PET/CT-perfusion might contribute to therapeutic decisions in clinical routine. Hence, larger prospective studies are needed to define the role of perfusion parameters in therapeutic management. However, the here presented results might serve as a pri-mer for further investigations.
Conclusion
This is a feasibility report on successful technical inte-gration of a combined CT-perfusion/PET/CT-protocol without the use of additional contrast media compared to a standard ce-PET/CT. Several questions concerning the partial correlations between perfusion parameters and PET-data remain open and have to be investigated in further studies. Overall, the evaluated protocol might expand the insight and understanding in tumor physiol-ogy with acceptable additional radiation burden to the patient but providing important additional research information in one step.
Acknowledgments.we would like to thank Sabine Knoefel, RT, for her great contribution to this study.
References
1. Bellomi M, Petralia G, Sonzogni A, Zampino MG, Rocca A (2007) CT perfusion for the monitoring of neoadjuvant chemotherapy and radiation therapy in rectal carcinoma: initial experience. Radiology 244:486–493
3. Sahani DV, Holalkere NS, Mueller PR, Zhu AX (2007) Advanced hepatocellular carcinoma: CT perfusion of liver and tumor tissue– initial experience. Radiology 243:736–743
4. Sahani DV, Kalva SP, Hamberg LM, et al. (2005) Assessing tumor perfusion and treatment response in rectal cancer with multisection CT: initial observations. Radiology 234:785–792
5. Bisdas S, Spicer K, Rumboldt Z (2008) Whole-tumor perfusion CT parameters and glucose metabolism measurements in head and neck squamous cell carcinomas: a pilot study using combined positron-emission tomography/CT imaging. Ajnr 29:1376–1381 6. Groves AM, Wishart GC, Shastry M, et al. (2009) Metabolic-flow
relationships in primary breast cancer: feasibility of combined PET/ dynamic contrast-enhanced CT. Eur J Nucl Med Mol Imaging 36(3):416–421
7. Thomas JP, Arzoomanian RZ, Alberti D, et al. (2003) Phase I pharmacokinetic and pharmacodynamic study of recombinant human endostatin in patients with advanced solid tumors. J Clin Oncol 21:223–231
8. Wang JH, Min PQ, Wang PJ, et al. (2006) Dynamic CT evaluation of tumor vascularity in renal cell carcinoma. AJR Am J Roentgenol 186:1423–1430
9. Willett CG, Boucher Y, di Tomaso E, et al. (2004) Direct evidence that the VEGF-specific antibody bevacizumab has antivascular effects in human rectal cancer. Nat Med 10:145–147
10. Yi CA, Lee KS, Kim EA, et al. (2004) Solitary pulmonary nodules: dynamic enhanced multi-detector row CT study and comparison with vascular endothelial growth factor and microvessel density. Radiology 233:191–199
11. Schoder H, Carlson DL, Kraus DH, et al. (2006) 18F-FDG PET/ CT for detecting nodal metastases in patients with oral cancer staged N0 by clinical examination and CT/MRI. J Nucl Med 47:755–762
12. Schoder H, Larson SM, Yeung HW (2004) PET/CT in oncology: integration into clinical management of lymphoma, melanoma, and gastrointestinal malignancies. J Nucl Med 45(Suppl 1):72S–81S 13. Strobel K, Dummer R, Husarik DB, et al. (2007) High-risk
mela-noma: accuracy of FDG PET/CT with added CT morphologic information for detection of metastases. Radiology 244:566–574 14. Valk PE, Abella-Columna E, Haseman MK, et al. (1999)
Whole-body PET imaging with [18F]fluorodeoxyglucose in management of recurrent colorectal cancer. Arch Surg 134:503–511. doi:10.1001/ archsurg.134.5.503
15. Veit-Haibach P, Kuehle CA, Beyer T, et al. (2006) Whole-body PET/CT-colonography: diagnostic accuracy of a new staging con-cept in patients with colorectal cancer. JAMA 296(21):2590–2600 16. Hillner BE, Siegel BA, Liu D, et al. (2008) Impact of positron
emission tomography/computed tomography and positron emis-sion tomography (PET) alone on expected management of patients with cancer: initial results from the national oncologic PET regis-try. J Clin Oncol 26:2155–2161
17. Goh V, Halligan S, Gharpuray A, et al. (2008) Quantitative assessment of colorectal cancer tumor vascular parameters by using perfusion CT: influence of tumor region of interest. Radiology 247:726–732
18. Einstein AJ, Moser KW, Thompson RC, Cerqueira MD, Henzlova MJ (2007) Radiation dose to patients from cardiac diagnostic imaging. Circulation 116:1290–1305
19. Kiessling F, Boese J, Corvinus C, et al. (2004) Perfusion CT in patients with advanced bronchial carcinomas: a novel chance for characterization and treatment monitoring? Eur Radiol 14:1226– 1233
20. Meijerink MR, van Cruijsen H, Hoekman K, et al. (2007) The use of perfusion CT for the evaluation of therapy combining AZD2171 with gefitinib in cancer patients. Eur Radiol 17:1700–1713 21. Meijerink MR, van Waesberghe JH, van der Weide L, et al. (2008)
Total-liver-volume perfusion CT using 3-D image fusion to im-prove detection and characterization of liver metastases. Eur Radiol 18:2345–2354
22. Miles KA (2003) Perfusion CT for the assessment of tumour vas-cularity: which protocol? Br J Radiol 76(spec no 1):S36–S42 23. Chung YE, Kim KW, Kim JH, et al. (2006) Optimal delay time for
the hepatic parenchymal enhancement at the multidetector CT examination. J Comput Assist Tomogr 30:182–188
24. Groves AM, Wishart GC, Shastry M, et al. (2009) Metabolic-flow relationships in primary breast cancer: feasibility of combined PET/ dynamic contrast-enhanced CT. Eur J Nucl Med Mol imaging 36:416–421. doi:110.1007/s00259-008-0948-1
25. Hermans R, Lambin P, Van der Goten A, et al. (1999) Tumoural perfusion as measured by dynamic computed tomography in head and neck carcinoma. Radiother Oncol 53:105–111
26. Kan Z, Phongkitkarun S, Kobayashi S, et al. (2005) Functional CT for quantifying tumor perfusion in antiangiogenic therapy in a rat model. Radiology 237:151–158
27. Sabir A, Schor-Bardach R, Wilcox CJ, et al. (2008) Perfusion MDCT enables early detection of therapeutic response to antian-giogenic therapy. AJR Am J Roentgenol 191:133–139
28. Akhurst T, Ng VV, Larson SM, et al. (2000) Tumor burden assessment with positron emission tomography with. Clin Positron Imaging. 3:57–65
29. Francis RJ, Byrne MJ, van der Schaaf AA, et al. (2007) Early prediction of response to chemotherapy and survival in malignant pleural mesothelioma using a novel semiautomated 3-dimensional volume-based analysis of serial 18F-FDG PET scans. J Nucl Med 48:1449–1458
30. Steinert HC, Santos Dellea MM, Burger C, Stahel R (2005) Therapy response evaluation in malignant pleural mesothelioma with integrated PET-CT imaging. Lung Cancer 49(Suppl 1):S33– S35