Brassica Plant Responses to Mild Herbivore Stress Elicited
by Two Specialist Insects from Different Feeding Guilds
P. Sotelo&E. Pérez&A. Najar-Rodriguez&A. Walter&S. Dorn
Received: 20 September 2013 / Revised: 10 December 2013 / Accepted: 19 January 2014 / Published online: 7 February 2014 # Springer Science+Business Media New York 2014
Abstract Compensation growth and chemical defense are two components of plant defense strategy against herbivores. In this study, compensation growth and the response of pri-mary and secondary metabolites were investigated in Brassica rapa plants subjected to infestation by two herbivores from contrasting feeding guilds, the phloem-feeding aphid Brevicoryne brassicae and the leaf-feeding caterpillar Pieris brassicae. These specialist herbivores were used at two dif-ferent densities and allowed to feed for seven days on a young caged leaf. Changes in growth rates were assessed for total leaf area and bulb mass, whereas changes in primary and secondary metabolites were evaluated in young and mature leaves, roots, and bulbs. Mild stress by caterpillars on young plants enhanced mean bulb mass and elicited a contrasting regulation of aliphatic and indolic glucosinolates in the leaves. In contrast, mild stress by aphids enhanced leaf growth and increased glucosinolate concentrations in the bulb, the most important storage organ of B. rapa. A similar mild stress by either herbivore to older plants did not alter plant growth parameters or concentrations of the metabolites analyzed. In conclusion, Brassica plant growth was either maintained or enhanced under mild herbivore stress, and defense patterns differed strongly in response to herbivore type and plant development stage. These results have implications for the understanding of plasticity in plant defenses against
herbivores and for the management of Brassica rapa in agroecosystems.
Keywords Pieris brassicae . Brevicoryne brassicae . Plant compensation . Plant defense . Carbohydrates .
Glucosinolates . Brassica rapa
Introduction
Severe stress by insect herbivores can lead to detrimental losses in tissues of the attacked plant, whereas mild stress inflicted by a relatively low herbivore density might allow the plant to effectively counteract the losses (Maschinski and Whithman1989; Schmidt et al.2009; Zvereva and Kozlov
2012). Attacked plants might invest in compensation growth (Strauss and Agrawal1999), along with re-allocation of pri-mary metabolites (Schwachtje et al. 2006; Schwachtje and Baldwin2008), or in chemical defense (Karban2011; Textor and Gershenzon 2009). Responses are species-specific, and they can continue or even increase in the period following disappearance of the herbivore (Gutbrodt et al.2011b; Kaplan et al. 2008). To allow compensatory growth after transient herbivory events, the plant might transfer primary metabolites preferentially to storage organs located above- or below-ground including bulbs, tubers, or roots (Schwachtje et al.
2006; Schwachtje and Baldwin 2008). For example, upon damage by grasshoppers to maize plants (Holland et al.
1996) or white buffalo grass ecotypes (Dyer et al. 1991), carbon is allocated preferentially to the roots. An herbivore-elicited increase in primary metabolism, in combination with allocation of the new primary metabolites to tubers, has been postulated as the dominant mechanism underlying an increase in tuber production after potato plants were subject to leaf herbivory by the Guatemalan potato moth Tecia solanivora (Poveda et al.2010).
Electronic supplementary material The online version of this article (doi:10.1007/s10886-014-0386-4) contains supplementary material, which is available to authorized users.
P. Sotelo
:
A. Najar-Rodriguez:
S. DornInstitute of Agricultural Sciences, Applied Entomology, ETH Zurich, Schmelzbergstrasse 9/LFO, 8092 Zurich, Switzerland
E. Pérez
:
A. Walter (*)Institute of Agricultural Sciences, Crop Sciences, ETH Zurich, Universitätstrasse 2/LFW, 8092 Zurich, Switzerland
Plant regrowth in combination with defense strategies also has been documented in response to insect herbivory. When attacked by the nicotine-adapted Manduca larvae, wild tobac-co plants tune their repertoire of induced defenses for maximal effectiveness, but also begin to allocate recently fixed carbon into their roots. Once in the roots, the carbon can be used to sustain seed production at the end of the plant’s life, after the Manduca larvae have pupated (Kessler and Baldwin2004; Voelckel and Baldwin2004). The evolutionary advantages accruing to plants with combined induced defense and re-growth compensatory abilities are clear. Knowledge of the mechanisms resulting in induced defense and compensatory growth is increasing rapidly, but our ability to predict the levels of plant response that will occur in any given plant system upon herbivory is still relatively poor (War et al.2012). Furthermore, how such plant responses can be manipulated from the perspective of human exploitation of agroecosystems is not yet clearly understood.
Most plants face damage by multiple insect herbivore species, which in most cases feed differentially on the plants (Agrawal1998; Delaney and Macedo2001). However, evi-dence for differential patterns of plant response according to the insect-feeding mode (i.e., feeding guild) is scarce. Recent-ly, the responses of cotton plants to two insect herbivores from different guilds, the leaf-feeding Spodoptera littoralis and the piercing-sucking two-spotted spider mite Tetranychus urticae, were documented (Schmidt et al. 2009). After short-term caterpillar feeding, leaf growth and water content were de-creased in damaged leaves. The glutamate/glutamine ratio increased, and other free amino acids also were affected. In contrast, spider mite infestation did not affect leaf growth or amino acid composition, but led to an increase in total nitro-gen and sucrose concentrations. Differences in glucosinolate accumulation by Arabidopsis thaliana plants in response to our herbivores, the phloem-feeding Myzus persicae and B. brassicae aphids and the leaf-feeding Spodoptera exigua and Pieris rapae also were recently documented (Mewis et al. 2006). Whereas herbivory by M. persicae, B. brassicae, and S. exigua led to increased aliphatic glucosinolate contents, herbivory by P. rapae did not alter aliphatic glucosinolate content, but led to slight increases in indole glucosinolates. Thus, how plants adjust their growth and defense strategies in response to herbivore feeding mode warrants further investigation.
Brassica species are excellent models for investigating the evolution of herbivore defenses due to their particular chem-ical constitution of secondary plant metabolites, specifchem-ically glucosinolate compounds, also known as mustard oil gluco-sides (reviewed by Hopkins et al.2009). These compounds derive from amino acids, and three major groups are recog-nized: indol glucosinolates derived from tryptophan, aliphatic glucosinolates derived from methionine, and aromatic gluco-sinolates derived from phenylalanine or tyrosine (Hopkins
et al. 2009; Kiddle et al.2001). Glucosinolates themselves show little biological activity (Winde and Wittstock 2011). However, upon hydrolysis by myrosinases, they are trans-formed to bioactive products responsible for toxicity and deterrence, such as isothiocyanates, thiocyanates, nitriles and epithionitriles (Hopkins et al. 2009; Winde and Wittstock
2011). Like many other defense metabolites, glucosinolates are present constitutively in plants, but also are inducible following herbivore damage or simulated damage. The amounts induced vary depending on the organ, developmental stage, and genotype (Textor and Gershenzon 2009 and references therein). Glucosinolates can act as toxicants, deter-rents, and/or plant resistance compounds against generalist herbivores (Agrawal1998; Gutbrodt et al.2011a). However, some specialist insects are able to overcome the deleterious effects of glucosinolates and have evolved behavioral mech-anisms to use such compounds as oviposition cues and/or as feeding attractants or phagostimulants (Renwick and Lopez
1999; Renwick2002; Klaiber et al. 2013). Many specialist insects have physiological mechanisms to detoxify, sequester, and even use these compounds (Ferreres et al.2007,2008). In case of attack by these specialists, it would be beneficial for plants to respond by rapid regrowth or compensation rather than by overproduction of glucosinolates.
In this study we used the system comprised of B. rapa and two Brassica specialist insect herbivores, the cabbage white Pieris brassicae caterpillar, a chewing leaf-feeder, and the cabbage aphid Brevicoryne brassicae, a sucking phloem-feeder. We evaluated how B. rapa plants respond to mild herbivore stress inflicted by these insects from contrasting feeding guilds. Turnip Brassica rapa var. rapa cv. Atlantic (syn. B. campestris) is a remarkable brassicacean crop in which both the leaves and the bulbous taproot, which is visible as a bulb above the soil surface, are edible and have been consumed by humans since prehistoric times (Gomez-Ocampo and Prakash1999). The combination of these agro-nomic traits with further traits useful for scientific investiga-tions, including the easy accessibility of the storage organ bulb to growth measurements, and the relatively good knowledge of B. rapa main secondary metabolites, the glu-cosinolates, render this plant a suitable model to test the effects of herbivory on plant regrowth and defense re-sponses. Herbivory effects on plant morphometric growth parameters as well as on primary and secondary metabolites of B. rapa are addressed here. Plants were subjected to two intensities of herbivory inflicted by i) the caterpillars of P. brassicae as the chewing leaf-feeder and ii) B. brassicae aphids as the sucking phloem-feeder during a period of 7 d. The effect of these insects from contrasting feeding guilds on growth and selected primary and secondary metabolites were assessed prior to insect infestation, at the time of insect removal after 7 d of infestation, and 14 d after the onset of the experiment. Plants were used at two growth stages, with
the young plants in an intense growth phase in contrast to the older plants.
Methods and Materials
Experimental Set-up Brassica rapa plants were grown from pre-germinated seeds in a standard cultivation substrate com-prising 30 % sterilized soil, 25 % bark compost, 20 % sand, 15 % peat compost, and 10 % perlite by volume (Ricoter, Erdaufbereitung AG, Aarberg, Switzerland). Plants were grown and maintained in growth chambers under day:night conditions of 14:10 h L:D cycle at 24/20 °C and 50-70 % relative humidity (r.h.). Plants were fertilized once a week (Wuxal liquid fertilizer, concentration 0.5 ml/L, N:P:K 10:10:7.5, Maag Syngenta Agro, Dielsdorf, Switzerland) and rotated within the chambers every week to avoid posi-tional effects. Fourteen days after germination, seedlings were transplanted to 2-L pots. Transplanted seedlings were allowed to grow for either 11 d (i.e., 25 d-old plants = young plants) or for 31 d (i.e., 45 d-old plants = older plants) and were then used for insect infestation.
The B. brassicae aphid stock colony (originating from field-collected parthenogenetic females in the region of Zu-rich, Switzerland) was reared on cabbage (Brassica oleracea var. gemmifera) under controlled conditions for at least 20 generations (16:8 h L:D cycle at 24/18 °C, and 50 % r.h.; Klaiber et al. (2013)). The P. brassicae caterpillar stock ny, originating from four different European laboratory colo-nies (Bauer et al. 1998; Ruf et al. 2010), was reared on cabbage plants as a single colony under controlled conditions for at least 20 generations (16:8 h L:D cycle at 21±1 °C, and 50–70 % r.h.; Mattiacci et al. (2001)). Both stock colonies were maintained inside insect rearing cages (30×30×30 cm) (BugDorm, Megaview Science CO., Ltd., Taichung, Taiwan).
Evaluation of Threshold Caterpillar Density To determine the threshold density of feeding P. brassicae caterpillars that potentially could lead to an increased bulb mass, and to evaluate whether a fixed number of caged versus uncaged caterpillars on the plant would elicit a similar effect, we conducted the following evaluative experiment: nine P. brassicae caterpillars in the first to second instar were placed onto a mesh cage (26 cm long, 16 cm wide, with a diameter of 10 cm at the end) mounted to the third youngest leaf of 25 d-old plants. Nine or 18 uncaged caterpillars were added. For the controls without caterpillars, plants had an empty cage or no cage (marked with an * below). The resulting densities of caged plus uncaged caterpillars per plant were: 0*+0 (undamaged control); 0*+9; 9+0 (treatments allowing comparison of effects of caged vs. uncaged caterpil-lars); 9+9; 9+18 (N=10 plants per treatment) (Fig.1). Cater-pillars were allowed to feed for 7 d. All caterCater-pillars were
removed at d 7, and the fresh bulb mass of the plants was assessed at d 14. Based on the outcome of this evaluative experiment (see Results section), further experiments were conducted with P. brassicae caged caterpillars at a density of 9 per plant, and an even lower density of 3 caged caterpillars/ plant. The two infestation levels chosen for B. brassicae aphids also differed by a factor of 3, and were set (based on the results of a parallel evaluative experiment not shown here) to 5 (low density) and 15 (high density) winged adults per plant, respectively.
Effect of Mild Herbivore Stress on Plant Parameters We determined whether and how mild stress inflicted by the two specialist herbivores affects plant growth morphometric pa-rameters and plant chemistry, with carbohydrates and gluco-sinolates as primary and secondary metabolites, respectively.
Inflicting Mild Herbivore Stress Experiments were conducted separately for each herbivore at two plant growth stages, i.e., starting with 25 d or 45 d-old B. rapa seedlings. At the beginning of the experiments, 10 undamaged control plants were randomly selected in order to assess constitutive levels of primary and secondary metabolites after plant growth mor-phometric parameters had been measured. The remaining 60 plants per experiment were randomly assigned in equal shares in groups of 20 to one of the three following treatments: untreated, infested with lower or infested with higher herbi-vore density, i.e., 3 or 9 caterpillars in the experiments with P. brassicae, and 5 or 15 aphids in the experiment with B. brassicae. Irrespective of the treatment, a mesh cage as described above was mounted to the third youngest leaf of each plant for 7 d. For infestation in the caterpillar experiment, first to second instar P. brassicae were transferred with a fine brush onto the caged leaf. For infestation in the aphid
Fig. 1 Bulb mass (g) of young Brassica rapa plants that were subjected to different densities of Pieris brassicae caterpillars for 7 d before the caterpillars were removed. Caterpillars were used at the following ratios of caged (on the third youngest leaf) and uncaged individuals: 0+0 (= undamaged), 0+9; 9+0; 9+9; 9+18. Bulb mass was assessed 14 d after onset of infestation. Contrasting letters refer to significant differences (one-way ANOVA followed by a Tukey HSD post hoc test, withα= 0.05). N=10 plants per density treatment
experiment, B. brassicae winged adults were transferred with a sucking tube onto the caged leaf. For untreated plants, leaf cages remained empty. Insects were allowed to feed for 7 d, and were then removed. A subset of 10 plants per treatment was used for primary and secondary metabolite profiling after plant growth morphometric parameters had been assessed. The remaining subset of 10 plants per treatment (totaling to 30 per experiment) was measured and analyzed likewise on d 14. A total of 70 plants were used for each experiment and per herbivore species.
Quantification of Leaf Area, Relative Growth Rate and Bulb Biomass To quantify leaf area we followed the method spec-ified in Walter and Schurr (1999). The outlines of individual leaves from 25 d-old B. rapa plants were drawn on a piece of paper (density 80 g m−2). The image of each individual leaf then was cut out and its mass was determined. The area of the original leaf was calculated, taking paper density into account. The product of leaf length and leaf width (rectangular enclo-sure of the leaf shape) was plotted against the true leaf area. The slope of the fit line of all these plotted pairs of values equals the leaf shape factor, by which the product of leaf length and width has to be multiplied to result in the true leaf area of each individual leaf. Healthy leaves from ten uninfested plants were used to calculate the individual leaf area, resulting in a shape factor of 0.6725 (R2=0.95738, N= 87) (Online Resource 1). The total leaf area (TLA) of each plant was calculated as the sum of all individual leaf areas.
Since growth intensity of individual leaves often is distrib-uted binomially within the canopy of monopodial plants (Walter and Schurr 1999), TLA often can be extrapolated from the analysis of the leaf area of the largest individual leaf. Hence, all individual leaf areas were recorded in a preliminary experiment to evaluate whether TLA of a high replicate num-ber of plants can be assessed rapidly from precise measure-ment of the largest individual leaf of each plant throughout the main experiments. To assess this relationship, leaf areas were analyzed in plants from three different developmental stages. The first and last stages correspond to the developmental stages used throughout the bulk of this study. Plants were analyzed 25, 32, and 39 d after germination, respectively, corresponding to days 0, 7, 14 after the onset of the experi-ment (N=10 plants). The correlation of the largest leaf area to TLA was established, resulting in the equation TLA= 160.01e0.0089x(R2=0.9709) (Online Resource 2). The average area of the third youngest leaf amounted to 75.7±3.8 cm2(N= 20 plants), corresponding to 22±5 % of the total leaf area.
Relative growth rates (RGR) of TLA were calculated for two intervals after initial infestation. The first quantification was done for the period between d 0 and d 7, and the second one for the period between d 7 and d 14. RGR for TLA of each plant was calculated as: RGR (%d−1)=100×(ln (At2/At1))/(t2
−t1), where At2was TLA on d t2 and At1was TLA on d t1
(Walter and Schurr 1999) (N = 10 plants per density/ assessment day). Bulb fresh biomass was quantified after destructive sampling 7 and 14 d after initial infestation, using an analytical balance Mettler-Toledo AT-261 (Mettler-Toledo GmbH, Greifensee, Switzerland; accuracy: 0.1 mg). The cen-tral portion of the bulb was frozen and kept for chemical analysis.
Plant Metabolites For carbohydrate analysis, 20 mg samples of finely ground lyophilized plant material consisting of the first two youngest leaves (the seventh and eighth leaves counting from cotyledons upwards) and a mature leaf (fourth leaf counting from cotyledons upwards), the central portion of the bulb, and approx. 5 cm of the proximal region of the roots were extracted independently by immersing them three con-secutive times in ethanol 80 % (1 ml). In the resulting extracts, the amounts of glucose, fructose, and sucrose were deter-mined using the commercial K-SUFRG kit (Megazyme Inter-national Ireland Ltd., Bray, Co. Wicklow, Ireland) based on the enzymatic methods developed by Outlaw and Mitchell (1988), Beutler (1988), and Kunst et al. (1988). The residual pellet obtained after extraction of soluble carbohydrates was used for total starch determination according to the enzymatic method by McCleary et al. (1994) using the commercial K-TSTA kit (AOAC Method 996.11, Megazyme International Ireland Ltd., Bray, Co. Wicklow, Ireland). Basically, starch in the pellet was hydrolyzed to glucose by subsequent incuba-tions of 6 min at 100 °C with a thermostableα-amylase, and 30 min at 50 °C with amyloglucosidase. The glucose obtained was quantified using a colorimetric reaction employing per-oxidase and the production of a quinoeimine dye. Procedures were followed according to manufacturer instructions, and changes in absorbance at 340 nm for soluble carbohydrates, and 510 nm for starch content were measured with an Enspire 2300 Multimode Plate Reader (PerkinElmer, Switzerland).
Glucosinolate analysis was based largely on the method by Klaiber et al. (2013). Samples (10 mg) of finely ground lyophilized plant material, consisting of the first two youngest leaves (the seventh and eighth leaves counting from cotyle-dons upwards) and a mature leaf (fourth leaf counting from cotyledons upwards), central portion of the bulb, and approx. 5 cm of the proximal region of the roots were used. The purification technique followed the basic Sephadex/ sulphatase Arabidopsis protocol by Kliebenstein et al. (2001), with minor modifications. Each lyophilized 10 mg sample was placed first into a deep-well microtiter tube (Qiagen, Basel, Switzerland). Methanol (400μl), lead acetate 0.3 M (10μl), and mQwater (120 μl) were added to the tubes. After incubation for 60 min, extracts were centrifuged (3700 rpm, 12 min), and supernatants (300 μl each) were loaded onto Sephadex A25 columns each (Sigma-Aldrich, Buchs, Switzerland) together with glucotropaeolin (12 μl) (Phytoplan, Heidelberg, Germany) as the internal standard.
Columns were washed four times with 60 % methanol (100μl) and centrifuged (1000 rpm, 2 min). Columns were rehydrated with mQwater (10 μl), and sulfatase solution (Sigma-Aldrich, Buchs, Switzerland) was added (10μl) for glucosinolate desulfonation. After incubation overnight, the desulfoglucosinolates were washed with 60 % methanol (100 μl), eluted with mQwater (100 μl), and analyzed by HPLC on an Agilent 1200 Series instrument (Santa Clara, CA, USA) equipped with a diode array detector. A SymmetryShield RP18 column (4.6×150 mm, 5μm particle size, Waters Corporation, Milford, MA, USA) was used with a flow of 1 ml min−1and constant temperature of 30 °C. A gradient of water (solvent A) and acetonitrile (solvent B) was used: 100 % A (3 min), a gradient from 0–25 % B (23 min), 25 % B (1 min), a gradient from 25–0 % B (9 min), and 100 % A (4 min). Chromatograms were recorded at 229 nm. Con-centration of each glucosinolate was calculated based on its molecular weight (Mw) and the ratio between the peak area of this specific glucosinolate (Area g) in the sample to the peak area of the internal standard glucotropaeolin (Area s) in that sample, as described by Ediage et al. (2011): glucosinolate concentration (mg/g) = RF × (Area g/Area s) ×(n/m)× (Mw/ 1000), whereby RF= response factor; n=μmoles of the inter-nal standard; m= sample mass (g). The RF values used for those glucosinolates for which a reference sample was not available were theoretical values as described by Wathelet et al. (2004).
Statistical Analyses Data were transformed to meet the as-sumptions of normality and heteroscedasticity when neces-sary. Glucosinolate concentrations were log10 (x+1)
formed, and relative growth rates were arcsin (√x) trans-formed. Carbohydrate concentrations in young plants were analyzed with a two-way ANOVA for insect density and days after initial infestation as factors. Differences between treat-ments were assessed by Tukey HSDα=0.05 post hoc test when necessary. Glucosinolate concentrations were analyzed with a MANOVA (Pillai’s trace test) on each tissue and for young and older plants. Significant effects in the insect density response for tissues were used as indicators of glucosinolate induction for that specific tissue. Further statistical analysis then was performed for total glucosinolates as well as for each glucosinolate group (aliphatic, aromatic, indolic) per tissue by using two-way ANOVAs with insect density and days after initial infestation responses. Differences between subject fac-tors were assessed by Tukey HSD post hoc test when neces-sary. This hierarchical procedure allowed us to avoid the performance of a large number of ANOVA analyses to test each combination, and therefore avoid incorrect rejection of a true null hypothesis, or the failure to reject a false null hy-pothesis. All statistical analyses were conducted using JMP 9.0 (2010 SAS Institute Inc.) RGR of TLA was analyzed with repeated measures MANOVA using JMP 9.0. Bulb mass was
analyzed with a two-way ANOVA with insect density and days after initial infestation responses. Differences between treatments were assessed by Tukey HSDα=0.05 post hoc test when necessary. Bulb mass comparison for the threshold experiment was tested with a one-way ANOVA, with density of P. brassicae caterpillars as the main factor.
Results
Determination of Caterpillar Threshold Density Results on P. brassicae caterpillar threshold density (Fig.1) suggest that herbivore infestation level had a significant effect on bulb mass (one-way ANOVA; F4,45=2.859; P=0.034). A
relative-ly low infestation of 9 larvae/plant, whether caged or uncaged, led to a slightly increased bulb mass compared to the untreated control, although differences were not significant (Fig. 1). These 9 caged larvae/plant consumed the third youngest leaf almost completely (P. Sotelo, pers. observation). The high infestation density of 9 caged and 18 uncaged larvae/plant significantly reduced bulb mass compared to the lower infes-tation with 9 caged larvae/plant or 9 uncaged larvae/plant, respectively (Fig.1).
Effect of Mild Herbivore Stress on Plant Parameters In young plants infested with 3 or 9 leaf-feeding P. brassicae caterpil-lars for 7 d, RGR of TLA was not affected (Online Resource 3). Bulb mass attained higher mean values 14 d after the onset of infestation, i.e., 7 d after removal of the caterpillars, com-pared to the control (mean ± SE for the lower herbivore density: 45.6±4.1 g; for the higher density: 42.2±2.2 g; for control: 37.0±1.6 g) (Online Resource 4). Thus, under mild herbivore stress inflicted by the caterpillar, mean values for bulb mass attained 123 % and 114 % of the control bulb mass, (Fig.2), but these differences marginally missed the level of significance (two-way ANOVA; F2,81=2.69, P=0.074, N=10
plants per density treatment). Even after removal of the her-bivores at 7 d, mean bulb mass had attained 112 % of the control in plants subjected to the lower herbivore density (Online Resource 4). In older plants infested with caterpillars for 7 d, RGR of TLA was not affected (Online Resource 3). Bulb mass of infested plants attained the same level as in the control 14 d after the onset of infestation, as well as immedi-ately after removal of the caterpillars (14 d: lower density 99 %, higher density 101 %; 7 d: lower density 99 %; higher density 96 %; Online Resource 4).
In young plants infested with 5 or 15 phloem-feeding B. brassicae aphids for 7 d, RGR of TLA was significantly increased 14 d after the onset of infestation, i.e., 7 d after removal of the aphids, compared to the control (two-way ANOVA; F2,27=10.94, P=0.001, N=10 (Fig. 2). RGR of
higher aphid density (RGR of TLA in control plants: 1.6 % d−1; in plants infested with 5 aphids: 3.5 %d−1; in plants infested with 15 aphids: 4.4 %d−1). Immediately after removal of the herbivores at 7 d, mean RGR of TLA amounted to 119 % compared to the control (Online Resource 3). Bulb mass was not significantly affected by aphid infestation, either at 14 d (although bulb mass was 20 % lower in plants infested with 15 aphids compared to control plants) (Fig.2) or at 7 d (Online Resource 4). In older plants infested with aphids, neither RGR of TLA nor bulb mass was significantly affected (Online Resource 3 and 4).
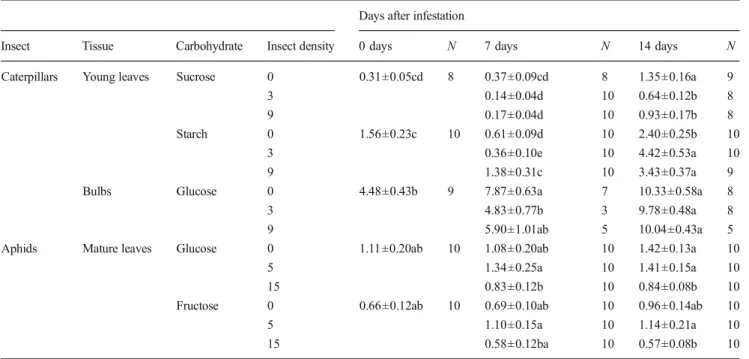
Carbohydrate Concentrations In young plants that had been infested with caterpillars for 7 d at the lower density, the concentration of certain carbohydrates was significantly al-tered in young leaves and in the bulb (Tables1and2), whereas in the other tissues analyzed, mature leaves and roots, no differences were observed (details not shown). The concen-tration of glucose (the main storage compound) was sig-nificantly reduced in the bulb by 39 % compared to the control (Table2). At the higher density, reduction of mean values compared to the control amounted to 25 %, but this difference was not significant. At day 14, when the low-density treatment resulted in enhanced mean bulb mass (Fig. 2), glucose concentrations were comparable between the treatments. By then, starch concentration in young leaves of plants subjected to mild caterpillar stress at both densities was higher than in the control (Table 2), with the increase amounting to 184 % for the lower and 143 % for the higher caterpillar density, respectively (Ta-ble 2). At day 14, the concentration of sucrose in young leaves was significantly reduced by 53 % and 31 %, for the lower and the higher caterpillar density, respectively (Table 2). Starch was not detected in the bulbs, consistent
with previous reports that bulbs of B. rapa are devoid of this metabolite (Hughes and Mitchell 1959).
In young plants that had been infested with aphids for 7 d, the glucose and fructose concentrations in the mature leaves were significantly reduced in plants infested with the higher compared to those infested with the lower aphid density (Table2), whereas differences between low or high density infestation and the control were not significant. In older plants, carbohydrates were not analyzed.
Glucosinolate Concentrations In young plants infested with caterpillars for 7 d, glucosinolate concentrations were signif-icantly altered in young leaves, but not in the remaining tissues analyzed, i.e., mature leaves, bulb, and roots (Table3
and Fig.3a). In young leaves, concentrations of the aliphatic glucosinolate gluconapin decreased significantly compared to control plants by 8 % and 13 % after 7 d of initial caterpillar infestation, and by 50 % and 58 % after 14 d, for both the lower and the higher caterpillar density, respectively (Table4). C o n c e n t r a t i o n s o f t h e i n d o l e g l u c o s i n o l a t e 4 -hydroxyglucobrassicin, in contrast, increased significantly compared to control plants 3.6 fold at the lower and 4.9 fold at the higher caterpillar density after 7 d (Table4), and con-centrations remained higher than those of control plants 7 d following removal of the caterpillars. Concentrations of total glucosinolates increased 1.19 and 1.25 fold at the lower and the higher caterpillar density, respectively, after 7 d but de-creased by 35 % and 36 %, respectively, after 14 d. However, these differences were not significant. Mean concentration values of both glucosinolates in caterpillar-infested plants were higher when insect density was higher, but this effect was in most cases not significant (Table4).
In young plants infested with aphids for 7 d, significant changes in glucosinolate contents were detected in mature
Fig. 2 Relative growth rate of total leaf area (TLA) and bulb mass of young Brassica rapa plants infested with two different densities of Pieris brassicae caterpillars (3 or 9 individuals, respectively) or Brevicoryne brassicae winged aphids (5 or 15 individuals, respectively). Measurements were made 14 d after the onset of infestation. RGR Relative growth rate. Two-way ANOVAs tested the effect of insect density on the RGR of TLA and on bulb mass. Contrasting letters refer to significant differences (Tukey HSD post hoc test, withα=0.05). N=10 plants per density treatment
Table 1 Effects of insect density and days after infestation on car-bohydrates of young Brassica rapa plants infested with two dif-ferent densities of Pieris brassicae caterpillars (3 or 9 individuals) or Brevicoryne brassicae winged aphids (5 or 15 individuals). Un-damaged B. rapa plants (i.e. In-sect density zero) were used as controls. Significant differences are highlighted in bold
Two-way ANOVA, testing for density, days after infestation and interaction terms. Significant ANOVAs were followed by Tukey HSD post hoc tests with α=0.05
N=10 plants per density treatment
Insect Plant growth stage
Carbohydrate Factor Df F P Caterpillars Young leaves Sucrose Insect density 2 8.04 <0.001
Days after infestation 2 53.88 <0.001 Insect density × d after
infestation
4 3.45 0.013
Error 81
Starch Insect density 2 4.32 0.016 Days after infestation 2 65.92 <0.001 Insect density × d after
infestation
4 5.80 <0.001
Error 81
Bulbs Glucose Insect density 2 3.39 0.041 Days after infestation 2 84.06 <0.001 Insect density × d after
infestation
4 1.83 0.137
Error 81
Aphids Mature leaves Glucose Insect density 2 3.29 0.042 Days after infestation 2 0.56 0.574 Insect density × d after
infestation
4 1.07 0.378
Error 81
Fructose Insect density 2 5.66 0.005 Days after infestation 2 2.22 0.115 Insect density × d after
infestation
4 1.73 0.151
Error 81
Table 2 Mean (± se) concentrations (g/100 g dry weight) of carbohy-drates found in young and mature leaves, and bulbs of young Brassica rapa plants infested with two different densities of pieris brassicae caterpillars (3 or 9 individuals) or Brevicoryne brassicae winged aphids
(5 or 15 individuals). Undamaged B. rapa plants (i.e. Insect density zero) were used as controls. Values followed by the same letters are not significantly different from one another
Days after infestation
Insect Tissue Carbohydrate Insect density 0 days N 7 days N 14 days N Caterpillars Young leaves Sucrose 0 0.31±0.05cd 8 0.37±0.09cd 8 1.35±0.16a 9 3 0.14±0.04d 10 0.64±0.12b 8 9 0.17±0.04d 10 0.93±0.17b 8 Starch 0 1.56±0.23c 10 0.61±0.09d 10 2.40±0.25b 10
3 0.36±0.10e 10 4.42±0.53a 10 9 1.38±0.31c 10 3.43±0.37a 9 Bulbs Glucose 0 4.48±0.43b 9 7.87±0.63a 7 10.33±0.58a 8
3 4.83±0.77b 3 9.78±0.48a 8
9 5.90±1.01ab 5 10.04±0.43a 5 Aphids Mature leaves Glucose 0 1.11±0.20ab 10 1.08±0.20ab 10 1.42±0.13a 10
5 1.34±0.25a 10 1.41±0.15a 10 15 0.83±0.12b 10 0.84±0.08b 10 Fructose 0 0.66±0.12ab 10 0.69±0.10ab 10 0.96±0.14ab 10 5 1.10±0.15a 10 1.14±0.21a 10 15 0.58±0.12ba 10 0.57±0.08b 10 Two-way ANOVAs followed by Tukey HSD post hoc tests withα=0.05
Table 3 Effects of insect density and days after infestation on total glucosinolates found in young leaves, mature leaves, bulbs and roots of young and mature Brassica rapa plants infested with two different densities of Pieris brassicae caterpillars (3 or 9 individuals) or
Brevicoryne brassicae winged aphids (5 or 15 individuals). Undamaged B. rapa plants (i.e. Insect density zero) were used as controls. Significant differences are highlighted in bold
Insect Plant growth stage Tissue Factor Df F P Caterpillars Young plants Young leaves Insect density 8 7.50 <0.001
Days after infestation 8 6.06 <0.001 Insect density × d after infestation 16 3.72 <0.001
Error 324
Mature leaves Insect density 8 0.54 0.824 Days after infestation 8 2.91 0.005 Insect density × d after infestation 16 0.41 0.980
Error 324
Bulb Insect density 8 1.66 0.112 Days after infestation 8 8.67 <0.001 Insect density × d after infestation 16 1.08 0.369
Error 324
Roots Insect density 8 1.30 0.246 Days after infestation 8 14.85 <0.001 Insect density × d after infestation 16 1.08 0.370
Error 324
Older plants Young leaves Insect density 8 0.81 0.595 Days after infestation 8 9.68 <0.001 Insect density × d after infestation 16 0.61 0.874
Error 324
Mature leaves Insect density 8 0.98 0.453 Days after infestation 8 6.32 <0.001 Insect density x d after infestation 16 0.92 0.551
Error 324
Bulb Insect density 8 0.93 0.490 Days after infestation 8 13.96 <0.001 Insect density × d after infestation 16 0.72 0.775
Error 324
Roots Insect density 8 1.32 0.240 Days after infestation 8 11.26 <0.001 Insect density × d after infestation 16 1.49 0.102
Error 324
Aphids Young plants Young leaves Insect density 2 3.09 0.051 Days after infestation 8 12.01 <0.001 Insect density × d after infestation 16 2.33 0.003
Error 324
Mature leaves Insect density 8 4.15 <0.001 Days after infestation 8 12.87 <0.001 Insect density × d after infestation 16 3.57 <0.001
Error 324
Bulb Insect density 8 3.51 <0.001 Days after infestation 8 10.31 <0.001 Insect density × d after infestation 16 1.81 0.028
Error 324
Roots Insect density 8 1.13 0.348 Days after infestation 8 15.05 <0.001 Insect density × d after infestation 16 0.97 0.486
Error 324
leaves (Tables 3 and 4) and in the bulb (Tables 3 and 4, Fig.3b), but not in the other tissues analyzed (Table3). In mature leaves, a significant reduction of the aliphatic gluco-sinolate gluconapin was recorded compared to the control, regardless of aphid density (Table4). In the bulb, in contrast, total glucosinolate content significantly increased in response to aphid herbivory at either density (Table 4). The higher aphid density led to 2.1 and 2.8 fold increases in the concen-trations of the aliphatic glucosinolates glucoerucin and gluco-napin, respectively, after 7 d of initial aphid infestation, and to 1.3 and 2.3 fold increases after 14 d (Table4 and Fig.3b). Similarly, the concentration of the aromatic glucosinolate gluconasturtiin increased 2.8 fold after 7 d and 1.5 fold after 14 d (Table 4 and Fig. 3b). Concentrations of the indole
glucosinolates 4-hydroxyglucobrassicin and glucobrassicin increased 2.3 fold in both cases after 7 d, and decreased after 14 d but were still 2.3 fold higher compared to control plants (Table4and Fig.3b). Concentrations of total glucosinolates also increased 2.5 fold after 7 d and 2.0 fold after 14 d (Table4
and Fig.3b). The lower aphid density led to a 1.6 fold increase of the aromatic glucosinolate gluconasturtin after 7 d, while after 14 d, the difference to the control was no longer signif-icant in the bulb. The concentrations of the two indolic glu-cosinolates 4-hydroxyglucobrassicin and glucobrassicin in-creased 1.7 and 2.0 fold, respectively, after 7 d, and 2.3 and 2.4 fold after 14 d compared to the control. Overall concen-trations of total glucosinolates increased 1.7 fold after 7 d and remained 1.6 fold higher after 14 d (Table4).
Table 3 (continued)
Insect Plant growth stage Tissue Factor Df F P Days after infestation 8 4.10 <0.001 Insect density × d after infestation 16 0.66 0.831
Error 324
Mature leaves Insect density 8 0.97 0.463 Days after infestation 8 7.18 <0.001 Insect density × d after infestation 16 0.65 0.839
Error 324
Bulb Insect density 8 0.34 0.951 Days after infestation 8 8.48 <0.001 Insect density × d after infestation 16 0.61 0.879
Error 324
Roots Insect density 8 0.51 0.849 Days after infestation 8 6.19 <0.001 Insect density × d after infestation 16 1.09 0.364
Error 324
A MANOVA (Pillai’s trace test) was conducted for each plant tissue and for both young and older plants. Significant ANOVAs were followed by Tukey HSD post hoc tests withα=0.05
N=10 plants per density treatment
Fig. 3 Glucosinolate
concentrations in young Brassica rapa leaves (a) or bulbs (b) of undamaged control plants vs. plants subjected to a Pieris brassicae caterpillars (9 per plant) or b Brevicoryne brassicae winged aphids (15 per plant). * = statistically significant differences (two-way ANOVAs followed by Tukey HSD post hoc tests, with α=0.05) (see Table4for details). N=10 plants per treatment
In older plants infested with either caterpillars or aphids, glucosinolate concentrations were not significantly influenced by the herbivore infestations (Table3).
Discussion
We evaluated how Brassica rapa plants respond to mild herbivore stress inflicted by two different specialist insect herbivores from contrasting feeding guilds, the caterpillar
Pieris brassicae, a chewing leaf-feeder, and the aphid Brevicoryne brassicae, a sucking phloem-feeder. We ad-dressed herbivory effects on plant morphometric growth pa-rameters as well as on primary and secondary metabolites. Findings indicate that the Brassica plant responds differently to the mild stress inflicted by the two herbivores at all three plant levels analyzed, and that such mild stress might have a beneficial effect on edible plant organs. This study provides evidence of plasticity in terms of plant response to mild insect herbivory and demonstrates the potential benefits of such herbivory for plant yield.
Table 4 Mean (± se) concentrations of glucosinolates (μmoles g−1dry weight) found in young leaves, mature leaves and bulbs of young Bras-sica rapa plants infested with two different densities of Pieris brasBras-sicae caterpillars (3 or 9 individuals) or Brevicoryne brassicae winged aphids
(5 or 15 individuals). Undamaged plants (i.e. Insect density zero) were used as controls. Values followed by the same letters are not significantly different from one another
Insect Tissue Glucosinolate group/compounda Insect density Days after initial infestation
0 days 7 days 14 days Caterpillars Young leaves Aliphatic GNA 0 1.444±0.149b 1.752±0.253a 2.139±0.234a
3 1.615±0.260b 1.063±0.159c 9 1.517±0.232b 0.891±0.055c Indole 4OHGBS 0 0.276±0.048d 0.210±0.035d 0.263±0.046d 3 0.758±0.101b 0.403±0.062c 9 1.003±0.151a 0.573±0.087bc Total 0 5.474±0.554b 6.192±0.799a 7.520±0.806a
3 7.356±0.827a 4.874±0.635b 9 7.720±0.916a 4.782±0.239b Aphids Mature leaves Aliphatic GNA 0 0.500±0.074c 1.332±0.188a 0.105±0.031d 5 0.849±0.242b 0.052±0.010e 15 0.826±0.127b 0.991±0.156a Bulb Aliphatic GER 0 0.537±0.125bc 0.542±0.121bc 0.500±0.096c 5 0.744±0.084b 0.386±0.037d 15 1.158±0.137a 0.656±0.063b GNA 0 1.546±0.293c 1.047±0.105c 1.487±0.288c 5 1.619±0.309c 2.347±0.248b 15 2.962±0.413ab 3.401±0.257a Aromatic GNT 0 1.937±0.268b 0.927±0.147d 0.851±0.142d 5 1.699±0.417bc 1.075±0.130cd 15 2.545±0.321a 1.307±0.143ab Indole 4OHGBS 0 1.155±0.162ab 0.622±0.152c 0.354±0.038d
5 1.049±0.205b 0.813±0.093bc 15 1.407±0.156a 0.798±0.076c GBS 0 1.371±0.196b 0.759±0.170c 0.345±0.053d 5 1.511±0.302ab 0.828±0.086c 15 1.759±0.228a 0.788±0.112c Total 0 6.546±0.820b 3.897±0.558c 3.537±0.552c 5 6.622±1.187b 5.449±0.507bc 15 9.831±1.019a 6.950±0.531b Two-way ANOVAs followed by Tukey HSD post hoc tests, withα=0.05. N=10, except for aphids/mature leaves/GNA with N=7
a
Plant Growth and Primary Metabolism When young Brassica plants were exposed to mild herbivory by the chewing leaf-feeder P. brassicae, a tendency for increase in bulb mass was observed. This trend was stronger when plants were subjected to lower than to higher insect density. While the increase in mass was apparent when herbivores were removed (i.e., 7 d after initial caterpillar infestation), it became more accentuated after an additional 7 d. This trend also was noted in the evaluatory threshold experiment with both caged and uncaged insects. In an outdoor and glasshouse study with potato, biomass increases were reported when tubers (but not leaves) were exposed to larvae of the specialist Guatemalan potato moth T. solanivora (Poveda et al.2010). In that study, undamaged tuber biomass increases more than 200 % in field and pot experiments. However, interpretation of these data remains difficult as information on factors that might have affected the above-ground tissues were missing. In a different study, an almost 1.5-fold increase in biomass allocation to the roots was documented when the spotted knapweed Centaurea maculosa (Asteraceae) was subjected to herbivory by two specialized root feeders, the weevil Cyphocleonus achates and the moth Agapeta zoegana (Steinger and Müller-Schärer
1992). Compensatory or overcompensatory growth of the root or the tuber system appears to be a mechanism to improve plant performance and immunity, especially against soil-borne herbivores (Erb et al. 2012). As shown in our evaluatory threshold experiment (Fig. 1), herbivore density is critical for the expression of this effect: At high herbivore density, total shoot photosynthesis will be reduced, which necessarily leads to an overall reduction of the potential to deliver carbo-hydrates towards the root system. Future experiments should test whether even lower insect densities than those applied here could lead to significant effects on bulb growth and yield. Plants responded to herbivory by the chewing leaf-feeder, at both densities, with changes in carbohydrate allocation. We noted that sucrose concentration decreased in young leaves at both insect densities, and that starch increased at the higher density. A similar situation was reported for chinese cabbage B. rapa ssp. pekinensis cv. Kantonner infested with low den-sities of Phaedon cochleariae chrysomelid beetles (Rostás et al.2002). In that study, sucrose concentration in leaves decreased by 30 % with infestation with five second-instar beetle larvae. In our study, the lower caterpillar density led to a decrease in mean glucose concentration in the bulb, with significant difference at 7 d after infestation. Glucose is the main storage carbohydrate in the bulb. It seems that the diversion of carbohydrates from the shoot into the unaffected bulb (or root) system to support later regrowth is not a survival strategy against mild herbivory by P. brassicae.
Upon herbivory by the sucking phloem-feeder B. brassicae, Brassica plants responded with significantly increased rela-tive growth rates in total leaf area at both insect densities. This effect was apparent upon herbivore removal 7 d after
infestation, and became even more accentuated after an addi-tional 7 d. The mature leaves of plants subjected to the lower aphid density had significantly increased concentrations of glucose and fructose compared to leaves from plants infested with the higher aphid density, and mean concentrations of these monosaccharides were consistently higher in the herbivore-stressed than in the control plants. These results point towards a preferential flow of carbohydrates into the mildly attacked tissue of the plant. Recently, aphid salivary secretions were shown to affect primary metabolism (Giordanengo et al.2010; Goggin2007). Thus, it is possible that aphid secretions induced the increased flux of carbohy-drates towards the mildly infested organs, which could have subsequently stimulated the growth of non-affected leaves.
Our comparative study with a chewing and a sucking herbivore are concordant with studies on the effects of S. littoralis caterpillars and T. urticae spider mites on cotton (Schmidt et al. 2009); and of M. persicae and B. brassicae aphids and S. exigua and P. rapae caterpillars on A. thaliana (Mewis et al. 2006). All these studies suggest that different herbivore feeding guilds can stimulate substantially different patterns of compensatory plant growth and primary metabo-lism in various plant organs.
Glucosinolate Concentrations The two insect herbivores from contrasting feeding guilds also generated different sponses on glucosinolate profiles of B. rapa plants. In re-sponse to herbivory by the chewing leaf-feeder P. brassicae, both at the lower and higher density, the plant defense re-sponse was diverted towards young leaves, as exemplified by the down-regulation of aliphatic and the up-regulation of indolic glucosinolates. This effect lasted 7 d after herbivore removal. Similarly, when the brassicacean A. thaliana was infested with P. rapae caterpillars, there was an increase in indol glucosinolates of about 20 % compared to control plants and a concomitant reduction of aliphatic glucosinolates (Mewis et al.2006). An induction of indolic glucosinolates and a concomitant reduction of aliphatic glucosinolates seem to be a general brassicacean plant response to her-bivory (Textor and Gershenzon 2009), although different guilds might have distinct effects on glucosinolate profiles (Mewis et al. 2006). Cross-talk between the biosynthetic pathways leading to the formation of indolic and aliphatic glucosinolates seems to underlie the contrasting effects on glucosinolate induction upon herbivory (Beekwilder et al.
2008).
A different response was observed on B. rapa plants chal-lenged by B. brassicae aphids. In this case, infested plants did not show any up-regulation in glucosinolate-based defense in leaves. On the contrary, down-regulation of only one aliphatic glucosinolate was observed in mature leaves. Similarly, ali-phatic glucosinolates concentrations decreased in Chinese cabbage plants challenged by low densities of the chrysomelid
beetle P. cochleariae (Rostás et al.2002). However, in the bulb, total and individual glucosinolate concentrations in-creased upon herbivory by the aphids. Two aliphatic, one aromatic, and two indolic glucosinolates increased during the aphid infestation. This effect was long lasting, in most cases being apparent even 7 d after aphid removal, and was in all but one case stronger when plants were ex-posed to the higher aphid density. Aphids recently were shown to trigger a weaker induction of plant glucosino-lates than chewing insects (Mewis et al. 2005; Textor and Gershenzon 2009). However, none of those studies dealt with aphids on a bulb-producing plant. Here we showed that increases of glucosinolate concentrations in the bulb were typically on the order of a factor two to three, which demonstrates that specialist aphids are indeed capable of inducing prominent effects on glucosinolate concentrations, even at mild infestation densities. The increased concen-tration of glucosinolates in the bulb might repel soil-borne herbivores or microorganisms from the weakened, slower-growing bulb (Van der Putten et al. 2001). This, in turn, might facilitate continuous functioning of the plant at a sufficient fitness level while still allowing the aphid to continue feeding on the attacked plant. In future studies, it will be interesting to elucidate whether aphids are manipulating the induction.
Most studies dealing with herbivore induction of glucosin-olates have made measurements at the time of herbivory or shortly thereafter (i.e., 24 or 48 h) (Textor and Gershenzon
2009, and references therein). In our study, plant glucosinolate levels were assessed prior to insect infestation, at the time of insect removal after 7 d, and finally 14 d after the onset of the experiment. Thus, to our knowledge, our study provides the first evidence for sustained levels of glucosinolate induction after herbivory. The fact that the Brassica plants maintained relatively high levels of induced glucosinolates for a long time span might indicate that the cost of their production is not as high as generally predicted, or as shown for other plant-herbivore systems (Hern and Dorn 2001; Paré and Tumlinson 1999). Alternatively, an additional benefit to plants, such as protection against further herbivore or micro-organism attack, is derived from such a prolonged induced response.
Effect of Plant Age No changes in plant growth parameters were observed in older plants challenged by either cater-pillars or aphids at either density. Neither were there significant changes in glucosinolate levels detected in the-se plants (carbohydrates were not analyzed). Thus, plant age seems to be a critical factor for potential overcom-pensation of mild herbivory in B. rapa plants, strengthen-ing and expandstrengthen-ing the conclusions on plant compensation for arthropod feeding by Trumble et al. (1993) in their review paper.
Outlook and Conclusion Plant defense responses against a particular herbivore may be influenced by other herbi-vores that compete for that plant as a key resource (Agrawal 1998; Delaney and Macedo 2001). Previous infestation of B. oleracea plants by B. brassicae aphids facilitates the growth and development of P. brassicae caterpillars through the attenuation of jasmonic acid-related plant defenses by the aphids, which facilitates the growth and development of P. brassicae (Soler et al.
2012). This positive effect was less pronounced when caterpillars and aphids simultaneously infested the plant. In contrast, a less damaging sucking herbivore, the mirid bug Tupiocoris notatus, rendered tobacco plants more resistant to a more damaging insect, the chewing herbi-vore Manduca quinquemaculata. The mirid bug elicited direct and indirect defenses based on the accumulation of secondary metabolites and proteinase inhibitors in the leaf tissue, resulting in a slower growth of Manduca larvae and a preferential attraction of a predator to this less mobile herbivore (Kessler and Baldwin 2004). Thus, it would be interesting to test whether different patterns of plant compensatory growth and metabolite inductions would be observed if B. brassicae and P. brassicae were to feed sequentially, or even simultaneously on our model Brassica plant.
In summary, we showed here that B. rapa plants dis-play plasticity in plant responses when attacked by either one of two insect herbivores from contrasting feeding guilds. Such responses were characterized by different compensatory organ growth and glucosinolate induction patterns. Brassica rapa plants infested with caterpillars responded to insect herbivory with a tendency to increase bulb mass, and by contrasting regulation of aliphatic and indolic glucosinolates in the leaves. In contrast, plants challenged by aphids responded with an overcompensato-ry leaf growth and with an increase in glucosinolate concentrations in the bulb, the most important storage organ of B. rapa. Our results suggest that mild herbivore stress has the potential to induce beneficial effects on the yield of edible plant organs, comprising here leaves and bulb. Thus, in future application-oriented studies it will be important to derive the optimum level of damage to elicit positive effects on yield and to pinpoint the most suscep-tible developmental stage of the plant. Optimization of such approaches might turn herbivorous insects into ben-eficial actuators from the perspective of human exploita-tion of agroecosystems.
Acknowledgments We thank Jeannine Klaiber for technical advice, Bernd Fellinghauer (ETH Seminar for Statistics) for statistical advice, Brigitta Herzog, Marianne Wettstein, and Brittany Hawkins-Orschel for assistance with growth chambers and laboratory work. We also thank Claudio Sedivy and Judith Riedel for useful comments on the manuscript.
References
Agrawal AA (1998) Induced responses to herbivory and increased plant performance. Science 279:1201–1202
Bauer E, Trenczek T, Dorn S (1998) Instar-dependent hemocyte changes in Pieris brassicae after parasitization by Cotesia glomerata. Entomol Exp Appl 88:49–58
Beekwilder J, van Leeuwen W, van Dam NM, Bertossi M, Grandi V, Mizzi L, Soloview M, Szabados L, Molthoff JW, Schipper B, Verbocht H, de Vos RC, Morandini P, Aarts MG, Bovy A (2008) The impact of the absence of aliphatic glucosinolates on insect herbivory in Arabidopsis. PLoS ONE 3:e2068
Beutler HO (1988) D-fructose. In: Bergmeyer HU (ed) Methods of enzymatic analysis, 3rd edn. VCH Publishers (UK) Ltd, Cambridge, pp 156–159
Delaney KJ, Macedo TB (2001) The impact of herbivory on plants: yield, fitness, and population dynamics. In: Peterson RKD, Higley LG (eds) Biotic stress and yield loss. CRC, Boca Raton, pp 135–160 Dyer MI, Acra MA, Wang GM, Coleman DC, Freckman DW,
McNaughton SJ, Strain BR (1991) Source-sink carbon relations in two Panicum coloratum ecotypes in response to herbivory. Ecology 72:1472–1483
Ediage EN, Di Mavungu JD, Scippo ML, Schneider YJ, Larondelle Y, Callebaut A, Robbens J, Van Peteghem C, De Saeger S (2011) Screening, identification and quantification of glucosinolates in black radish (Raphanus sativus L. niger) based dietary supplements using liquid chromatography coupled with a photodiode array and liquid chromatography mass spectrometry. J Chromatogr A 1218: 4395–4405
Erb M, Glauser G, Robert CAM (2012) Induced immunity against belowground insect herbivores - activation of defenses in the ab-sence of a jasmonate burst. J Chem Ecol 38:629–640
Ferreres F, Sousa C, Valentao P, Pereira JA, Seabra RM, Andrade PB (2007) Tronchuda cabbage flavonoids uptake by Pieris brassicae. Phytochemistry 68:361–367
Ferreres F, Valentao P, Pereira JA, Bento A, Noites A, Seabra RM, Andrade PB (2008) HPLC-DAD-MS/MS-ESI screening of pheno-lic compounds in Pieris brassicae L. reared on Brassica rapa var. rapa L. J Agric Food Chem 56:844–853
Giordanengo P, Brunissen L, Rusterucci C, Vincent C, Van Bel A, Dinant S, Girousse C, Faucher M, Bonnemain JL (2010) Compatible plant-aphid interactions: how plant-aphids manipulate plant responses. C R Biol 333:516–523
Goggin FL (2007) Plant–aphid interactions: molecular and ecological perspectives. Curr Opin Plant Biol 10:399–408
Gomez-Ocampo C, Prakash S (1999) Origin and domestication. In: Gomez-Ocampo C (ed) Biology of Brassica coenospecies. Elsevier Science, Amsterdam, pp 33–58
Gutbrodt B, Mody K, Dorn S (2011a) Drought changes plant chemistry and causes contrasting responses in lepidopteran herbivores. Oikos 120:1732–1740
Gutbrodt B, Mody K, Wittwer R, Dorn S (2011b) Within-plant distribu-tion of induced resistance in apple seedlings: rapid acropetal and delayed basipetal responses. Planta 233:1199–1207
Hern A, Dorn S (2001) Induced emissions of apple fruit volatiles by the codling moth: changing patterns with different time periods after infestation and different larval instars. Phytochemistry 57:409–416 Holland JN, Cheng W, Crossley DA Jr (1996) Herbivore-induced chang-es in plant carbon asschang-essment of below-ground C fluxchang-es using carbon-14. Oecologia 107:87–94
Hopkins RJ, van Dam NM, van Loon JJA (2009) Role of glucosinolates in insect-plant relationships and multitrophic interactions. Annu Rev Entomol 54:57–83
Hughes JM, Mitchell TJ (1959) Through-circulation drying of vegetable materials. J Sci Food Agric 10:45–50
Kaplan I, Halitschke R, Kessler A, Sardanelli S, Denno RF (2008) Constitutive and induced defenses to herbivory in above- and be-lowground plant tissues. Ecology 89:392–406
Karban R (2011) The ecology and evolution of induced resistance against herbivores. Funct Ecol 25:339–347
Kessler A, Baldwin IT (2004) Herbivore-induced plant vaccination. Part I. The orchestration of plant defenses in nature and their fitness consequences in the wild tobacco Nicotiana attenuata. Plant J 38: 639–649
Kiddle G, Bennett RN, Botting NP, Davidson NE, Robertson AAB, Wallsgrove RM (2001) High-performance liquid chromatographic separation of natural and synthetic desulphoglucosinolates and their chemical validation by UV, NMR and chemical ionisation-MS methods. Phytochem Anal 12:226–242
Klaiber J, Dorn S, Najar-Rodriguez AJ (2013) Plant acclimation to elevated CO2 increases constitutive glucosinolate levels of
Brassica plants and affects the performance of two specialized insect herbivores from contrasting feeding guilds. J Chem Ecol 39:653– 665
Kliebenstein DJ, Lambrix VM, Reichelt M, Gershenzon J, Mitchell-Olds T (2001) Gene duplication in the diversification of secondary me-tabolism: Tandem 2-oxoglutarate-dependent dioxygenases control glucosinolate biosynthesis in Arabidopsis. Plant Cell 13:681–693 Kunst A, Draeger B, Ziegenhorn J (1988) D-Glucose. In: Bergmeyer HU
(ed) Methods of enzymatic analysis, 3rd edn. VCH Publishers (UK) Ltd, Cambridge, pp 117–130
Maschinski J, Whithman TG (1989) The continuum of plant-responses to herbivory—the influence of plant-association, nutrient availability, and timing. Am Nat 134:1–19
Mattiacci L, Rudelli S, Rocca BA, Genini S, Dorn S (2001) Systemically-induced response of cabbage plants against a specialist herbivore, Pieris brassicae. Chemoecology 11:167–173
McCleary BV, Solah V, Gibson TS (1994) Quantitative measurement of total starch in cereal flours and products. J Cereal Sci 20:51–58 Mewis I, Appel HM, Hom A, Raina R, Schultz C (2005) Major signaling
pathways modulate Arabidopsis glucosinolate accumulation and response to both phloem-feeding and chewing insects. Plant Physiol 138:1149–1162
Mewis I, Tokuhisa JG, Schultz JC, Appel HM, Ulrichs C, Gershenzon J (2006) Gene expression and glucosinolate accumulation in Arabidopsis thaliana in response to generalist and specialist herbi-vores of different feeding guilds and the role of defense signaling pathways. Phytochemistry 67:2450–2462
Outlaw WH, Mitchell CT (1988) Sucrose. In: Bergmeyer HU (ed) Methods of enzymatic analysis, 3rd edn. VCH Publishers (UK) Ltd, Cambridge, pp 99–102
Paré P, Tumlinson H (1999) Plant volatiles as a defense against insect herbivores. Plant Physiol 121:325–331
Poveda K, Jimenez MIG, Kessler A (2010) The enemy as ally: herbivore-induced increase in crop yield. Ecol Appl 20:1787–1793
Renwick JAA (2002) The chemical world of crucivores: lures, treats and traps. Entomol Exp Appl 104:35–42
Renwick JAA, Lopez K (1999) Experience-based food consumption by larvae of Pieris rapae: addiction to glucosinolates? Entomol Exp Appl 91:51–58
Rostás M, Bennett R, Hilker M (2002) Comparative physiological re-sponses in Chinese cabbage induced by herbivory and fungal infec-tion. J Chem Ecol 28:2449–2463
Ruf D, Mazzi D, Dorn S (2010) No kin discrimination in female mate choice of a parasitoid with complementary sex determination. Behav Ecol 21:1301–1307
Schmidt L, Schurr U, Rose USR (2009) Local and systemic effects of two herbivores with different feeding mechanisms on primary metabo-lism of cotton leaves. Plant Cell Environ 32:893–903
Schwachtje J, Baldwin IT (2008) Why does herbivore attack reconfigure primary metabolism? Plant Physiol 146:845–885
Schwachtje J, Minchin PEH, Jahnke S, Van Dongen JT, Schittko U, Baldwin IT (2006) SNF1-related kinases allow plants to tolerate herbivory by allocating carbon to roots. Proc Natl Acad Sci U S A 103:12935–12940
Soler R, Badenes-Perez FR, Broekgaarden C, Zheng S-J, David A, Boland W, Dicke M (2012) Plant-mediated facilitation between a leaf-feeding and a phloem-feeding insect in a brassicaceous plant: from insect performance to gene transcription. Funct Ecol 26:156–166 Steinger T, Müller-Schärer H (1992) Physiological and growth responses
of Centaurea maculosa (Asteraceae) to root herbivory under vary-ing levels of interspecific plant competition and soil nitrogen avail-ability. Oecologia 91:141–149
Strauss SY, Agrawal AA (1999) The ecology and evolution of plant tolerance to herbivory. Trends Ecol Evol 14:179–185
Textor S, Gershenzon J (2009) Herbivore induction of the glucosinolate– myrosinase defense system: major trends, biochemical bases and ecological significance. Phytochem Rev 8:149–170
Trumble JT, Kolodny-Hirsch DM, Ting IP (1993) Plant compensation for arthropod herbivory. Annu Rev Entomol 38:93–119
Van Der Putten WH, Vet LEM, Harvey JA, Wäckers F (2001) Linking above- and belowground multitrophic intereactions of plants,
herbivores, pathogens, and their antagonists. Trends Ecol Evol 16: 547–554
Voelckel C, Baldwin IT (2004) Herbivore-induced plant vaccination. Part II. Array-studies reveal the transience of herbivore-specific tran-scriptional imprints and a distinct imprint from stress combinations. Plant J 38:650–663
Walter A, Schurr U (1999) The modular character of growth in Nicotiana tabacum plants under steady-state nutrition. J Exp Bot 50:1169– 1177
War AR, Paulraj MG, Ahmad T, Buhroo AA, Hussain B, Ignacimuthu S, Sharma HC (2012) Mechanisms of plant defense against insect herbivores. Plant Signal Behav 7:1306–1320
Wathelet JP, Iori R, Leoni O, Rollin P, Quinsac A, Palmieri S (2004) Guidelines for glucosinolate analysis in green tissues used for biofumigation. Agroindustria 3:257–266
Winde I, Wittstock U (2011) Insect herbivore counteradaptations to the plant glucosinolate-myrosinase system. Phytochemistry 72:1566– 1575
Zvereva EL, Kozlov MV (2012) Sources of variation in plant responses to belowground insect herbivory: a meta-analysis. Oecologia 169: 441–452