1
No need to read: Developing a pictorial single-item scale for measuring
perceived usability
Juergen Baumgartnera, Andreas Sonderegger and Juergen Sauer
Department of Psychology, University of Fribourg, 1700 Fribourg, Switzerland
To facilitate the measurement of perceived usability in product evaluation, we have developed a one-item pictorial scale called PSIUS (Pictorial Single-Item Usability Scale), which aims to measure the satisfaction component of the usability construct. This bipolar scale consists of three main visual elements: satisfaction with the system, emotions experienced during system use and system to be evaluated. Employing a user-centred iterative design process, the scale was tested in two validation studies (N=60; N=38) using student participants. Sensitivity, convergent validity, divergent validity and criterion-related validity of the scale were determined. The results showed that satisfactory convergent validity was achieved, with the pictorial scale showing strong correlations with sum scores of established usability scales such as the System Usability Scale (SUS) and the Post Study System Usability Questionnaire (PSSUQ). The other validity coefficients also showed overall positive results, suggesting that the development of the pictorial scale may be a promising endeavour. The PSIUS represents an initial attempt to provide a nonverbal approach to the summative evaluation of technical systems.
Keywords: pictorial scale; consumer product; perceived usability; scale development
Highlights
• The article presents a design- and evaluation-procedure for the development of a pictorial
single-item scale for measuring perceived usability.
• First empirical results indicate that the PSIUS (Pictorial Single-Item Usability Scale)
enjoys satisfactory psychometric properties.
• The PSIUS provides a promising nonverbal alternative to verbal scales for summative
usability evaluation.
1 Introduction
The measurement of perceived usability represents an important part in the development of interactive consumer goods. It is crucial for decisions in early development stages (e.g. where changes can be applied easily without great expenses), but is also important in later stages (e.g. when a product has already been launched). The most pragmatic way of investigating perceived usability is simply by asking the users for their opinion (Nielsen, 1994). The most commonly used way to collect large subjective usability data is by means of verbal questionnaires. While the standard questionnaires available clearly have their merits in usability research, they also have two principal drawbacks, which may make their use non-optimal under certain conditions. Most usability questionnaires are rather elaborate (i.e. they consist of many items) and they are all language-based. This implies that under conditions that require short completion times and where respondents have difficulties in
understanding the language, such standard questionnaires cannot make full use of their good
a
Corresponding author. Phone: +41-26-3007663, Fax: +41-26-3009712. Rue Faucigny 2,
CH-1700 Fribourg. Email address: [email protected]
2
psychometric properties. This article aims to overcome these problems by presenting a nonverbal alternative to assessing perceived usability in the form of a pictorial scale comprising a single item.
1.1 Measuring perceived usability by using verbal scales
Usability is a construct describing the quality of the interaction of a user with an interactive system. The International Organisation for Standardisation’s (ISO) standard 9241-11.2 (2016) defines usability by means of three core components: (1) effectiveness, (2) efficiency and (3) satisfaction. Effectiveness refers to the ‘accuracy and completeness with which users achieve specified goals’ (p. 3), of which a measure may be ‘task completion rate’. Efficiency focuses on the ‘resources used in relation to the results achieved’ (p. 3), of which a measure may be ‘task completion time’. Satisfaction is defined as the ‘person’s perceptions and responses that result from the use of a system, product or service’ (p. 3), of which a measure may be ‘ease of use’. The first two components reflect
performance-related aspects of usability, whereas satisfaction refers to the subjective impression created during the use of a system. All these components are embedded in the usage context (i.e. user, tasks, goals, resources, and environment). Hornbæk (2006) argues that all components of usability should be evaluated by using both subjective and objective measures. Subjective measures include users’ perceptions of the interface and attitudes towards the device, the interaction, or the outcome variables. Conversely, objective measures ‘concern aspects of the interaction not dependent on users’ perception’ (Hornbæk, 2006, p. 92). Only the use of both types of measures allows us to obtain a holistic understanding of the usability of an artefact.
To assess the subjective (or perceived) usability of an artefact, the use of questionnaires is widespread for obvious reasons. First, questionnaire data provide a score, which can be compared to a benchmark or to the score of other artefacts. Second, in comparison to other methods such as usability tests, few resources are needed for administration and collection of data by means of questionnaires.
These positive qualities of questionnaires have led to the development of several standardised instruments over the last three decades, which aim to measure perceived usability and related
constructs. They enjoy good psychometric properties and often assess multiple dimensions. Such instruments include QUIS (Questionnaire for User Interface Satisfaction, Chin et al., 1988), ASQ (After-Scenario Questionnaire, Lewis, 1991), SUMI (Software Usability Measurement Inventory, Kirakowski & Corbett, 1993), PSSUQ (Post-Study System Usability Questionnaire, Lewis, 1995), SUS (System Usability Scale, Brooke, 1996), PUTQ (Purdue Usability Testing Questionnaire, Lin et al., 1997), WAMMI (Web Analysis and Measurement Inventory, Kirakowski & Cierlik, 1998), IsoMetrics (Gediga et al., 1999), UMUX (Usability Metrics for User Experience, Finstad, 2010) and UMUX Lite (short version of the UMUX, Lewis et al., 2013). Other instruments focus more on user experience (UX), which may be considered a concept closely related to usability. This includes
instruments such as AttrakDiff (Hassenzahl, 2004), UEQ (User Experience Questionnaire, Laugwitz et al., 2008) and meCUE (Modular Evaluation of Key Components of User Experience, Minge & Riedel, 2013). The questionnaires listed above differ considerably with regard to their elaborateness, with which they measure the construct. For example, the IsoMetrics (Gediga et al., 1999) consists of 75 items (categorised into 7 subscales) whereas the UMUX Lite (Lewis et al., 2013) comprises only two items. There are a number of questions and trade-offs associated with short and elaborate measurement of concepts, which represents an important issue in usability testing and in psychological assessment more generally.
1.2 Use of single-item measures in research
Most questionnaires used in psychology employ a set of items rather than a single item to measure a construct. This approach reduces the measurement error and allows a more precise measurement of latent constructs (e.g. Churchill, 1979; Nunnally, 1978). However, there may be circumstances where the advantages of shorter scales may outweigh their disadvantages.
3
Such special circumstances may be faced when respondents are asked to fill in a battery of questionnaires covering many concepts or when the same questionnaire is administered repeatedly covering several points of measurement (e.g., Tractinsky et al., 2000; Wanous et al., 1997). This may have negative effects on participant motivation, resulting in undesirable behaviours like skipping questions or making random responses (Robins et al., 2001). Especially, if similar items are used to measure the same construct, the questionnaire may be perceived as repetitive. In online surveys, there are particular time and space constraints (Evans & Mathur, 2005). Such surveys may be particularly problematic with regard to the administration of elaborate questionnaires, given that the dropout rate is higher than in conventional lab or field studies. Single item-scales may therefore be considered a promising way to avoid the problems associated with using long questionnaires. Some authors argue that for some constructs (e.g. job satisfaction) a single-item scale may even be superior to multi-item scales because it obtains a reliable global rating (Nagy, 2002; Scarpello & Campbell, 1983). The scores of single items can also be more easily interpreted (Nagy, 2002). This may facilitate communication to usability practitioners.
Several single-item scales have been successfully used in different domains, such as organisational psychology (e.g. to measure job satisfaction, Nagy, 2002), personality and social psychology (e.g. to measure global self-esteem, Robins et al., 2001) and clinical psychology (e.g. to measure depressive mood in patients with anxiety disorders, Mckenzie & Marks, 1999). For the evaluation of usability, single items were also used. Christophersen and Konradt (2011) developed and validated a single item that measured the usability of online stores. Tractinsky et al. (2000) used a single-item scale for the usability evaluation of cash machine displays. Further single-item measures were developed with regard to usability test difficulty, e.g. UME (Usability Magnitude Estimation) and SMEQ (Subjective Mental Effort Question, Sauro & Dumas, 2009), or SEQ (Single Ease Question, Sauro, 2012).
1.3 Measuring psychological constructs by using pictorial scales
Apart from the use of lengthy questionnaires, the language-based nature of the measurement may also be associated with problems. First, users may have poor reading skills (e.g. due to low levels of education). Second, users may have insufficient competence levels in the language of the
questionnaire (e.g. non-native speakers). In both cases, errors may emerge due to misinterpretation of the item’s wording, resulting in an erroneous selection of the answer (Kunin, 1955). For example, such problems were found in a study examining the comprehensibility of the System Usability Scale (Finstad, 2006). It emerged that the word ‘cumbersome’ was not understood by about a quarter of non-native English-speaking participants, resulting in poorer validity and reliability scores.
A further problem is related to the widespread translation of questionnaires into other languages. To ensure the validity of a translated instrument, vocabulary equivalence to the original language is needed, which can be obtained by using approaches like translating and back-translating the instrument by persons familiar with the language and the culture (Sekaran, 1983; Walsh & Beatty, 2007). It is questionable if such approaches are commonly used since the translation procedure is rarely specified in publications. This makes it difficult to assess the quality of the translated instrument. Besides questions surrounding the accuracy of translations, there is not always an
appropriate one-to-one translation for some terms, such as those describing emotion (Desmet, 2003). Given the difficulties associated with using verbal scales, pictorial instruments have been developed for a wide range of application areas. Around 60 years ago, Kunin (1955) already introduced a pictorial scale to assess employee attitudes (e.g. towards changes in policy or
procedures). Since then, further pictorial instruments were created for different applications. In the medical field, facial scales were used to assess pain (Bieri et al., 1990) and patient mood (Lorish & Maisiak, 1986). For the assessment of children, scales were developed to capture fear (Muris et al., 2003), mental disorders (Valla et al., 1994) or even the degree of nausea (Baxter et al., 2011). In emotion research, a pictorial scale was developed to measure dimensions of emotion with a manikin (SAM, Self-Assessment Manikin, Bradley & Lang, 1994). The original SAM triggered further developments such as an animated version of it (Sonderegger et al., 2016) or a pictorial instrument to measure spatial presence (Presence SAM, Weibel et al., 2015; Wissmath et al., 2010). In the context of
4
consumer good evaluation, product-related emotions are measured by using pictorial scales such as PREMO (Product Emotion Measurement Tool, Desmet, 2003) and LEMtool (Layered Emotion Measurement Tool, Capota et al., 2007).
The research literature provides a number of advantages for using pictorial scales. First, there is no need for respondents to translate the words from a verbal questionnaire into their feelings or thoughts, eliminating a potential source of distortion (Kunin, 1955). Some authors argue that pictorial scales have a higher level of validity in comparison with verbal instruments since there are no words that have to be interpreted (Bradley & Lang, 1994). Therefore, the subjective experience is more closely reflected by a visual item since it permits the respondent to focus more on the actual sensation than on the stimulus characteristics. Further advantages are the easiness and intuitiveness of pictorial scales, which make them comprehensible even for children and for people speaking another language (Bradley & Lang, 1994; Wissmath et al., 2010). While it is generally assumed that pictorial scales are culture-free so that they can be easily used across language borders (Bradley & Lang, 1994), the suitability for specific cultures needs to be verified because the scale may contain elements like hand gestures or emotional expressions that are not universally interpreted the same way across cultures.
2 Overview of development and validation of a pictorial usability scale
The present article reports the development of a pictorial one-item scale for the evaluation of perceived usability. The instrument is called Pictorial Single-Item Usability Scale (PSIUS). This pictorial single-item scale aims to overcome the two principal problems associated with conventional usability questionnaires. It was designed to be short and non-verbal, aiming for a validity level of similar magnitude as found for established verbal scales. It aimed to provide practitioners and researcher alike with a non-verbal alternative to the instruments currently available for capturing a summative impression of perceived usability.The PSIUS aims to measure perceived usability by means of one item that assesses user satisfaction with a technical device. We are aware that satisfaction represents only one of the three components of the usability concept. For the sake of simplicity, we refer to our scale in this article as a perceived usability scale. Such a more liberal understanding of the concept of perceived usability appears to be common practice. In the subsequent sections, the different versions of the PSIUS and the distinct steps of scale development are described in detail.
2.1 Major steps in scale development and validation
During scale development, we followed the principles of user-centred design (Gould & Lewis, 1985; ISO 9241-210, 2015). The iterative design process consisted of several steps, which combined techniques and methods that are used in two fields: questionnaire development (e.g. validation studies) and usability testing (e.g. thinking aloud technique).
The scale development process was divided into two phases: (1) Initial scale construction and evaluation, and (2) iterative scale refinement and evaluation. Five methodological steps were used in these phases: (a) item generation, (b) expert reviews, (c) think-aloud protocols (d) validation studies and (e) user feedback. Item generation and validation studies followed the typical procedures applied in scale development (e.g. Minge & Riedel, 2013; Moshagen & Thielsch, 2010). Expert reviews, think-aloud protocols and user feedback were adapted from best practices used in usability and design evaluation. An overview of the design phases and methods applied is provided in table 1.
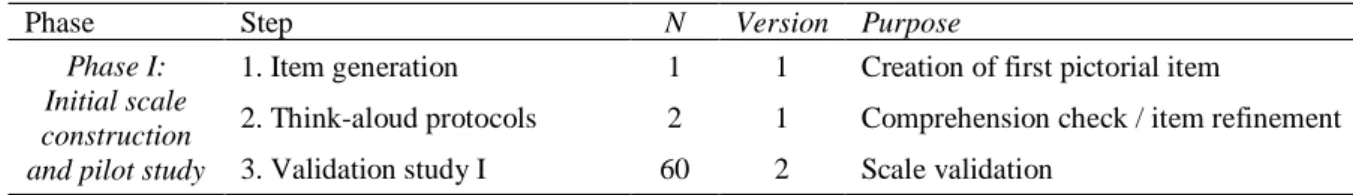
Table 1: Overview of iterative process of PSIUS development comprising 7 steps. Phase Step N Version Purpose
Phase I: Initial scale construction and pilot study
1. Item generation 1 1 Creation of first pictorial item
2. Think-aloud protocols 2 1 Comprehension check / item refinement 3. Validation study I 60 2 Scale validation
5
Phase II: Iterative scale refinement and evaluation
4. Expert review 6 3, 4, 5 Item refinement
5.Think-aloud protocols 10 5, 6 Comprehension check / item refinement 6. Validation study II 38 7 Scale validation
7. User feedback 38 7 Comprehension check
Item generation. The initial item generation was about collecting ideas for an adequate visual
representation of the scale. The team involved in this process consisted of three members of the research group. The focus was to define the key elements of the pictorial scale and to generate a first version of the pictorial scale.
Expert reviews (or expert-based heuristic evaluation). Several expert reviews were conducted
at the beginning of the second phase to collect ideas for scale enhancements to improve its
comprehensibility. This method is based on expert-based heuristic evaluation (Korhonen et al., 2009; Nielsen & Molich, 1990). The team involved in these reviews consisted of four experts in the domain of work psychology (half of them were also usability practitioners) and one expert in design.
Think-aloud protocols. Think-aloud protocols (e.g. Lewis & Mack, 1982) were carried out to
check for content validity by testing the interpretation of the pictorial scale directly with test users. Participants were given a copy of the scale and were asked to verbalise what they saw and how they understood the depictions. A facilitator took notes during the session.
Validation studies. Two studies were carried out to test the scale for sensitivity (using an
experimental setting) and three types of validity (i.e. convergent, divergent and criterion-related).
Sensitivity refers to the capability of an instrument to detect ‘appropriate differences’ with an
instrument (Lewis, 2002, p. 465), such as discriminating between different levels of usability. It was assessed in both studies by experimentally manipulating the usability levels (low vs. high).
Convergent validity refers to the idea that when two independent instruments measure the same
construct, strong correlations between the two instruments are to be expected (e.g. Messick, 1979). It was assessed by comparing the PSIUS with established verbal instruments that aim to measure the same construct. Divergent validity refers to the idea that a newly developed instrument should not correlate strongly with a theoretically unrelated construct (e.g. Messick, 1979). It was assessed by comparing the PSIUS with established instruments that measure dissimilar constructs (e.g. visual aesthetics). Criterion-related validity refers to ‘the relationship between a measure and another independent measure’ (Hinkin, 1995, p. 968). It was assessed by correlating the ratings of the PSIUS with objective performance measures as external criteria. Medium-sized correlations were expected since previous meta-analyses showed mixed results with regard to the relationship between subjective and objective measures of usability (Hornbæk & Law, 2007; Nielsen & Levy, 1994).
User feedback. Written subjective reports were obtained after participants had completed the
second validation study by asking the participants to write down a brief statement of their subjective interpretation of the scale (‘Please describe in one sentence, how you understood the illustration on the previous page’). Obtaining user feedback is an important method in usability assessment (Nielsen, 1994), which represents a good complement to user testing or, in the present case, to validation studies. User feedback served primarily as an indicator for the degree of comprehension of the scale.
2.2 Measures and instruments
Eight verbal questionnaires (including single-item and multiple-item measures) were administered in the two validation studies, providing measures for convergent and divergent validity (see next paragraphs). The main instrument to assess convergent validity was the SUS (System Usability Scale, Brooke, 1996), serving as a benchmark for perceived usability. Additionally,
performance measures were included to assess criterion-related validity. The single-item approach was chosen because of time constraints. All verbal instruments were administered via computer. Since the studies were conducted using a German-speaking sample, all instruments were administered in
6
German language. The wording of the items of all instruments was slightly modified, replacing the term ‘system’ with the name of the device tested (e.g. ‘coffee machine’).
2.2.1 Measures and instruments assessing convergent validity
System Usability Scale (SUS). The SUS (Brooke, 1996) consists of 10 items and is a
well-established verbal instrument for assessing the subjective perception of usability after product usage. Items are rated on a five-point Likert scale (1 = strongly agree; 5 = strongly disagree), which results in a score between 0 and 100. A high internal consistency of the questionnaire (Cronbach’s α > .91) was found in a study of Bangor et al. (2009), analysing aggregated SUS data over about ten years. This questionnaire served in the present study as a benchmark, against which the PSIUS was evaluated.
Post-Study System Usability Questionnaire (PSSUQ). The PSSUQ (Lewis, 1995) is a verbal
instrument for assessing user satisfaction in the context of usability. The 19 items are rated on a seven-point Likert scale (1 = strongly agree; 7 = strongly disagree). The scale enjoys an excellent internal consistency (Cronbach’s α > = .91; Lewis, 2002). The PSSUQ was used in the second study as an additional measure of perceived usability.
Satisfaction with the device (single item). Since satisfaction is an important element of the
PSIUS, the item allows to estimate how strongly it is represented in the PSIUS. The wording of the item was as follows: ‘All in all, I am very satisfied with the use of the coffee machine’. The item was rated on a seven-point Likert scale (1 = strongly agree; 7 = strongly disagree).
Pleasure of using device (single item). The item for pleasure was used as an additional
measure for satisfaction and positive emotions, which are also expressed by the pictographic
representations of the PSIUS in form of a smiling face. The wording of the item was as follows: ‘All in all, I really enjoyed using the coffee machine’. The item was rated on a seven-point Likert scale (1 = strongly agree; 7 = strongly disagree).
Intention to buy device (single item). Several authors demonstrated empirically that perceived
usability (or related concepts such as ease of use and usefulness) positively influenced the intention to buy (Christophersen & Konradt, 2011; Gefen & Straub, 2000; Muthitacharoen et al., 2006). A single item measuring the construct was added as an additional variable for convergent validity. The wording of the item was as follows: ‘If money did not matter, I would buy this coffee machine’. The item was rated on a seven-point Likert scale (1 = strongly agree; 7 = strongly disagree).
2.2.2 Measures and instruments assessing divergent validity
International Positive and Negative Affect Schedule – Short Form (I-PANAS-SF). To measure
different aspects of emotion, the short version of I-PANAS-SF (Thompson, 2007) was used. It is based on the original PANAS from Watson et al. (1988), but uses only half of the 20 adjectives from the original scale. Participants are asked how they feel right now, rating each item on a five-point Likert scale (1 = not at all; 5 = strongly disagree). The psychometric properties of the questionnaire were found to be good in several studies (N=1789) (Cronbach’s α =.78 for positive affect, α = .76 for negative affect; Thompson, 2007).
Self-assessment manikin (SAM). The second instrument used for measuring emotion was the
SAM (Bradley & Lang, 1994). It consists of three dimensions (valence, arousal and dominance) that are depicted with manikins. Each dimension has five scale points that are visually represented, ranging from low to high level of intensity. According to Bradley and Lang, high correlations with the
semantic differential scale for picture ratings of Mehrabian and Russell (1974) were found (r = .96 for pleasure and r = .95 for arousal). For the purpose of our studies, only the dimensions valence and arousal were employed.
Aesthetic appeal of device (single item). Because of time constraints, the visual aesthetics of
the device was assessed by using a single item. The wording was as follows: ‘I found this coffee machine visually appealing’. The scale was slightly adapted from a one-item scale used in a previous study (Sonderegger & Sauer, 2009).
7
2.2.3 Measures assessing criterion-related validity
Performance. Two performance measures were used as an external criterion: (1) task
completion time (s) was recorded and (2) the number of user interactions was measured by counting each user manipulation of the system.
2.3 Data analysis
Data were analysed using comparisons of group means and correlational analyses. Non-parametric tests were applied when the requirements for Non-parametric tests were not met. Comparisons of group means were used to test whether the manipulation of usability succeeded and whether the scale was sensitive enough to distinguish between low and high-usability groups. Correlation analyses were used to determine the level of convergent, divergent and criterion-related validity (see 2.1). The interpretation of the effect size r was based on the recommendation of Cohen (1988), describing sizes of r = .10 as small, r = .30 as medium and r = .50 as large effects. Since we compared a newly developed instrument to an existing one, we would have expected higher correlations than r = .50 for convergent measures to demonstrate that they really measured the same construct. A minimum coefficient of r = .50 was also expected for convergent validity in a similar study, in which a questionnaire was developed for measuring aesthetics in the field of human-computer interaction (Moshagen & Thielsch, 2013).
2.4 Overview of scale versions
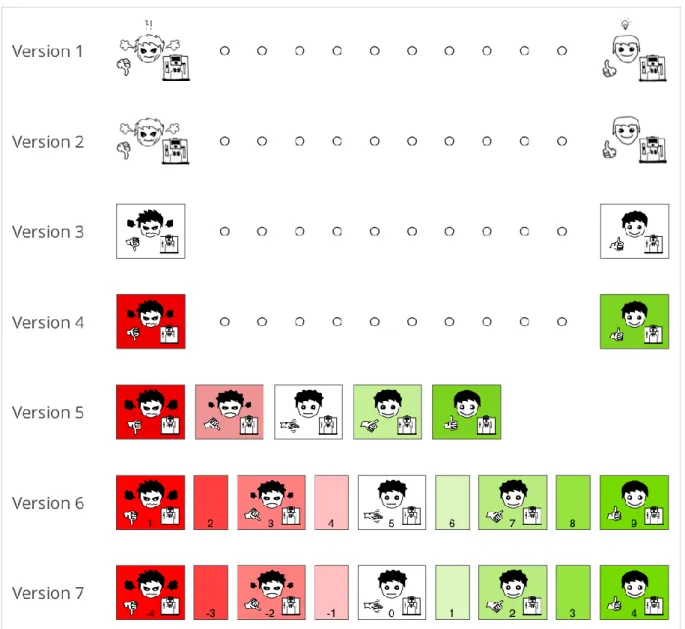
During the scale development process, seven versions of the scale were produced. Figure 1 provides an overview of how the different versions of the scale progressed in the iterative design cycle. Versions 1 and 2 were hand-drawn sketches consisting of two pictorials with several visual cues, representing the extreme-points on a bipolar 10-point Likert scale. Version 3 used the same set of cues as version 2, but it was styled with a piece of software for digital design, called Sketch (www.sketchapp.com). Version 4 was modified by using background colour. Version 5 was enlarged to five pictorials (rather than two) to provide the participant with more visual information about the intermediate levels. In version 6, four additional intermediate levels without pictorials were added, resulting in a nine-point scale numbered from 1 to 9. Version 7 has the same set of visual cues as version 6, but the scale numbers range from –4 to +4.
8
Figure 1: Overview of scale development process illustrating the developed versions of the scale (versions 4 to 7 are coloured).
2.5 Visual elements used for scale representation
Several visual elements were used to convey the meaning of the scale. Figure 1 shows how elements and scale evolved during the development process. Figure 2 shows version 7 of the scale, which consists of five elements: (1) satisfaction with the system, (2) emotions experienced during system use, (3) system to be evaluated, (4) scale number and (5) background colour. Since these elements are expected to have a considerable influence on the psychometric properties of the scale, they are described in more detail.
9
The elements 1-3 represent the core elements that are necessary to interpret the meaning of the scale. Elements 4 and 5 provide additional cues. (1) Satisfaction is represented by a hand gesture (e.g. thumbs up, thumbs down), which was according to widespread interpretation already used in ancient times to signal approbation and disapprobation, respectively (Desmond et al., 1979). The gesture has become very popular during the last decade through social network services used all over the world. Therefore we consider this gesture as comprehensible for a large portion of potential users, even if cross-cultural differences might occur (see general discussion). (2) Emotions experienced during system use are represented by the head of a manikin, containing the following four components: (a) shape of mouth (happy vs. angry), (b) shape of hair (rounded vs. angular), (c) size of eyes (small vs. large), and (d) steam-clouds as a cue for the negative extreme point symbolising anger (see figure 2). All these elements vary in their appearance (depending on the position on the bipolar scale). (3) The picture shows the specific device to be evaluated (e.g. an automated coffee machine). The depiction of the device needs to be replaced if another device is to be evaluated. (4) Scale numbers were provided (-4 to +4) to give the respondent an additional quantitative cue (e.g. for colour-blind people, it offers an additional cue being better able to distinguish between categories). (5) The background colour was included to help distinguish between the options. Green was chosen for good usability, red for poor usability, and the middle category remained white representing a neutral response. The use of green and red as signal colours is an established standard in web form design, indicating whether a field entry is correct or not (e.g. Wroblewski, 2008). The intensity of the colours was increased towards the extreme points.
In versions 5, 6 and 7, all elements (except for system to be evaluated) rely on the principle of applying Weber’s law by using geometric progression, which stresses that a ‘[…] noticeable stimulus increment is a constant proportion of stimulus magnitude’ (Kunin, 1955, p. 69). By providing visual information for the intermediate levels we aimed to reduce the respondent’s cognitive effort and to facilitate the direct comparison of the visual depiction with the current state of the respondent (e.g. to obtain a better fit between the respondent’s mental model and the answer option of the scale chosen).
3 Phase I: Initial scale construction and pilot study
3.1 Item generation and think-aloud protocol
As a first step in the iterative design process, we aimed to create a version of the pictorial scale that was capable of measuring perceived usability. This was done by members of the research team collecting ideas for visual elements. These first drawings were subsequently refined during several sessions, resulting in a first hand-drawn artefact (version 1). It consisted of the three core elements (device, thumbs-up/down gesture, emotional expression) and some additional elements to increase the meaning of the scale (e.g. question mark for the negative pole, light bulb for the positive pole). The thinking aloud technique was used to gain an understanding of how comprehensible the scale was. Two student participants were recruited to ask them for feedback on the first version of the scale. Both participants reported that most aspects of the scale had been comprehensible, but they did not understand two of the symbols (i.e. light bulb and question mark). Therefore, the scale was adapted by removing the two symbols, resulting in version 2 of the PSIUS.
3.2 Validation Study I
3.2.1 Goal of the study
The validity of version 2 of the PSIUS was examined as part of an experiment, in which the usability of a consumer product (highly automated coffee machine) was evaluated (Baumgartner et al., under review). The study intended to determine whether gustatory aesthetics influences outcome variables of usability tests that are conceptually independent of aesthetics (such perceived usability, performance, etc.). First, participants completed various tasks with the coffee machine and tasted and rated coffee. Secondly, they evaluated the system with regard to usability.
10
The PSIUS was included in the experimental procedure with a view to validating it against the SUS, a well-established verbal instrument, serving as the main convergent validity measure for perceived usability. Further variables were measured to estimate divergent and criterion-related validity. Since the coffee machine’s usability was varied in this experiment, it was also possible to check for sensitivity of the PSIUS distinguishing between low and high-usability devices.
3.2.2 Method
Participants. Sixty students (81.7% female) participated in this study. Participants were
recruited from the department of psychology (95%) and other departments of the University of
Fribourg and did not have specific knowledge of HCI and usability. Participants were aged between 18 and 29 years (M = 20.83, SD = 1.70). Psychology students earned course credits for their participation whereas the other participants received a coffee-to-go.
Experimental design. A 2 x 2 factorial between-subjects design was employed, using system
usability and gustatory aesthetics as independent factors. System usability (high vs. low) was
manipulated by using system shutdowns and impossible tasks in the low-usability condition. Gustatory aesthetics was manipulated by varying the extent to which participants like the coffee being served (favourite coffee vs. least preferred coffee).
Materials and measures. In this study, version 2 of the PSIUS was used (see figure 1, version
2). The original paper-based sketch was digitised and included in the post-study questionnaires. A 10-point Likert scale was used to offer the respondents enough response options. The instruction read as follows: ‘Please choose the answer that fits best in your opinion’. To determine the three types of validity, several constructs were captured (for details see 2.2). Measures of convergent validity focused on the evaluation of perceived usability (SUS, single items for satisfaction, pleasure of using device and intention to buy). With regard to divergent validity, emotion (I-PANAS-SF and SAM) and aesthetic appeal (single item) were assessed. Criterion-related validity was assessed by measuring performance (task completion time, total number of user interactions).
Procedure. Each of the sixty participants was tested separately in a laboratory, equipped with
a highly automated coffee machine and a personal computer. After filling in a form of informed consent, the participants carried out seven tasks using the coffee machine, consisting of (1) Change the default screen wallpaper to one of your choice; (2) Find out how many portions of milk have already been prepared by the machine; (3) Change screen wallpaper to default settings; (4) Change settings to energy saving mode; (5) Find out whether some maintenance work is required on the machine; (6) Change settings from energy saving mode to default settings; and (7) prepare an espresso using the main menu. Half of the participants used a device that was unreliable and switched off automatically on several occasions (low-usability group). The other half operated a fully reliable coffee machine (high-usability group). After task completion, participants filled in several verbal questionnaires (c.f. 2.2). The PSIUS was administered in the end after the verbal questionnaires.
3.2.3 Results
Sensitivity. To examine whether the instruments were sufficiently sensitive to distinguish
between low and high-usability conditions, Mann-Whitney test was conducted for PSIUS since normality was not obtained, and t-test was carried out for SUS. With regard to PSIUS, higher scores were recorded in the high-usability group than in the low-usability group (Mdnhigh = 36.72, Mdnlow =
24.28, U = 636.50, z = 2.76, p = .004, r = 0.36). Importantly, the same pattern was also observed for the SUS (Mhigh = 64.08, SDhigh = 19.07, Mlow = 50.33, SDlow = 19.52, t (58) = 2.760, p = .008, r = 0.34).
These results showed that the usability manipulation succeeded and suggested that both, the well-established SUS and the newly developed PSIUS, were equally well suited to distinguish between conditions of high and low-usability.
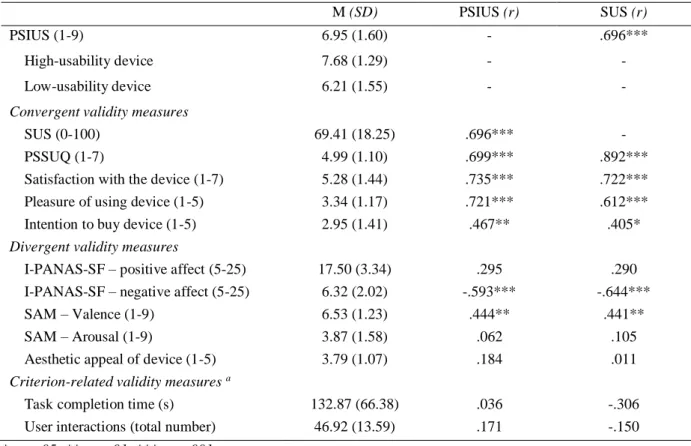
Table 2: Descriptive data and correlations between PSIUS, SUS and measures of convergent, divergent and criterion-related validity (N=60).
M (SD) PSIUS (r) SUS (r)
11
High-usability device 7.23 (2.15) - - Low-usability device 5.43 (2.50) - -
Convergent validity measures
SUS (0-100) 57.21 (20.35) .881*** - Satisfaction with the device (1-5) 3.30 (1.18) .756*** .782*** Pleasure of using device (1-5) 3.08 (1.28) .712*** .766*** Intention to buy device (1-5) 3.08 (1.40) .712*** .676***
Divergent validity measures
I-PANAS-SF – PA (5-25) 16.80 (2.81) .425** .423** I-PANAS-SF – NA (5-25) 6.48 (1.81) -.429** -.495*** SAM – Valence (1-9) 6.62 (1.55) .474*** .592*** SAM – Arousal (1-9) 4.17 (1.56) -.163 -.142 Aesthetic appeal of device (1-5) 3.75 (1.08) .258* .339**
Criterion-related validity measures
Task completion time (s) 151.75 (59.54) -.299* -.353** User interactions (total number) 55.93 (15.49) -.331** -.383**
* p < .05; ** p < .01; *** p < .001
Convergent validity. We conducted a correlational analysis to assess the convergent validity of
PSIUS. This analysis revealed a very strong correlation between PSIUS and SUS (see table 2). Likewise, high correlations were observed for the three single items satisfaction, pleasure and
intention to buy (all r > .70). The analysis also showed similar correlation coefficients of the SUS with the single-item scales. Overall, these results indicate high levels of convergent validity for the PSIUS.
Divergent validity. As table 2 shows, medium-sized correlations indicating divergent validity
levels were observed between PSIUS and measures of emotion (all r < .50). The arousal component showed no correlation and the item for aesthetic appeal revealed a low correlation (r < .30). In general, all divergent measures have smaller correlations with the PSIUS than the convergent measures. A similar pattern was observed between SUS and divergent constructs, but with slightly higher correlations for valence and aesthetic appeal.
Criterion-related validity. For criterion-related validity (see table 2), low negative correlations
were observed between PSIUS and task completion time and number of user interactions. Correlations of a similar magnitude were observed between SUS and those two performance measures.
3.3 Discussion
The results of the first phase indicated that the visual elements developed during item generation obtained a satisfactory level of comprehensibility. This was confirmed by the first validation study, which revealed promising findings with regard to four criteria.
First, PSIUS ratings showed significant differences in low-usability and high-usability group, which indicated that the manipulation of usability was successful, with the scale being sufficiently sensitive to the manipulation. Second, there were high correlations between PSIUS and SUS. Such high correlations were also found between PSIUS and the other convergent validity measures, with the coefficients being of similar magnitude as the correlations between the established instrument SUS and convergent validity measures. Overall, this suggests high convergent validity of the pictorial scale. Third, medium-sized correlations were found for emotion and aesthetics as the two main concepts capturing divergent validity. One measure of divergent validity (i.e. arousal dimension of the SAM as a sub-dimension of emotion) showed even a non-significant correlation. Overall, this appears to be an acceptable outcome for divergent validity given that there is some overlap between concepts such as aesthetics and usability (e.g. Tractinsky et al., 2000) or emotion and usability (Thüring & Mahlke, 2007), respectively. This issue is taken up again in the general discussion. Fourth, we found significant medium-sized correlations between both performance measures and the PSIUS. This suggests a
12
satisfactory level of criterion-related validity. Again, the correlation coefficient between the
benchmark scale SUS and the measures of criterion-related validity were of similar magnitude. It was expected that correlation coefficients for this form of validity would be lower than for convergent validity.
Finally, it is important to note that similar correlations of PSIUS and SUS were observed for all measures of validity. This similar overall pattern might indicate that PSIUS assesses the same
construct as the SUS.
4 Phase II: Iterative scale refinement and evaluation
4.1 Expert reviews
Since the first validation study showed promising results, we decided to refine the hand-drawn scale (i.e. version 2) in iterative steps by giving it a more professional look while leaving its basic visual elements unchanged. The adaptations from version 3 to versions 4 and 5 were based on the outcomes of several meetings with four usability experts and advice received from discussions with a design expert.
An important change in version 4 was the use of signal colours. Red colour was used to highlight the negative extreme point and green to emphasise the positive extreme point. The most crucial change in scale version 5 was to visualise the intermediate levels of the scale, adding a
gradation in colour intensity. In order to avoid visual clutter we decided to use five levels, resulting in a five-point scale.
4.2 Think-aloud protocols
First set. To evaluate comprehensibility of scale version 5 , the thinking aloud technique was
employed using a sample of five test users with heterogeneous professional backgrounds (student in communication studies, computer scientist, physiotherapist, kindergarten teacher, housewife). The thinking aloud technique followed a standardized procedure, which was divided in two parts: initial exposure phase and item evaluation phase. This approach was already used by Weibel et al. (2015) to test the comprehension of pictorial material. In the initial exposure phase, participants were presented the scale and asked to verbalise what they see. Three questions were asked in the following order: ‘What comes to mind when you see this?’, ‘What does this mean to you?’ and ‘To which elements have you paid attention?’. In the item evaluation phase, participants were asked to think of ideas to improve the scale (‘What would you do differently to improve the comprehension of the scale?’). One think-aloud session lasted for about 20 minutes.
Four out of five test users understood correctly the meaning of the scale. Two changes were made, following suggestions from the test users. First, intermediate levels were added to allow ratings between visualised scale points, resulting in a nine-point scale. This suggestion is also in line with recommendations for response options in single-item scales (c.f. Sauro, 2010). Second, scale numbers were added to make the PSIUS more similar to a rating scale.
Second set. The goal of the second think-aloud protocol was to obtain some detailed user
feedback on scale version 6. Five test users were recruited at the department of psychology, thus representing a more homogeneous group of participants. The same approach as in the previous set was used.
All test users understood what the purpose of the scale was. However, they reported that the scale numbers were confusing because the negative pole started with 1. Consequently, in scale version 7 the numbers were changed, ranging from -4 to +4. This better illustrated the negative and positive points of the scale.
13
4.3 Validation Study II
4.3.1 Goal of the study
The validity of version 7 of the PSIUS (see figure 1, version 7) was examined as part of an experiment, in which the usability of a consumer product (highly automated coffee machine) was evaluated (Baumgartner et al., under review). The intention of the study was to determine whether gustatory aesthetics influences outcome variables of usability test that are conceptually independent of aesthetics. First, participants completed various tasks with the coffee machine and tasted and rated coffee. Secondly, they evaluated the system with regard to usability.
The PSIUS was included in the experimental procedure to validating it against the SUS and the PSSUQ, serving as the main convergent validity measures for perceived usability. Further
variables were measured to estimate divergent and criterion-related validity. Since inherent usability of the coffee machine was manipulated experimentally in this study, it was also possible to evaluate sensitivity of the PSIUS distinguishing between low and high-usability devices. Interpretation of the scale was obtained by collecting user feedback in the end of the experiment.
4.3.2 Method
Participants. Thirty-eight students (73.7% female) participated in this study. Participants were
recruited from the department of psychology (15.8%) and other departments of the University of Fribourg. Participants were aged between 19 and 37 years (M = 23.40, SD = 3.39) and had no specific knowledge of HCI or usability. They received 10 Swiss Francs for their participation.
Experimental design. A 2 x 2 factorial between-subjects design was employed, using system
usability and gustatory aesthetics as independent factors. System usability (high vs. low) was manipulated by using system shutdowns in the low-usability condition. Gustatory aesthetics was manipulated by varying the quality of the coffee (high quality coffee vs. poor quality coffee).
Materials. The pictorial scale was adapted by replacing the element ‘system to be evaluated’
(i.e. the depiction of the device showed the coffee machine used). The instructions given to
participants for using the scale were slightly modified, specifying what was to be evaluated: ‘How do you rate the usability of the coffee machine? Please choose the answer that fits best in your opinion. You can also choose a category in between’. This was done because we did not want the participants to focus on the taste of the coffee, which was an important aspect in the study that was measured just before.
Measures. Several constructs were captured to assess the validity of the PSIUS (for details see
2.2). Measures of convergent validity focused on perceived usability or closely related constructs (SUS, PSSUQ, single items for satisfaction, pleasure of using device and intention to buy). With regard to divergent validity, emotion (I-PANAS-SF and SAM) and aesthetic appeal (single item) were assessed. Criterion-related validity was assessed by measuring performance (i.e. task completion time, total number of user interactions).
Procedure. All thirty-eight participants were tested separately in a laboratory, equipped with a
highly automated coffee machine and a personal computer. After filling in a form of informed consent, the participants carried out nine tasks on the coffee machine, consisting of (1) Fill water into the machine up to the required level (warm-up task); (2) Change the default screen wallpaper to one of your choice (power failure in low-usability condition); (3) Check whether some maintenance of the machine is required; (4) Change screen wallpaper to default settings; (5) Change settings to energy saving mode (power failure in low-usability condition); (6) Find out how many portions of milk have already been prepared by the machine; (7) Disable settings of energy saving mode; (8) Check in the menu whether it is necessary to add more coffee beans (impossible task was only presented in low-usability condition); and (9) prepare a specific coffee beverage using the main menu (most or least preferred beverage). Half of the participants used a coffee machine that was unreliable, switching off automatically on several occasions. The other half operated a fully reliable coffee machine. After the tasks had been completed, participants filled in several verbal questionnaires (c.f. 2.2). The PSIUS was
14
administered in the end after the verbal questionnaires. Right after the PSIUS, participants were asked to write down a short description of how they interpreted the scale.
4.3.3 Results
Sensitivity. To examine sensitivity of the instruments, we conducted again Mann-Whitney test
for PSIUS because requirements for normality was not met. T-tests were carried out for the other two instruments. With regard to the PSIUS, higher scores were recorded in the high-usability group than in the low-usability group (Mdnhigh = 25.47, Mdnlow = 13.53, U = 67.00, z = -3.42, p = .001, r = -0.55).
The same pattern was also observed for the SUS (Mhigh = 79.34, SDhigh = 13.46, Mlow = 59.47, SDlow =
17.17, t (36) = 3.970, p = .000, r = 0.54) and the PSSUQ (Mhigh = 5.54, SDhigh = 0.82, Mlow = 4.44,
SDlow = 1.04, t (36) = 3.539, p = .001, r = 0.51). These results suggest that all three instruments are
equally well suited to distinguish between conditions of high and low usability. Furthermore, the results demonstrated that the usability manipulation succeeded, since all instruments show highly significant differences.
Convergent validity. The correlational analysis revealed strong correlations between PSIUS
and SUS but also between PSIUS and PSSUQ (see table 3). Likewise, medium to high correlations were observed with the three single items satisfaction, pleasure (both r > .70) and intention to buy (r > .40). The analysis also showed similarly high correlation coefficients between SUS and convergent measures. Overall, the results indicated high levels of convergent validity for the PSIUS.
Table 3: Descriptive data and correlations between PSIUS, SUS and measures of convergent, divergent and criterion-related validity (N=38).
M (SD) PSIUS (r) SUS (r)
PSIUS (1-9) 6.95 (1.60) - .696***
High-usability device 7.68 (1.29) - - Low-usability device 6.21 (1.55) - -
Convergent validity measures
SUS (0-100) 69.41 (18.25) .696*** - PSSUQ (1-7) 4.99 (1.10) .699*** .892*** Satisfaction with the device (1-7) 5.28 (1.44) .735*** .722*** Pleasure of using device (1-5) 3.34 (1.17) .721*** .612*** Intention to buy device (1-5) 2.95 (1.41) .467** .405*
Divergent validity measures
I-PANAS-SF – positive affect (5-25) 17.50 (3.34) .295 .290 I-PANAS-SF – negative affect (5-25) 6.32 (2.02) -.593*** -.644*** SAM – Valence (1-9) 6.53 (1.23) .444** .441** SAM – Arousal (1-9) 3.87 (1.58) .062 .105 Aesthetic appeal of device (1-5) 3.79 (1.07) .184 .011
Criterion-related validity measures a
Task completion time (s) 132.87 (66.38) .036 -.306 User interactions (total number) 46.92 (13.59) .171 -.150
* p < .05; ** p < .01; *** p < .001
a N=37
Divergent validity. Correlation coefficients of very different size (ranging from small to large)
were observed between PSIUS and measures of divergent validity (see table 3). All divergent measures show lower correlations to the PSIUS than the convergent measures except negative affect. Furthermore, correlations of the SUS to measures of divergent validity were in a similar range as for the PSIUS.
15
Criterion-related validity. With regard to criterion-related measures, the sample size was
adapted to N=37, since there was one data set missing for technical reasons. No significant
correlations were observed between PSIUS and task completion time and number of user interactions. Correlations for SUS and criterion-related measures were not significant either.
4.4 User feedback
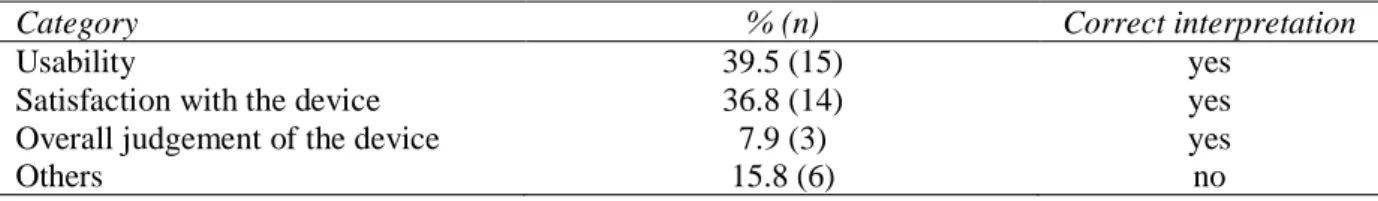
In this study, user feedback was obtained to check the comprehensibility of the scale. Thirty-eight participants were asked to write down a statement of how they interpreted the scale. Table 4 shows the results. It emerged that the vast majority of participants (84.2%) had a correct understanding of the scale. For six participants, it was not entirely clear if they understood the scale. For example, they referred to task difficulty or provided incomprehensible answers. In conclusion, the scale was understood correctly by the vast majority of participants.
Table 4: The four most frequently stated interpretations for the PSIUS (N=38).
Category % (n) Correct interpretation
Usability 39.5 (15) yes
Satisfaction with the device 36.8 (14) yes
Overall judgement of the device 7.9 (3) yes
Others 15.8 (6) no
4.5 Discussion
The second phase of scale development was characterised by major enhancements compared to the previous phase. Several substantial changes were made to the PSIUS. First, following the
outcomes of the expert review, it involved a change from a black and white scale to a coloured one (i.e. from version 3 to version 4, see figure 1), with colour representing a further element that
contributed to a better understanding of the scale. Second, due to the expert review, additional pictures were inserted at the intermediate points of the scale (rather than placing them only at the end points). This additional information may have had similar positive effects like labelling intermediate points of verbal scales. Third, the feedback from the first set of think-aloud protocols resulted in an enlargement from a five-point to nine-point scale (i.e. from version 5 to version 6 in Figure 1), which allowed users to make more fine-tuned responses. This change was also conform with recommendations of e.g. Sauro (2010) who suggests using 7, 9 or 11 response options for single-item questionnaires. The second set of think-aloud protocols suggested that a minor change should be made to the numeric scale labelling (compare version 6 to version 7 in Figure 1). This would more clearly indicate the negative end of the scale because numbers with a minus sign are used.
The second validation study provided a similar pattern like the previous one. Again, the
sensitivity analysis revealed that the PSIUS picked up differences in usability levels. Furthermore, the scores of PSIUS were very similar to those of the reference questionnaires SUS and PSSUQ, which indicated satisfactory sensitivity for the PSIUS. The convergent validity of the PSIUS was not only high with regard to the benchmark questionnaires, it was also high for the single-item scales being used as further measures of convergent validity. For divergent validity, the correlation coefficients indicated a rather inconsistent pattern, ranging from very small coefficients (e.g. arousal) to large ones (e.g. negative affect). A possible reason for this high correlations on negative affect is the degree of frustration that participants in the low-usability condition were exposed while doing the tasks. Again, the validity scores between PSIUS and SUS were of similar size. With regard to criterion-related validity, the results showed for both performance measures non-significant correlations. Given that the correlation coefficients between the SUS (as the benchmark scale) and the two performance measures were non-significant as well, it reiterates the difficulties of obtaining good scores for criterion-related validity. Overall, this may be interpreted as indications of a satisfactory criterion-related validity score. The last step in the design cycle also provided encouraging results since most of the participants understood the meaning of the scale. This result was also influenced by the leading question in the instruction.
16
5 General discussion
The findings of the present work are encouraging regarding the potential of the PSIUS as a short non-verbal instrument for measuring perceived usability. With regard to its sensitivity, the PSIUS demonstrated that it has been able to distinguish well between high and low usability. As expected, the coefficients for convergent validity were considerably higher than they were for divergent validity, with both coefficients being similar for the PSIUS and the verbal scales used as benchmarks. Furthermore, the results for criterion-related validity (although only being of medium size) were of similar magnitude as for the established standard scales.
The data reported from our experimental work indicated sufficient sensitivity of the PSIUS in distinguishing between high and low usability of the device examined. The level of sensitivity demonstrated for the PSIUS was comparable in magnitude to the sensitivity of the established scales used in our experimental work. The results of the sensitivity analysis provide further support for argument that the PSIUS enjoys satisfactory psychometric properties. It has to be noted that sensitivity as an additional quality criterion for a scale is often not measured in scale development.
With regard to convergent validity, in both studies the PSIUS showed correlations with the SUS (as the verbal scale against which the pictorial scale was tested) of such size that it can be considered a large effect (following the recommendations of Cohen, 1988). Other convergent measures (i.e. PSSUQ, single items for pleasure and satisfaction) showed correlations of a similar magnitude. Overall, we obtained satisfactory convergent validity coefficients. They were of similar magnitude as those reported in other work in the field of usability and user experience. For example, Moshagen and Thielsch (2010) reported convergent validity coefficients in the range of r = .62 to r = .80, whereas slightly smaller convergent validity coefficients were obtained by Christophersen and Konradt (2011), ranging from r = .53 to r = .62.
The results for divergent validity showed overall smaller correlation coefficients than for the constructs capturing convergent validity. Despite being smaller in magnitude, they were statistically significant in about half of the cases. One would expect divergent validity coefficients to be rather small since they refer to unrelated constructs. The medium-sized coefficients found in the present case may indicate some common denominator between usability constructs and the other constructs used to determine divergent validity. In usability research, it emerged some overlap between concepts that were expected to be independent of each other from a theoretical point of view, but which seem to be related (e.g., perceived usability and aesthetics). A number of studies have demonstrated a sizeable relationship between perceived usability and aesthetics (De Angeli, Sutcliffe, & Hartmann, 2006; Sonderegger & Sauer, 2010; Thielsch, Blotenberg, & Jaron, 2014; Tractinsky et al., 2000) or affective states (Thüring & Mahlke, 2007), respectively. Due to these commonalities between concepts, one cannot expect that very low correlation coefficients (let alone zero correlations) would emerge for divergent validity. Given this conceptual overlap, we consider the size of the correlations to be acceptable (c.f. Lavie & Tractinsky, 2004). Nevertheless, future studies should consider measures for divergent validity that are conceptually unrelated.
The coefficients for criterion-related validity were generally smaller than for convergent quality. This corresponds to a typical finding in validity research, showing that measures of convergent validity display higher correlations than measures of criterion-related validity. For example, Minge and Riedel (2013) found a medium-sized correlation (r = .34) between perceived usability and user performance (number of completed tasks). Nevertheless, research shows mixed findings with regard to the relationship between subjective and objective usability measures. A meta-analysis from Nielsen and Levy (1994) indicated medium to large positive associations between task performance and subjective preference (completion time r = .35; error rates r = .40). Similarly, Sauro and Lewis (2009) reported substantial correlations for prototypical usability metrics at task-level for a dataset with 90 distinct usability tests (task times, completion rates, errors, post-task satisfaction, and post-test satisfaction; between r = .44 and r =.60). However, when using test-level ratings correlations were somewhat lower (between r = .16 and r =.24). Another meta-analysis by Hornbaek and Law (2007) demonstrated a rather weak relationship between efficiency and satisfaction (r = .196 ± .064) and between effectiveness and satisfaction (r = .164 ± .062). In our findings, the correlation
17
coefficients observed in the present studies were in a similar range as results reported in the meta-analyses of Hornbaek and Law (2007) and Sauro and Lewis (2009). Overall, we consider the criterion-related validity of the PSIUS to be satisfactory given the results of previous work and the correlation coefficients found for the scales used as benchmarks in the present work.
The following points may be considered limitations of the present work. (a) The common method bias may have influenced the results. The same user evaluated the system by using a questionnaire and a pictorial scale. This may have overestimated the validity of the PSIUS since the preceding verbal questionnaire may have served as a prompt. Although this seems to be quite a common limitation in validation studies of this kind (e.g. Lorish & Maisiak, 1986; Weibel et al., 2015), future research may wish to compare the set-up used in the current study (i.e. administrating the PSIUS and the verbal benchmark scale in the same study) with a set-up in which only the PSIUS is administered. This would allow us to estimate the influence of the common method bias. (b) In the present work, a rather homogeneous and highly educated sample of university students was used. This may have resulted in higher coefficients of convergent validity (because students were better able to understand the meaning of the scale) than we would have achieved with a more heterogeneous sample. In addition, the majority of the participants were female. Therefore, the PSIUS should be tested in future studies to what extent the scale works for more heterogeneous groups. (c) The PSIUS is considered to represent an overall rating, therefore is was presented in each study in the end. As a consequence, verbal usability questionnaires and PSIUS were not administered in a randomised order, which could have led to a potential order effect. Future studies should consider using randomisation to eliminate this type of bias. (d) An inherent characteristic and at the same time a limitation of the PSIUS is the use of three visual elements (satisfaction with the system, emotions experienced during system use and system to be evaluated) merged in one item, which can be seen as a double-barrelled question. In designing pictorial scales, we have more constraints and only visual means to convey meaning compared to verbal items. Therefore we use design principles that are often applied in comics such as overlap, redundancy and exaggeration to convey meaning (Eisner, 1985). Comprehensibility is a crucial requirement and therefore we were obliged to combine multiple aspects to obtain a
comprehensible and intuitive scale. Therefore we argue that not all rules for verbal scale development apply for pictorial scales. (e) One obvious limitation with regard to the scale is that the ‘system to be evaluated’ has to be updated each time a new device is tested. This issue can be resolved by 1) providing a generic template of the scale where the device can be added easily by an adequate
representation of the device or 2) by providing scales with various devices. (f) Further concerns might be raised with regard to the universality of the scale across cultures. There are parts in the world in which the thumbs-up gesture is considered rather offensive, e.g. some Mediterranean regions, parts of western Africa or the middle east (Axtell & Fornwald, 1998; Desmond et al., 1979). Nevertheless, since social network services and internet are widely used in the Western world we expect that users interpret the thumbs-up gesture as intended. In addition, the PSIUS uses this gesture in the context of product evaluation and the opposite gesture (the thumbs-down) is shown too. But we cannot be sure that everyone perceives the thumbs-up the same way. Therefore further research needs to address the question of a universal understanding of the thumb-up sign. (g) Instruments such as PSSUQ (Lewis, 1995) give a formative idea of where possible usability are located (e.g. in the interface), since the instrument covers multiple dimensions (e.g. interface quality). The PSIUS on the other hand gives just a summative impression of the usability of a system. This has clearly its merits in terms of obtaining easily and fast an overall impression of the system, but may be of lesser use with regard to the identification of specific issues.
The present work also pointed out some possibilities for methodological improvements in future scale development. We made use of an iterative approach in scale development. This included the use of various methods (i.e. expert review, thinking aloud technique, user feedback), which are considered to be part of a user-centred design approach. While these methods are frequently employed in formative usability evaluation, they are not typically used in scale development. We would
therefore recommend complementing the classic procedures of scale development (following the principles of psychometric testing) by using elements of formative usability evaluation to obtain valuable feedback for scale improvements.
18
relied on student samples, which is a useful approach in a first step. However, there is clearly a need to test user groups who are expected to benefit particularly from pictorial scales. This includes children, dyslexic users and users with lower levels of education. (b) There are a number of verbal single-item scales that measure Post-Task Usability such as the SMEQ (Sauro & Dumas, 2009) or the SEQ (Sauro, 2012). These instruments are used as repeated measurements after task completion in usability tests. Future research should focus on investigating the link between a pictorial usability scale with verbal single-item measures. (c) Apart from refining the PSIUS in future studies (e.g. by creating simpler pictures, using clearer elements), future work should also explore the possibility of developing other pictorial scales related to usability and user experience (e.g. to measure workload, learnability and flow), and including a wider range of devices. (d) If the development of such pictorial scales proves to be difficult, future work may also envisage making use of animations to show a sequence of pictures. Such animated scales may enjoy higher comprehensibility and may have a motivating effect on users. Another approach may be to develop hybrid scales (pictorial and verbal) by including simple verbal cues in order to overcome ambiguity (e.g. by using keywords). (e) Future research should also address the underlying mechanisms for decoding pictorial scales in more detail. It seems obvious that no translation is needed compared to verbal scales, as Kunin (1955) mentioned, but there is no empirical evidence for that. It can also be assumed that pictorial material needs some kind of
translation to be effectively understood, especially across cultures where perception might be different. The findings of the present work demonstrated that using a pictorial usability scale allows to obtain similar results compared to the use of established verbal instruments. The psychometric properties of PSIUS were satisfactory examined in the context of the two studies outlined in this article. In addition, the work presented an iterative design- and evaluation procedure that combined techniques and methods used in the field of questionnaire development (e.g. validation studies) and usability testing (e.g. thinking aloud technique). Despite the encouraging results, the scale needs more research and further work since just one interactive consumer good was tested and the sample
consisted primarily of students. Nevertheless, we are confident that such a pictorial scale would be a valid enrichment for the toolset of usability practitioners and researchers alike, since it allows to obtain an overall rating of perceived usability in an efficient and nonverbal way.
Acknowledgements
The research was funded by a grant (No 100014_140359) from the Swiss National Science Foundation (SNSF). Their support is gratefully acknowledged. We are grateful to Kim Noémi Buchmüller, Yusuf Arslanparcasi and Larissa Berchtold for their help with data collection. We also like to thank Veronica Solombrino for the design reviews.
6 References
Axtell, R. E., & Fornwald, M. (1998). Gestures: The do’s and taboos of body language around the world.
Bangor, A., Kortum, P., & Miller, J. (2009). Determining what individual SUS scores mean: Adding an adjective rating scale. Journal of Usability Studies, 4(3), 114–123.
Baumgartner, J., Sonderegger, J., & Sauer, J. (2017). Aesthetics of taste in consumer product evaluation, Submitted for publication.
Baxter, A. L., Watcha, M. F., Baxter, W. V., Leong, T., & Wyatt, M. M. (2011). Development and Validation of a Pictorial Nausea Rating Scale for Children. Pediatrics, 127(6), e1542–e1549. https://doi.org/10.1542/peds.2010-1410