Cardiovascular responses to a glucose drink in young male individuals
with overweight/obesity and mild alterations in glucose metabolism,
but without impaired glucose tolerance
Cathriona R. Monnard1 · Erik Konrad Grasser1
Abstract
Purpose Little is known about whether mild aberrations in glucose metabolism, which are seen in overweight/obese subjects (OW/OB) without impaired glucose tolerance, affect regulator control elements for blood pressure homeostasis. Methods Hence, we measured in age-matched male subjects with normal weight (n = 16; BMI = 22.4 kg m−2) and OW/OB (n = 11; BMI = 28.6 kg m−2) continuous beat-to-beat blood pressure, heart rate, stroke volume, myocardial contractility and baroreflex sensitivity during a 30 min baseline and for 120 min after the ingestion of 75 g glucose dissolved in 300 mL tap water (OGTT). Blood samples for the assessment of plasma glucose and insulin were collected at baseline and every 30 min after the drink and homeostatic model assessment of insulin resistance (HOMA-IR) was calculated.
Results At baseline, glucose (5.3 ± 0.4 SD vs 5.0 ± 0.4 mmol L−1; p = 0.01), insulin (7.4 ± 0.4 vs 3.7 ± 2.7 mU L −1; p = 0.02) a nd HOMA-IR (1.8 ± 1.3 vs 0.8 ± 0.6; p = 0.01) were significantly higher in subjects with OW/OB, but none classified as having impaired glucose tolerance (plasma glucose levels < 7.8 mmol L−1 at 120 min post-OGTT) or hypertension (all < 130/80 mmHg at baseline). In response to the glucose drink, and in comparison to subjects with normal weight, we observed in subjects with OW/OB a trend towards increased plasma insulin levels (+7445 ± 4858 vs. +4968 ± 1924 mU h L−1; p = 0.08), which was not seen for blood glucose (p = 0.59). Moreover, subjects with OW/OB showed impaired peripheral vaso-dilation, diminished heart rate and myocardial contractility responses but increased peripheral pulse pressure (all p < 0.05). Conclusions Young male subjects with OW/OB, but without glucose intolerance or hypertension, showed attenuated periph-eral vasodilation and diminished cardiac responses to a glucose drink.
Keywords Sugar · Insulin resistance · Obesity · Blood pressure
Introduction
Currently, cardiovascular diseases are the world’s leading cause of morbidity and mortality [1]. Although high blood pressure is the largest contributor to cardiovascular disease-related mortality (40% of all deaths) [2], overweight and obesity are also significant modifiable risk factors [3, 4]. On one hand, people with overweight and obesity often exhibit signs of impaired glucose metabolism, which can increase the risk of type 2 diabetes mellitus [5], whilst
impaired glucose tolerance and type 2 diabetes mellitus are both major risk factors for cardiovascular diseases [6]. On the other hand, central abdominal obesity (i.e. the excess accumulation of body fat around visceral organs and in close proximity to the liver) might be a powerful candidate for increasing the risk of obesity-related hypertension [7].
In this context, it has recently been suggested that impaired glucose tolerance may adversely affect the cardio-vascular system by impairing glycaemic-induced blood pres-sure regulation [8]. According to this postulation, alterations in glucose metabolism are characterized by elevated levels of insulin and raised sympathetic neural activity at rest [8,
9], an additional surge in insulin secretion following glucose ingestion might then cause further stimulation in sympa-thetic nerve activity with a potential impact on total periph-eral resistance [8, 10]. This, in turn, may lead to diminished peripheral vasodilation that could adversely affect blood
* Erik Konrad Grasser [email protected]
1
Department of Endocrinology, Metabolism and Cardiovascular System, Faculty of Science
and Medicine, University of Fribourg, Chemin du Musée 5, 1700 Fribourg, Switzerland
http://doc.rero.ch
Published in "European Journal of Nutrition doi: 10.1007/s00394-019-02120-3, 2019"
which should be cited to refer to this work.
pressure regulation [8, 10]. However, and to the best of our knowledge, it is currently not known whether early stage aberrations in glucose metabolism, i.e. mild increases in fasting glucose and insulin blood levels, but before impaired glucose tolerance emerges, might adversely affect regulatory control elements for blood pressure homeostasis.
We, therefore, investigated in young male Caucasian subjects with overweight/obesity (body mass index between 25.0 and 34.9 kg m−2) and age-matched Caucasian subjects with normal weight (body mass index between 18.5 and 24.9 kg m−2) hemodynamic and metabolic responses to a glucose drink. We hypothesized that subjects with over-weight/obesity, but without impaired glucose tolerance, display altered glucose metabolism in response to a glucose drink, which consequently affects hemodynamic regulation, characterized by a diminished vasodilatory effect of insulin on peripheral resistance vessels with accompanying cardiac responses.
Methods
Subjects
Taking data from a previously published study from our laboratory [11], we reanalysed data from 24 male Caucasian subjects (six were removed due to impaired glucose toler-ance test) and added data from 3 unpublished obese male Caucasian subjects. Hence, we included 27 subjects in our final analysis for the current paper. Subjects were students (and their friends) recruited from the university surround-ings. Eligibility criteria included: Caucasian, male, healthy, non-smoker, 165–200 cm in height, 20–45 years old with a body mass index ranging from 18.5 to 34.9 kg m−2. Exclu-sion criteria were as follows: individuals with pre-existing disease (i.e. arterial hypertension defined by blood pressure values above 130/80 mmHg [12], type 2 diabetes defined by fasting plasma glucose levels above 7.0 mmol L−1 [13]) or who were taking any medication affecting cardiovascular regulation as well as competition athletes and individuals with a daily exercise workload exceeding 60 min per day. In addition, and after the analysis of the study results, subjects diagnosed with impaired glucose tolerance, based on the following criteria in response to the oral glucose tolerance test, were also excluded: showing either (a) fasting glucose levels ≥ 6.1 mmol L−1 (126 mg dL−1) [13], or (b) 2-h glu-cose ≥ 7.8 mmol L−1 (140 mg dL−1) [13, 14]. This study was conducted according to the guidelines laid down in the Declaration of Helsinki and local ethical committee approval was obtained for all procedures involving human subjects. All subjects provided written consent prior to the start of the study.
Study design
All experiments took place in a quiet, temperature-con-trolled (22 ± 1 °C) laboratory and began at 08.00 a.m. fol-lowing a 12-h overnight fast. Subjects were requested to avoid alcohol, caffeine and physical activity for 24 h prior to the experiment, and to use public transportation to reach the laboratory. On arrival, subjects were asked to use the restroom if necessary and then to sit in a custom-made and comfortable chair. Electrocardiography and imped-ance electrodes were positioned together with upper arm and blood pressure cuffs placed on the fingers according to the manufacturer’s recommendations [11]. Then, the upper body was covered with a light blanket and an 18-gauge 1.3 × 33-mm one-way Teflon catheter was inserted in the left cubital vein. This was followed by a variable period for attainment of cardiovascular stability, which was usu-ally between 20 and 30 min. Then, baseline cardiovascular recordings were performed over a 30 min period, which was immediately followed by a baseline blood sample. The ingestion of the glucose drink [75 g of anhydrous D-glucose, dissolved in 300 mL water at room tempera-ture (22 °C)], over 4 min, immediately followed the initial blood sample. Cardiovascular recordings then resumed and continued for another 120 min and blood samples were drawn every 30 min thereafter for up to 120 min post-drink. In order to avoid boredom during the study [15], subjects watched calm documentaries on a television placed in front of them.
Cardiovascular measurements
Cardiovascular and hemodynamic parameters (systolic blood pressure, diastolic blood pressure, RR-interval (RRI), stroke volume, and the Heather index) were meas-ured continuously using beat-to-beat equipment (Task Force Monitor, CNSystems, Medizintechnik, Graz, Aus-tria), which generated data sampled at a rate of 1000 Hz and stored on a hard disc for later analysis [11, 16]. Con-tinuous blood pressure monitoring followed the Penaz principle from either the index or middle finger of the right hand and was calibrated to oscillometric brachial blood pressure measurements on the contralateral arm without perturbations caused by the calibration signal [11]. This technique has been validated against invasive and continuous arterial measurements for its precision and accuracy [17] and provided an acceptable agreement dur-ing normotensive conditions with interchangeable blood pressure recordings [18]. We used height-adjustable tables for reliable horizontally aligned placement of blood pres-sure cuffs, i.e., table heights were adjusted to the height of the right atrium (forth-intercostal space), in order to avoid misleading blood pressure readings based on deviations
from heart level [11]. Moreover, an adaptive cushion was placed on top of each table where the subject’s forearms rested comfortably throughout the study [11]. Blood pres-sure cuff sizes were chosen according to the upper arm cir-cumference [11]. Cardiac stroke volume and the Heather index (as a marker for positive inotropy of the heart) [19] were derived through impedance cardiography measure-ments. In this context, the Heather index is calculated as
(
dZ/dtmax)∕ Z0
(
tdZmax−tQRS
)
and reflects the changes in impedance to the time in which they are performed from the electrical onset to the peak mechanical action [20]. Impedance cardiography, in which changes in thoracic impedance are converted to reflect changes in thoracic fluid content/volume over time, were performed based on the original Kubicek approach [21], but using an improved estimate of thoracic volume [22]. Finally, we determined Baroreflex sensitivity from spontaneous fluctuations in continuously recorded blood pressure and cardiac interval using the sequence technique [16, 23].
Anthropometric and body composition measurements
Standing height was measured using a mechanical column scale with integrated stadiometer (Seca model 709, Ham-burg, Germany) and body weight using an electronic scale (Tanita Corporation, Amsterdam, The Netherlands) [11]. Body mass index was calculated as the ratio of weight (kg) and height squared (m2), whilst body composition was meas-ured as previously published by our group [11, 24] using two validate techniques: (a) multi-frequency bioelectrical impedance analyzer (BIA; Inbody 720, Biospace Co., Ltd, Seoul, Korea) for the assessment of total fat mass (kg), fat free mass (kg), and visceral fat mass [cm3] [11] and (b) a dual-frequency BIA device (ViScan AB-140, Tanita) for the assessment of total trunk (abdominal) fat [%] [24]. The ViS-can technique has been validated against magnetic resonance imaging for the prediction of abdominal fat percentage [25].
Blood sample measurement
Blood samples were collected and used to measure plasma glucose and insulin as described previously [11]. Briefly, samples were collected in appropriate BD vacutainers (Bec-ton, Dickinson Allschwil, Switzerland) and were processed and centrifuged according to the manufacturer’s instructions to separate plasma from whole blood. Aliquots were then stored in 2 ml cryovials and plasma samples for glucose analysis were immediately frozen and stored at − 80 °C, whilst plasma samples for the analysis of insulin were stored at − 20 °C. After thawing the samples, assays were performed according to the manufacturer’s instructions: (i)
Glucose by the reference method with hexokinase Glucose HK Gen.3 (cobas c 501, Roche Diagnostics) and (ii) insulin by using an ELISA assay kit (Mercodia, Uppsala, Sweden). Phlebotomy and blood sample processing were carried out in accordance with institutional safety requirements for the handling of human biological specimens.
Data collection and processing
Beat-to-beat values of systolic blood pressure, diastolic blood pressure, heart rate, stroke volume and the Heather index were averaged every 30 min during baseline and every 30 min during the 120 min post-drink period in order to match blood data. Overall changes were calculated as aver-ages over the entire 120 min measurement period with base-line values subtracted [11]. Pulse pressure was calculated as systolic minus diastolic blood pressure and heart rate was calculated from the appropriate RR-interval [11]. Cardiac output was computed as the product of stroke volume and heart rate, whilst total peripheral resistance was calculated as mean blood pressure/cardiac output [11].
Area under curve analysis by the trapezoid method was used to assess glucose-induced responses for glucose and insulin [11]. Homeostatic model assessment for insulin resistance (HOMA–IR) was calculated as [fasting glucose (mmol L−1) × fasting insulin (mIU L−1)]/22.5 [26].
Statistical analysis
Statistical analyses were performed using Statistix (version 8.0, Analytical Software, St. Paul, MN, USA) and Graph-Pad Prism (Version 6, GraphGraph-Pad Software, Inc., La Jolla, USA) and all values are reported as mean ± standard devia-tion (SD).
In order to elucidate potential differences between the two groups, we performed statistical analysis with a two-factor mixed-design ANOVA with time as within-subject factor (i.e. baseline, 30, 60, 90 and 120 min) and the group-ing as between-subject factor (i.e. overweight/obese versus normal weight subjects). Testing for normal distribution was performed using the D’Agostino & Pearson omnibus nor-mality test and repeated measures ANOVA with Dunnett’s multiple comparison post hoc testing (for systolic blood pressure, diastolic blood pressure, pulse pressure, heart rate and stroke volume) or the Friedman test with Dunns post hoc testing (for cardiac output, total peripheral resistance, Heather index, and Baroreflex sensitivity) was used to test for changes over time from baseline levels whenever signifi-cant differences were observed from the two-factor mixed-design ANOVA. All reported p-values were two-sided and significance was set at p < 0.05.
Results
Baseline characteristics of the study subjects
A total of 27 male subjects were included in this study, of which 16 were normal weight and 11 were overweight/ obese. Baseline anthropometric-, blood-, and cardiovas-cular data prior to consuming the glucose drink are pre-sented in Tables 1 and 2. Based on these data, none of the subjects could be classified as having type 2 diabetes or hypertension, and groups did not differ based on age (Tables 1 and 2).
Compared to subjects with normal weight, subjects with overweight/obesity had significantly greater body mass index, fat mass, fat free mass, visceral fat, trunk (abdominal) fat, glucose, insulin and HOMA-IR (all
p < 0.05, Table 1). With the exception of the Heather
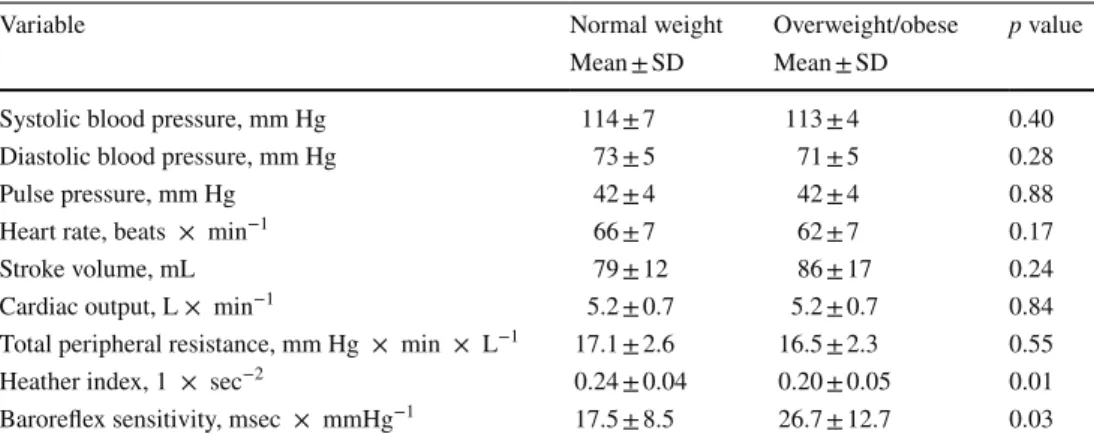
index (higher in subjects with normal weight, p = 0.01), as a marker of myocardial contraction force [27–29], and baroreflex sensitivity (higher in subjects with overweight/ obesity, p = 0.03) no other hemodynamic parameter dif-fered between the two groups at baseline (Table 2).
Glucose drink-induced hemodynamic changes
Figures 1, 2, 3 depict systolic-, diastolic-, and pulse pres-sure as well as heart rate, total peripheral resistance, the Heather index, cardiac output, stroke volume and baroreflex sensitivity in response to a glucose drink as (i) time course (left panels, respectively) and as (ii) cumulative response equivalent to an area under the curve analysis (right panels, respectively).
Unlike in subjects with normal weight, those with over-weight/obesity showed a significant increase in systolic Table 1 Baseline
anthropometric- and blood data for male subjects with normal weight (n = 16) and subjects with overweight/obesity (n = 11)
n number of subjects, SD Standard deviation, HOMA-IR homeostasis model assessment of insulin
resist-ance, Statistical analysis was performed using an unpaired student’s t Test and p < 0.05 was considered as a significant difference
Variable Normal weight Range Overweight/obese Range p value Mean ± SD Mean ± SD
Age, years 23.7 ± 3.1 20–30 24.2 ± 4.4 20–31 0.73 Height, cm 177 ± 6 168–191 181 ± 7 166–189 0.15 Weight, kg 69 ± 5 58–80 94 ± 16 71–119 < 0.005 Waist circumference, cm 79 ± 4 74–87 97 ± 10 82–114 < 0.005 Body mass index, kg × m−2 22.2 ± 1.6 19.2–24.4 28.7 ± 3.2 25.2–34.2 < 0.005
Body fat mass, kg 9.0 ± 2.7 4.5–15.2 24.4 ± 9.6 14.1–42.5 < 0.005 Body fat mass, % 12.9 ± 3.4 6.3–18.3 25.0 ± 5.8 17.8–34.8 < 0.005 Body fat free mass, kg 61 ± 6 49–70 70 ± 8 57–81 < 0.005 Visceral fat cm3 47 ± 16 21–76 103 ± 36 44–175 < 0.005
Trunk fat % 14.5 ± 4.2 5.0–22.3 28.5 ± 6.3 19.6–38.5 < 0.005 Glucose mmol × L−1 5.0 ± 0.3 4.3–5.4 5.3 ± 0.4 4.7–5.9 0.01 Insulin mU × L−1 3.7 ± 2.7 0.5–10.8 7.4 ± 4.9 2.6–17.5 0.02
HOMA-IR 0.8 ± 0.6 0.1–2.5 1.8 ± 1.3 0.6v4.6 0.01
Table 2 Baseline cardiovascular
parameters for male subjects with normal weight (n = 16) and subjects with overweight/ obesity (n = 11)
n number of subjects, SD Standard deviation, Statistical analysis was performed using an unpaired students t-Test and p < 0.05 was considered as a significant difference
Variable Normal weight Overweight/obese p value Mean ± SD Mean ± SD
Systolic blood pressure, mm Hg 114 ± 7 113 ± 4 0.40 Diastolic blood pressure, mm Hg 73 ± 5 71 ± 5 0.28 Pulse pressure, mm Hg 42 ± 4 42 ± 4 0.88 Heart rate, beats × min−1 66 ± 7 62 ± 7 0.17 Stroke volume, mL 79 ± 12 86 ± 17 0.24 Cardiac output, L × min−1 5.2 ± 0.7 5.2 ± 0.7 0.84
Total peripheral resistance, mm Hg × min × L−1 17.1 ± 2.6 16.5 ± 2.3 0.55 Heather index, 1 × sec−2 0.24 ± 0.04 0.20 ± 0.05 0.01
Baroreflex sensitivity, msec × mmHg−1 17.5 ± 8.5 26.7 ± 12.7 0.03
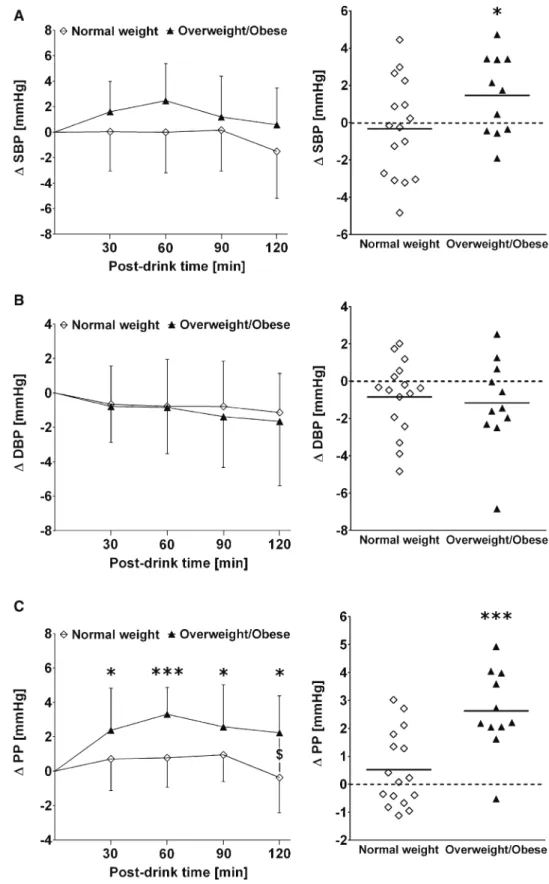
blood pressure (+1.5 ± 2.1 mmHg, p < 0.05) with unchanged diastolic blood pressure (Fig. 1, a and b, both panels), which lead to a significant increase in postprandial pulse pressure that was different from normal weight subjects (+2.6 ± 1.5
versus +0.5 ± 1.4 mmHg, two-way mixed model ANOVA interaction effect: p = 0.02; Fig. 1c, left and right panel).
Heart rate increased in response to the glucose drink in both groups, although to a lesser extent in subjects with Fig. 1 Left panels a–c Time
course of changes (Δ) from baseline values over the fol-lowing 30 min, 30–60 min, 60–90 min and 90–120 min post-drink for systolic blood pressure (SBP), diastolic blood pressure (DBP) and pulse pressure (PP), respectively. $: Significant interaction effect between subjects with normal weight and subjects with over-weight/obesity using two-way mixed model ANOVA analysis. Right panels represent individ-ual mean changes in SBP, DBP and PP over 120 min post-drink, from which baseline values are subtracted. Left panel values are reported as mean ± stand-ard deviation, whilst right panel data are presented as an individual scatter dot plot with a mean (bold horizontal lines indicate global mean changes derived from averaging all indi-vidual mean changes). *p < 0.05 and ***p < 0.005 statistically significant difference when compared to baseline values, respectively
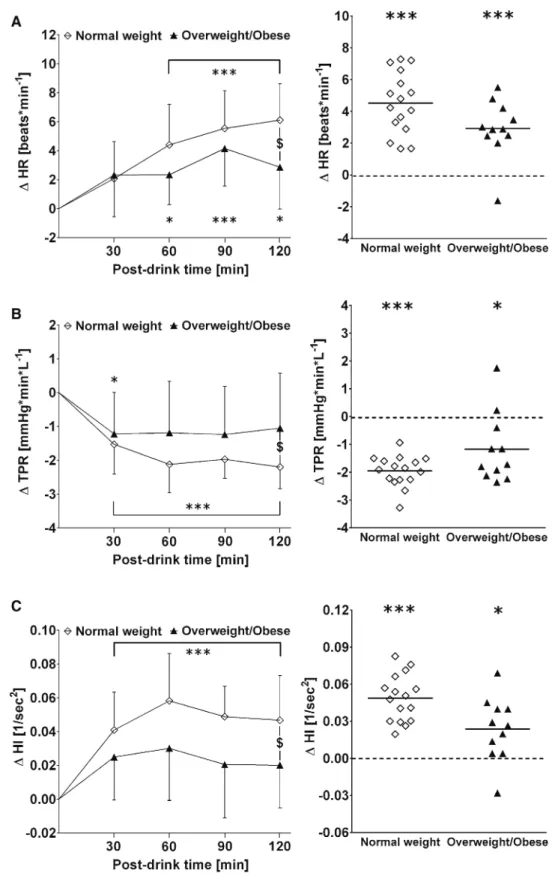
overweight/obesity than in subjects with normal weight (+2.9 ± 1.9 versus +4.5 ± 1.9 beats min−1, two-way mixed model ANOVA interaction effect: p = 0.01; Fig. 2a, left and right panel). In subjects with overweight/obesity,
glucose-induced peripheral vasodilation (total peripheral resistance: − 1.2 ± 1.3 vs. − 2.0 ± 0.6 mmHg min L−1, two-way mixed model ANOVA interaction effect: p = 0.04) and myocardial contractility (Heather index: +0.02 ± 0.03 vs. Fig. 2 Left panels a–c Time
course of changes (Δ) from baseline values over the fol-lowing 30 min, 30–60 min, 60–90 min and 90–120 min post-drink for heart rate (HR), total peripheral resistance (TPR) and the Heather index (HI), respectively. $: Signifi-cant interaction effect between subjects with normal weight and subjects with overweight/ obesity using two-way mixed model ANOVA analysis. Right panels represent individual mean changes in HR, TPR and HI over 120 min post-drink, from which baseline values are subtracted. Left panel values are reported as mean ± stand-ard deviation, whilst right panel data are presented as an individual scatter dot plot with a mean (bold horizontal lines indicate global mean changes derived from averaging all indi-vidual mean changes). *p < 0.05 and ***p < 0.005 statistically significant difference when compared to baseline values, respectively
+0.05 ± 0.02 s−2, two-way mixed model ANOVA interac-tion effect: p = 0.01) responses were significantly impaired compared to subjects with normal weight (Fig. 2 b and c, left and right panels).
Stroke volume, cardiac output and baroreflex sensitivity did not differ between the groups (all p > 0.10) (Fig. 3, a–c left and right panels).
Fig. 3 Left panels a–c Time
course of changes (Δ) from baseline values over the fol-lowing 30 min, 30–60 min, 60–90 min and 90–120 min post-drink for stroke volume (SV), cardiac output (CO) and baroreflex sensitivity (BRS), respectively. Right panels rep-resent individual mean changes in SV, CO and BRS over 120 min post-drink, from which baseline values are subtracted. Left panel values are reported as mean ± standard deviation, whilst right panel data are presented as an individual scat-ter dot plot with a mean (bold horizontal lines indicate global mean changes derived from averaging all individual mean changes.). *p < 0.05, **p < 0.01, and ***p < 0.005 statistically significant difference when compared to baseline values, respectively
Glucose drink-induced changes in plasma glucose and insulin
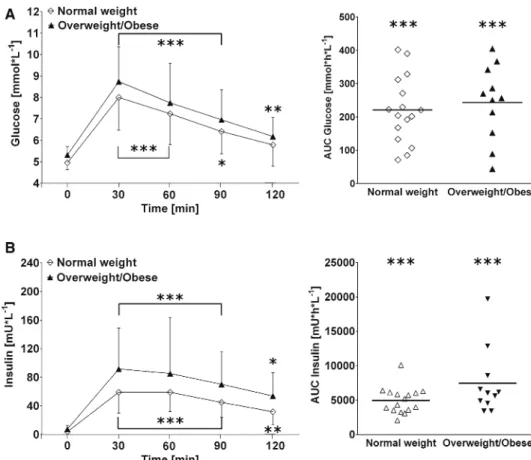
In response to the glucose drink, subjects with over-weight/obesity showed a trend toward greater cumulative insulin response compared to the normal weight group (+7445 ± 4858 vs. 4968 ± 1924 mU h L−1; p = 0.08) (Fig. 4 b, right panel). In contrast, no significant difference was observed between the groups for plasma glucose responses to the glucose drink (p = 0.59, Fig. 4 a, right panel).
Discussion
We investigated in young male subjects with overweight/ obesity, but without glucose intolerance or hypertension, and age-matched male subjects with normal weight whether mild aberrations in glucose metabolism caused by a glucose drink might affect distinct regulatory control elements for blood pressure homeostasis. The present study shows that a mildly altered glucose metabolism (i.e. increased fasting glucose, insulin and HOMA-IR compared to the normal weight con-trol group) already affects the cardiovascular system and its homeostasis by attenuating peripheral vasodilation and diminishing cardiac responses after a glucose drink. More-over, the subjects with overweight/obesity had increased
pulse pressure in response to the glucose drink, a response that was not seen in subjects with normal weight.
Glucose metabolism represents one powerful factor capable of inducing short-term perturbations in peripheral resistance that are accompanied by changes in blood flow. Indeed, seminal research shows that for individuals with nor-mal glucose tolerance, who were in a resting state, insulin strongly stimulated the sympathetic nervous system, which emphasizes the impact of changes in plasma insulin levels on total peripheral resistance [9]. This contention was con-firmed and extended by work from Baron and Brechtel [30], who showed that insulin primarily affected skeletal muscle vascular resistance and, consequently, increased cardiac output dose-dependently [30]. Moreover, and in contrast to individuals with normal weight, vascular resistance and the accompanying increase in cardiac output was blunted in obese and insulin-resistant subjects [30]. However, it is currently unknown whether subjects with overweight/obe-sity, but without glucose intolerance, also present signs of a perturbed vascular action of insulin in response to a glu-cose drink. In comparison to our control group with nor-mal weight, we observed in nor-male subjects with overweight/ obesity, but without glucose intolerance, a significantly impaired drop in total peripheral resistance in response to the glucose drink, which points toward a perturbation in the normal insulin-induced peripheral vasodilation. It could be
Fig. 4 Left panels a and b Time
course changes in absolute values for plasma glucose and plasma insulin, respectively. Left panels represent aver-aged data from the respective blood-draw interval starting at baseline, denoted as 0, and every 30 min thereafter up to 120 min. Right panels represent individual area under curve analysis using the trapezoid method for plasma glucose and plasma insulin measured over 120 min post-drink. Left panel values are reported as mean ± standard deviation, whilst right panel data are presented as an individual scat-ter dot plot with a mean (bold horizontal lines indicate global mean changes derived from averaging all individual mean changes). *p < 0.05, **p < 0.01 and ***p < 0.005 statistically significant difference when compared to baseline values, respectively
speculated that our observed acute hemodynamic effects are, at least in part, triggered by visceral intra-abdominal fat depots, which, according to the portal theory [31], adversely affect hepatic and peripheral insulin resistance. Therefore, it is suggestible that repeated and frequent intake of sugary drinks, which increases the likeliness of developing general [32] and abdominal obesity [33], could over time promote the risk of developing type 2 diabetes and cardiovascular dis-ease. Moreover, acutely increased insulin levels are known to elevate sympathetic nervous tone [9], which, in turn, over time might adversely affect the salt sensitivity of the kidneys due to sympathetic overstimulation with the potential for blood pressure dysregulation [7].
Insulin-induced changes in cardiac output in response to the glucose drink were not observed to be different between our groups, whilst heart rate, but not stroke volume, increased in subjects with normal weight to a significantly greater level compared to subjects with overweight/obesity. Moreover, a reduced myocardial contraction force accompa-nied this attenuated heart rate response to the glucose drink seen in subjects with overweight/obesity. This latter finding is in agreement with a previous study, which investigated myocardial characteristics in subjects with severe obesity, overweight/obesity and normal weight that showed subclini-cal changes of left ventricular function even in overweight (BMI: 25–29.9 kg m−2) and mildly obese subjects (BMI: 30–35 kg m−2) [34].
In response to the glucose drink, the blood pressure results from the present study demonstrate evidence toward increasing pulse pressure values in subjects with over-weight/obesity, whilst systolic and diastolic blood pressure responses did not differ between groups. Although systolic blood pressure responses were not observed to be different between our groups, subjects with overweight/obesity, but not subjects with normal weight, had significantly increased systolic blood pressure over time. In agreement with our blood pressure findings stands a cross-sectional study, which found that in subjects with obesity increasing levels of body mass index were independently associated with decreas-ing arterial compliance, i.e. which led to increases in pulse pressure [35]. However, we were not able to discern pulse pressure differences at baseline between subjects with over-weight/obesity and normal weight. Therefore, it might be that a glucose drink induced a rise in plasma insulin, which was significantly higher in subjects with overweight/obesity, and could adversely affect pulse pressure. Moreover, pulse pressure is dependent on elastic properties of Windkessel vessels and has been known to adversely affect cardiovascu-lar outcomes [36], therefore underscoring the clinical impli-cation of our study’s finding. Another contributor toward short-term blood pressure regulation is the baroreflex where its sensitivity is suggested to be adjustable in order to match
physiological adaptions to various cardiovascular perturba-tions [37]. In this context, we were not able to detect a differ-ence between our groups for glucose-drink induced changes in baroreflex sensitivity, which could be potentially due to the young age of our test subjects. Indeed, La Rovere and colleagues identified age and blood pressure as the strong-est predictors of baroreflex sensitivity [38], of which aging was observed to be associated with a decrease in baroreflex sensitivity [39].
Study limitations and perspective: We acknowledge that in our study the number of subjects with overweight/obesity is rather small, therefore our findings and conclusions should be considered with caution. Moreover, we only investigated a defined cohort (i.e. young male Caucasians), therefore it still needs to be determined whether our findings can be confirmed in children and adolescents, as well as in women and ethnicities other than Caucasians.
It is becoming increasingly evident that the human gut microbiota, i.e. micro-organisms that colonize the gut, might affect human metabolism [40], whilst its contribu-tion towards the development of obesity and type 2 diabetes is currently not yet clear [41] and warrants further investi-gation [42]. Interestingly, non-caloric sweeteners, but not glucose or sucrose, are capable of inducing glucose intoler-ance by altering the gut microbiota in a mouse model, as well as in humans [43]. However, due to the low number of human subjects in this above- mentioned study (n = 7) [43] and the number of non-responders (three out of seven subjects showed unchanged glycaemic responses to a glu-cose tolerance test [43]) it remains to be established whether artificially sweetened or sugar sweetened beverages might adversely affect the gut microbiota, which would lead to dysregulation of glucose metabolism.
In conclusion, the current study sought to explore whether mild alterations in glucose metabolism, which are seen in healthy male subjects with overweight/obesity, but without glucose intolerance or hypertension, affect regula-tory control elements of blood pressure homeostasis. We have chosen a standardized glucose drink in order to provoke a perturbation of blood pressure regulation and observed, in comparison to a control group with normal weight, that male subjects with overweight/obesity showed attenuated peripheral vasodilation and diminished cardiac responses associated with impaired cardiac output and myocardial con-tractility. Moreover, the increase in peripheral pulse pressure observed in subjects with overweight/obesity might indicate an early sign of a dysregulated blood pressure response to an oral glucose load. Finally, our results add to the grow-ing scientific evidence that the combination of overweight/ obesity and sugar intake affects the cardiovascular system adversely and may therefore contribute to increased cardio-vascular disease risk in susceptible individuals.
Acknowledgements This work was supported by intramural funding
and did not receive any grant from commercial, public, or not-for-profit agencies.
Compliance with ethical standards
Conflict of interest The authors declare no conflict of interest and no
competing financial 20 interests.
References
1. Santulli G (2013) Epidemiology of cardiovascular disease in the 21th century: updated numbers and updated facts. J Cardiovasc Dis 1:1–2
2. Danaei G, Lu Y, Singh GM et al (2014) Cardiovascular disease, chronic kidney disease, and diabetes mortality burden of cardi-ometabolic risk factors from 1980 to 2010: a comparative risk assessment. Lancet Diabetes Endocrinol 2:634–647
3. Poirier P, Giles TD, Bray GA et al (2006) Obesity and cardiovas-cular disease: pathophysiology, evaluation, and effect of weight loss–An update of the 1997 American Heart Association Sci-entific Statement on obesity and heart disease from the Obesity Committee of the Council on Nutrition, Physical Activity, and Metabolism. Circulation 113:898–918
4. Klein S, Burke LE, Bray GA et al (2004) Clinical implications of obesity with specific focus on cardiovascular disease: a statement for professionals from the American Heart Association Council on Nutrition, Physical Activity, and Metabolism: endorsed by the American College of Cardiology Foundation. Circulation 110:2952–2967
5. Kahn SE, Hull RL, Utzschneider KM (2006) Mechanisms link-ing obesity to insulin resistance and type 2 diabetes. Nature 444:840–846
6. Fox CS, Golden SH, Anderson C et al (2015) Update on preven-tion of cardiovascular disease in adults with type 2 diabetes mel-litus in light of recent evidence. Circulation 132(8):691–718 7. Landsberg L, Aronne LJ, Beilin LJ et al (2013) Obesity-related
hypertension: pathogenesis, cardiovascular risk, and treatment: a position paper of The Obesity Society and the American Society of Hypertension. J Clin Hypertens (Greenwich) 15(1):14–33 8. Monnard CR, Grasser EK (2018) Perspective: cardiovascular
responses to sugar-sweetened beverages in humans: a narrative review with potential hemodynamic mechanisms. Adv Nutr 9:70–77
9. Rowe JW, Young JB, Minaker KL, Stevens AL, Pallotta J, Landsberg L (1981) Effect of insulin and glucose infusions on sympathetic nervous system activity in normal man. Diabetes 30:219–225
10. Ferrannini E, Natali A, Bell P, Cavallo-Perin P, Lalic N, Mingrone G (1997) Insulin resistance and hypersecretion in obesity. J Clin Invest 100:1166–1173
11. Monnard CR, Fellay B, Scerri I, Grasser EK (2017) Substantial inter-subject variability in blood pressure responses to glucose in a healthy, non-obese population. Front Physiol 8:507
12. Angeli F, Reboldi G, Trapasso M (2019) European and US guide-lines for arterial hypertension: similarities and differences. Eur J Intern Med 63:3–8
13. World Health Organization, World Health Organization (2006) Definition and diagnosis of diabetes mellitus and intermedi-ate hyperglycemia: report of a WHO/IDF consultation. World Health Organization, Geneva, pp 1–50
14. American Diabetes Association (2014) Diagnosis and classifica-tion of diabetes mellitus. Diabetes Care 37:S81–S90
15. Wilson TD, Reinhard DA, Westgate EC et al (2014) Social psychology. Just think: the challenges of the disengaged mind. Science 345:75–77
16. Monnard CR, Grasser EK (2017) Water ingestion decreases car-diac workload time-dependent in healthy adults with no effect of gender. Sci Rep 7:7939
17. Jeleazcov C, Krajinovic L, Münster T et al (2010) Precision and accuracy of a new device (CNAPTM) for continuous non-invasive arterial pressure monitoring: assessment during general anaesthesia. Br J Anaesth 105(3):264–272
18. Ilies C, Bauer M, Berg P et al (2012) Investigation of the agree-ment of a continuous non-invasive arterial pressure device in comparison with invasive radial artery measurement. Br J Anaesth 108(2):202–210
19. Hill DW, Merrifield AJ (1976) Left ventricular ejection and the Heather Index measured by non-invasive methods during postural changes in man. Acta Anaesthesiol Scand 20:313–320 20. Cybulski G (2011) Ambulatory impedance cardiography. The
systems and their application. Lecture Notes in Electrical Engi-neering, 76. Springer-Verlag, Berlin
21. Kubicek WG, Patterson RP, Witsoe DA (1970) Impedance car-diography as a noninvasive method of monitoring cardiac func-tion and other parameters of cardiovascular system. Ann N Y Acad Sci 170:724–732
22. Fortin J, Habenbacher W, Heller A et al (2006) Non-invasive beat-to-beat cardiac output monitoring by an improved method of transthoracic bioimpedance measurement. Comput Biol Med 36:1185–1203
23. Bertinieri G, di Rienzo M, Cavallazzi A, Ferrari AU, Pedotti A, Mancia G (1985) A new approach to analysis of the arterial baroreflex. J Hypertens Suppl 3(3):S79–S81
24. Hunma S, Ramuth H, Miles-Chan JL et al (2016) Body com-position-derived BMI cut-offs for overweight and obesity in Indians and Creoles of Mauritius: comparison with Caucasians. Int J Obes (Lond) 40:1906–1914
25. Browning LM, Mugridge O, Chatfield MD et al (2010) Validity of a new abdominal bioelectrical impedance device to measure abdominal and visceral fat: comparison with MRI. Obesity (Sil-ver Spring) 18:2385–2391
26. Matthews DR, Hosker JP, Rudenski AS, Naylor BA, Treacher DF, Turner RC (1985) Homeostasis model assessment: insulin resistance and beta-cell function from fasting plasma glucose and insulin concentrations in man. Diabetologia 28:412–419 27. Chinali M, de Simone G, Roman MJ et al (2006) Impact of
obe-sity on cardiac geometry and function in a population of adoles-cents: the Strong Heart Study. J Am Coll Cardiol 47:2267–2273 28. Garavaglia GE, Messerli FH, Nunez BD, Schmieder RE, Gross-man E (1988) Myocardial contractility and left ventricular func-tion in obese patients with essential hypertension. Am J Cardiol 62:594–597
29. Abel ED, Litwin SE, Sweeney G (2008) Cardiac remodeling in obesity. Physiol Rev 88:389–419
30. Baron AD, Brechtel G (1993) Insulin differentially regulates systemic and skeletal muscle vascular resistance. Am J Physiol 265:E61–E67
31. Item F, Konrad D (2012) Visceral fat and metabolic inflamma-tion: the portal theory revisited. Obes Rev 13:30–39
32. Dhingra R, Sullivan L, Jacques PF et al (2007) Soft drink con-sumption and risk of developing cardiometabolic risk factors and the metabolic syndrome in middle-aged adults in the com-munity. Circulation 116(5):480–488
33. Anari R, Amani R, Veissi M (2017) Sugar-sweetened beverages consumption is associated with abdominal obesity risk in diabetic patients. Diabetes Metab Syndr 11:S675–S678
34. Wong CY, O’Moore-Sullivan T, Leano R, Byrne N, Bel-ler E, Marwick TH (2004) Alterations of left ventricular
myocardial characteristics associated with obesity. Circulation 110:3081–3087
35. Kwagyan J, Tabe CE, Xu S, Maqbool AR, Gordeuk VR, Randall OS (2005) The impact of body mass index on pulse pressure in obesity. J Hypertens 23:619–624
36. Payne RA, Wilkinson IB, Webb DJ (2010) Arterial stiffness and hypertension. Emerging concepts. Hypertension 55(1):9–14 37. Taylor CE, Witter T, El Sayed K, Hissen SL, Johnson AW,
Mac-efield VG (2015) Relationship between spontaneous sympathetic baroreflex sensitivity and cardiac baroreflex sensitivity in healthy young individuals. Physiol Rep 3(11):e12536
38. La Rovere MT, Pinna GD, Raczak G (2008) Baroreflex sensitivity: measurement and clinical implications. Ann Noninvasive Electro-cardiol 13(2):191–207
39. Kardos A, Watterich G, de Menezes R, Csanády M, Casadei B, Rudas L (2001) Determinants of spontaneous baroreflex sensitiv-ity in a healthy working population. Hypertension 37(3):911–916 40. Gérard C, Vidal H (2019) Impact of gut microbiota on host
gly-cemic control. Front Endocrinol (Lausanne) 30(10):29
41. Harsch IA, Konturek PC (2018) The role of gut microbiota in obesity and type 2 and type 1 diabetes mellitus: new insights into “old” diseases. Med Sci 6(2):pii: E32
42. Menaa F (2015) Are probiotics pro-obesity or potential anti-obe-sity agents? J Food Nutr Sci 2(1):1
43. Suez J, Korem T, Zeevi D et al (2014) Artificial sweeteners induce glucose intolerance by altering the gut microbiota. Nature 514(7521):181–186