HAL Id: tel-01969946
https://tel.archives-ouvertes.fr/tel-01969946
Submitted on 4 Jan 2019HAL is a multi-disciplinary open access archive for the deposit and dissemination of sci-entific research documents, whether they are pub-lished or not. The documents may come from teaching and research institutions in France or abroad, or from public or private research centers.
L’archive ouverte pluridisciplinaire HAL, est destinée au dépôt et à la diffusion de documents scientifiques de niveau recherche, publiés ou non, émanant des établissements d’enseignement et de recherche français ou étrangers, des laboratoires publics ou privés.
technologies for neural data analysis
Thilo Werner
To cite this version:
Thilo Werner. Spiking neural networks based on resistive memory technologies for neural data analysis. Human health and pathology. Université Grenoble Alpes, 2017. English. �NNT : 2017GREAS028�. �tel-01969946�
THÈSE
Pour obtenir le grade de
DOCTEUR DE LA COMMUNAUTE UNIVERSITE
GRENOBLE ALPES
Spécialité : Nano-Electronique et Nano-Technologies Arrêté ministériel : 25 mai 2016
Présentée par
Thilo WERNER
Thèse dirigée par Dr. Blaise YVERT codirigée par Dr. Barbara DE SALVO
préparée au sein du CEA-Leti et Braintech lab Inserm & UGA U1205
dans l'Ecole Doctorale Ingénierie pour la Santé, la Cognition et l'Environnement
Réseaux de neurones
impulsionnels basés sur les
mémoires résistives pour
l’analyse de données neuronales
Thèse soutenue publiquement le « 10 juillet 2017 », devant le jury composé de :
M Damien QUERLIOZ
DR, CNRS, RapporteurM Abdelkader SOUIFI
Prof., INSA, RapporteurM Thierry BARON
DR, CNRS, PrésidentM Jean-Michel PORTAL
Prof., CNRS, ExaminateurM Blaise YVERT
DR, Inserm, Directeur de thèse
Mme Barbara DE SALVO
DR, CEA-Leti, Co-directeur de thèseMme Elisa VIANELLO
A
BSTRACTTitle:
Spiking Neural Networks based on Resistive Memory Technologies for Neural data analysis
T
he central nervous system of humankind is an astonishing information processing system in terms of its capabilities, versatility, adaptability and low energy consumption. Its com-plex structure consists of billions of neurons interconnected by trillions of synapses forming specialized clusters. Recently, mimicking those paradigms has been attracting a strongly growing interest, triggered by the need for advanced computing approaches to tackle challenges related to the generation of massive amounts of complex data in the Internet of Things (IoT) era. This has led to a new research field, known as cognitive computing or neuromorphic engineering, which relies on so-called non-von-Neumann architectures (brain-inspired) in contrary to von-Neumann architectures (conventional computers). In this thesis, we explore the use of resistive memory technologies such as oxide vacancy based random access memory (OxRAM) and conductive bridge RAM (CBRAM) for the design of artificial synapses that are a basic building block for neuro-morphic networks. Moreover, we develop an artificial spiking neural network (SNN) based on OxRAM synapses dedicated to the analysis of spiking data recorded from the human brain with the goal of using the output of the SNN in a brain-computer interface (BCI) for the treatment of neurological disorders. The impact of reliability issues characteristic to OxRAM technology on the system performance is studied in detail and potential ways to mitigate penalties related to single device uncertainties are demonstrated. Besides the already well-known spike-timing-dependent plasticity (STDP) implementation with OxRAM and CBRAM which constitutes a form of long term plasticity (LTP), OxRAM devices were also used to mimic short term plasticity (STP). The fundamentally different functionalities of LTP and STP are put in evidence.Titre:
Réseaux de neurones impulsionnels basés sur les mémoires résistives pour l’analyse de données neuronales
L
e système nerveux central humain est un système de traitement de l’information stupéfiant en termes de capacités, de polyvalence, d’adaptabilité et de faible consommation d’énergie. Sa structure complexe se compose de milliards de neurones, interconnectés par plusieurs trillions de synapses, formant des grappes spécialisées. Récemment, l’imitation de ces paradigmes a suscité un intérêt croissant en raison de la nécessité d’approches informatiques avancées pour s’attaquer aux défis liés à la génération de quantités massives de données complexes dans l’ère de l’Internet des Objets (IoT). Ceci a mené à un nouveau domaine de recherche, connu sous le nom d’informatique cognitive ou d’ingénierie neuromorphique, qui repose sur les architectures dites non-Neumann (inspirées du cerveau) en opposition aux architectures von-Neumann (ordinateurs classiques). Dans cette thèse, nous examinons l’utilisation des technologies de mémoire résistive telles que les mémoires à accès aléatoires à base de lacunes d’oxygène (OxRAM) et les mémoires à pont conducteur (CBRAM) pour la conception de synapses artificielles, composants de base indispensables des réseaux neuromorphiques. De plus, nous développons un réseau de neurones impulsionnels artificiel (SNN), utilisant des synapses OxRAM, pour l’analyse de données impulsionnelles provenant du cerveau humain en vue du traitement de troubles neurologiques, en connectant la sortie du SNN à une interface cerveau-ordinateur (BCI). L’impact des problèmes de fiabilité, caractéristiques des OxRAMs, sur les performances du système est étudié en détail et les moyens possibles pour atténuer les pénalités liées aux incertitudes des dispositifs seuls sont démontrés. En plus de l’implémentation avec des OxRAMs et CBRAMs de la bien connue plasticité fonction du temps d’occurrence des impulsions (STDP), qui constitue une forme de plasticité à long terme (LTP), les dispositifs OxRAM ont également été utilisés pour imiter la plasticité à court terme (STP). Les fonctionnalités fondamentalement différentes de la LTP et STP sont mises en évidence.A
CKNOWLEDGEMENTSC
ertainly, I would not have been able to achieve the results presented in this PhD thesis without the help of numerous people. Therefore, it is my desire to express my deep grat-itude to all those who have supported me during the last three years, both professionally as well as personally.First, I would like to thank my PhD director Blaise Yvert for directing me through this ’exotic’ project bridging neuroscience, electrical engineering and machine learning by consistently questioning the status quo, proposing several new ideas and also for his optimistic advices when I struggled with from time to time. Moreover, I am grateful to Barbara de Salvo for the co-direction of this PhD project. Her constant very professional and strategic support as well as fruitful technical discussions helped a lot to steer the work in a successful direction. My special thanks go to Elisa Vianello, my daily advisor, for always being there when I needed assistance, for constantly pushing me to give my best and for her patience with me and my perfectionism. Our countless and sometimes late discussions on neuromorphic subjects brought up a 1000 ideas (more or less) and I will never forget her valuable reminder that ’Research is frustrating!’ when I was unsatisfied with the progress of my work. I also want to thank Olivier Bichler from CEA-LIST who assisted me a lot in debugging the code of their special purpose neural network simulator software that I was using (and messing up occasionally).
I am glad I have been able to meet, work and share break times with the people in our lab such as Brigitte, Cathy, Christelle, Eric, Etienne, Gabriel, Gabriele, Khalil, Laurent, Luca, Sabine, Remi, Sophie and Veronique. Of course there are also several people from other labs who helped me with the electrical characterization setup or supported me with expert advice in domains where I did not have enough expertise myself. Among them, I would like to thank especially: Alain Lopez, Carlo Cagli, Denis Blachier and Niccolo Castellani from LCTE as well as Elisabeth Delevoye from DSYS.
Then, there is a great number of interns, PhD students and post-docs that I am thankful to have met and who helped a lot to keep up the social life and reduce the stress level with coffee breaks and nice activities outside of work. In the naive hope not to forget anyone, I want to give my gratitude to the following people: Adam, Amine, Angelica, Annalisa, Anthonin, Blend, Boubacar, Cecile, Daesok, Daniele, Denys, Florent, Giuseppe, Jeremy, Julia, Julien, Loic, Luc, Maria, Marie, Marinela, Marios, Martin, Mouhamad, Mourad, Natalija, Paul, Rana, Selina, Thanasis, Thomas and Vincent. Just as important as people at work to share some creative breaks with are of course ’non-involved’ people from the ’outside-of-work’ world and I definitely owe finishing this thesis partly to the following people: Alan, Alexia, Daniel, Felipe, Felix, Joana, Johana, Lucy, Ning, Oscar, Pierre, Sebastien, Sholpan and Stephane.
Finally, I want to thank my family for always supporting me in following my ideas and achieving my goals as well as for motivating me when I was doubtful. Continuing my thesis is among the previously mentioned people strongly due to my girlfriend Julia who accompanied me
least, I need to mention Marios. He persistently supported me personally when I was close to giving up and he kept listening to my complaints over and over. Therefore, I will be forever in those people’s debt and I want to thank them greatly.
A
UTHOR’
S DECLARATIONI
declare that the work in this dissertation was carried out in accordance with the requirements of the University’s Regulations and Code of Practice for Research Degree Programmes and that it has not been submitted for any other academic award. Except where indicated by specific reference in the text, the work is the candidate’s own work. Work done in collaboration with, or with the assistance of, others, is indicated as such. Any views expressed in the dissertation are those of the author.I walk slowly but I never walk backward. Abraham Lincoln
T
ABLE OFC
ONTENTSPage
List of Tables xiii
List of Figures xv
Introduction 3
1 Basics for Neuromorphic devices 7
1.1 Neuroscience . . . 7
1.1.1 The central nervous system . . . 7
1.1.2 Neurons . . . 8
1.1.3 Synapses . . . 10
1.1.4 Electrophysiological techniques to record the brain activity . . . 14
1.1.5 Recording of single neurons . . . 16
1.1.6 State-of-the-art spike sorting techniques . . . 17
1.1.7 Brain-computer interfaces . . . 19
1.1.8 Neural prostheses . . . 20
1.2 Memory technologies for data storage . . . 21
1.2.1 Overview . . . 21
1.2.2 Emerging Non-Volatile Memory technologies . . . 22
1.2.2.1 Phase change memory . . . 23
1.2.2.2 Resistive Random Access Memory . . . 24
1.2.2.3 Magnetic Random Access Memory . . . 28
1.2.2.4 Ferroelectric Random Access Memory . . . 30
1.2.3 Three-dimensional integration concepts . . . 30
1.2.4 Comparison . . . 31
1.3 Emerging NVM in Neuromorphic Systems . . . 32
1.3.1 Application of NVM in synapses . . . 33
1.3.1.1 PCM synapses . . . 33
1.3.1.2 OxRAM synapses . . . 35
1.3.1.4 MRAM synapses . . . 37
1.3.1.5 FeRAM synapses . . . 38
1.3.2 Neuromorphic concepts based on NVM synapses . . . 38
1.3.2.1 Spiking Neural Networks based on emerging NVM . . . 39
1.3.2.2 Formal Neural Networks based on emerging NVM . . . 40
1.4 Applications of Neuromorphic Networks . . . 40
2 Goal of this work 43 3 Synapse based on RRAM 45 3.1 Requirements to mimic biological synapses . . . 45
3.2 Electrical analysis of Resistive RAM . . . 46
3.2.1 Static IV analysis . . . 48
3.2.2 Resistance variability . . . 51
3.2.3 Resistance margin . . . 51
3.2.4 Switching variability . . . 53
3.2.5 Endurance . . . 54
3.2.6 Filamentary vs. non-filamentary switching . . . 59
3.2.7 Retention for ultra-low programming currents . . . 61
3.3 Synapse design . . . 62
3.3.1 Synapse based on filamentary RRAM . . . 63
3.3.2 Synapse based on non-filamentary RRAM . . . 65
3.3.3 Probabilistic Spike-Timing-Dependent Plasticity for RRAM synapse . . . . 65
3.3.4 From OxRAM variability to synaptic variability . . . 66
3.4 Summary . . . 67
4 Spiking Neural Network for spike sorting 69 4.1 Motivation for spike sorting . . . 70
4.2 Spike Sorting system . . . 70
4.2.1 General approach . . . 70
4.2.2 Input data encoding . . . 71
4.2.3 Spiking neural network architecture . . . 74
4.2.3.1 Input layer of SNN . . . 76
4.2.3.2 Output layer of SNN . . . 77
4.2.4 Synapse design . . . 78
4.2.5 Unsupervised learning by Spike-Timing-Dependent Plasticity . . . 79
4.2.6 System level description . . . 79
4.3 Spiking biological data . . . 81
TABLE OF CONTENTS
4.4.1 Functionality . . . 82
4.4.2 Reliability . . . 84
4.4.3 Power consumption . . . 84
4.4.4 Versatility . . . 86
4.4.5 Qualitative comparison to standard spike sorting techniques . . . 88
4.5 Summary . . . 89
5 Synaptic variability in Spiking Neural Networks 91 5.1 Artificial synapse implementation with RRAM technology . . . 91
5.1.1 OxRAM operation for synapses . . . 92
5.2 Effects of synaptic variability on SNN in Classification tasks . . . 93
5.2.1 Reliability . . . 94
5.3 Effects of synaptic variability on SNN in Detection tasks . . . 96
5.3.1 Reliability . . . 99
5.3.2 Threshold dependence . . . 102
5.3.3 Memory window dependence . . . 104
5.3.4 Synaptic granularity . . . 107
5.3.5 Learning time . . . 107
5.4 Summary . . . 109
6 Short-Term Plasticity 111 6.1 Biological synapse review . . . 112
6.2 Tsodyks-Markram model . . . 113
6.3 Emulation of Short Term Plasticity using RRAM . . . 114
6.4 Compound synapse featuring Short and Long Term Plasticity . . . 119
6.5 Synapse implementation with OxRAM arrays . . . 121
6.6 Short Term Plasticity in Spiking Neural Networks . . . 125
6.6.1 Visual processing with highly noisy input data . . . 126
6.6.2 Spike detection in noisy brain signals . . . 130
6.6.3 Implications due to STP . . . 131
6.7 Summary . . . 134
7 Conclusions and Perspectives 135
A Appendix A: Band-pass filtering 139
A Appendix B: Publications 141
L
IST OFT
ABLESTABLE Page
4.1 Leaky Integrate Fire (LIF) neuron parameters of the 2-layer spiking neural network
used for spike sorting of extracellular spiking data. . . 76
4.2 Spiking Neural Network (SNN) statistics. . . 85
4.3 Spiking Neural Network (SNN) power metrics. . . 86
4.4 Quantitative evaluation of spike sorting on different biological datasets. . . 87
4.5 Qualitative comparison of Spike-Timing Depending Plasticity (STDP) based Spike sorting (this work) with standard approaches (template matching, PCA). . . 88
5.1 LRS and HRS test conditions for OxRAM based synapses used to simulate Spiking Neural Network for visual signal processing. . . 99
6.1 Statistics of SNN based applications for unsupervised car or spike detection for the highest noise levels: Cars: 40%, Spikes: SNR=2.7. . . 133
6.2 Energy estimation of SNN based applications for unsupervised car or spike detection for the highest noise levels: Cars: 40%, Spikes: SNR=2.7. . . 134
L
IST OFF
IGURESFIGURE Page
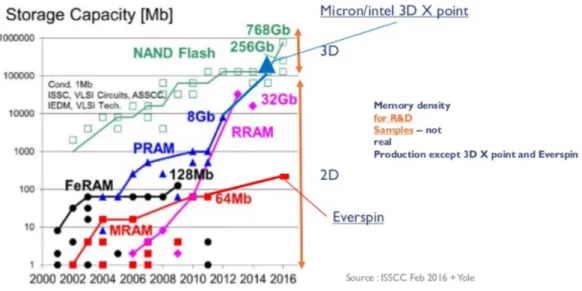
0.1 Evolution of storage capacity of several memory technologies: NAND Flash, phase change memory (PRAM), resistive memory (RRAM), ferroelectric memory (FeRAM) and magnetic memory (MRAM). . . 5
0.2 Prospected computing and technology roadmap based on von-Neumann and non-von-Neumann architectures. Source: IBM. . . 6
1.1 Schematic illustration of location of central nervous system (CNS) and peripheral nervous system (PNS) in human body. Note that the CNS consists of both brain and spinal cord. Figure taken from [1]. . . 9
1.2 Structural illustration of a cortical neuron consisting of three main parts: the dendrites, soma and axon. . . 10
1.3 Illustration of a neuronal cell membrane. (a) Active ion transporters move certain species of ions in one preferable direction resulting in concentration gradients. (b) Ion channels permeable for certain species allow to equalize concentration gradients. Source: [1] . . . 10
1.4 Schematic internal voltage of a neuron during the emission of an action potential (spike). Normally, a neuron lies at an internal resting potential of around −65 mV which can be changed by synaptic inputs. If a threshold at around −40 mV is reached, a rapid depolarization reaches to approximately +40 mV followed by the rapid re-polarization to the resting potential. Source: [1] . . . 11
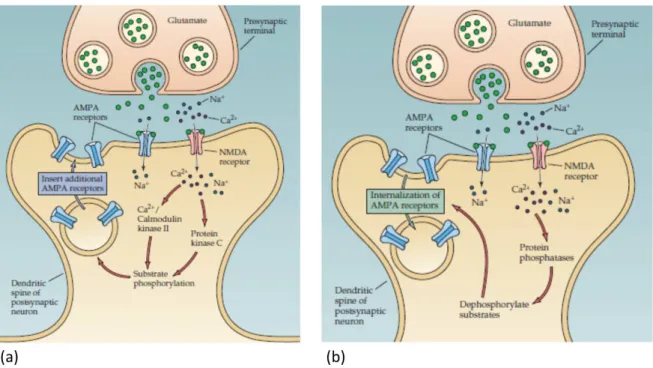
1.5 Schematic illustration of (a) Long-term potentiation (LTP) and (b) Long-term depres-sion (LTD). The synaptic efficacy (strength) depends on the density of so-called AMPA receptors. Accordingly, LTP or LTD are due to an increased or decreased density of AMPA receptors. Source: [1] . . . 13
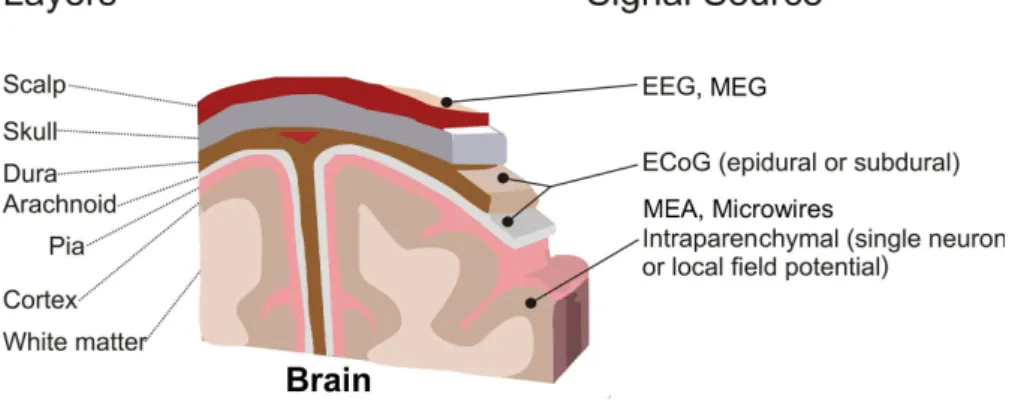
1.6 Experimental spike-timing-dependent plasticity found by Bi and Poo [2]. If a post-synaptic neuron spikes after (before) a pre-post-synaptic neuron, so that∆T > 0 (∆T < 0), their synapse is potentiated (depressed) in an LTP or LTD manner. This change of synaptic strength is expressed by the changed excitatory post-synaptic current (EPSC). A positive change, i.e. an increased EPSC means the synapse has become stronger whereas a negative change, i.e. a decreased EPSC indicates a weakened synaptic strength. . . 14 1.7 Overview of brain metrology techniques and their characteristic localization. . . 15 1.8 Schematic illustration of spike sorting from an extra-cellular electrical signal.
Differ-ent spike waveforms are idDiffer-entified and associated to individual neurons. This allows to extract the spiking activity of single neurons from a multiplexed recording. . . 16 1.9 Selected brain-computer interface cased studies. Two tetraplegic patients were
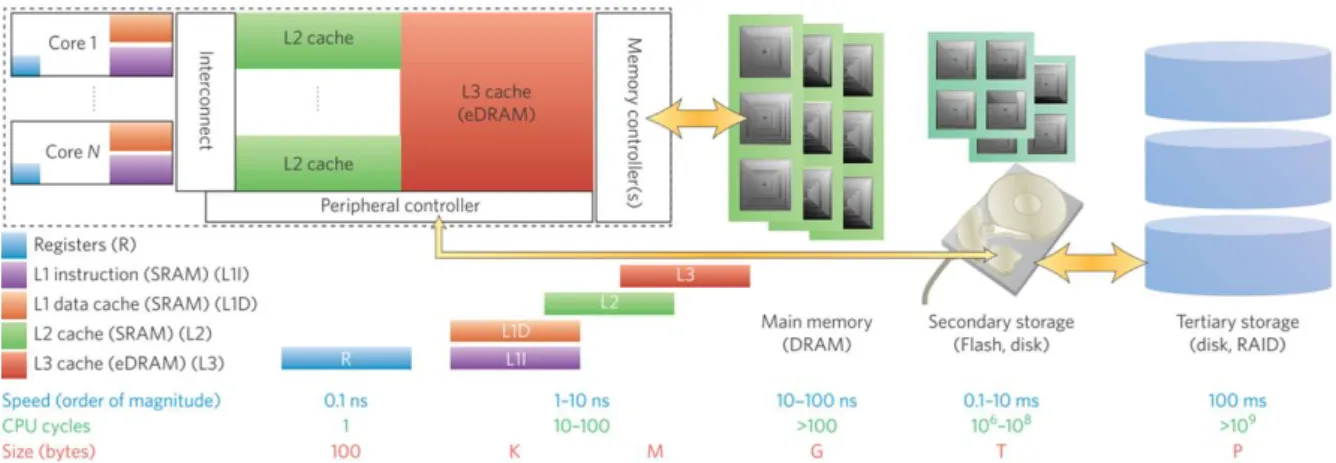
corti-cally implanted with multi-electrode arrays (left) and a dedicated setup was used for the signal treatment. (a) The subject is able to move a cursor thanks to harnessing his brain signals. (b) The extracted information allowed this subject control a robotic arm to grasp a bottle and drink independently. Source: [3] [4] . . . 20 1.10 Overview of state-of-the-art (blue) and emerging (green) memory technologies. . . 21 1.11 Memory hierarchy of conventional von-Neumann architectures constructed according
the speed of the different technologies. Source: [5] . . . 22 1.12 (a) Resistance as a function of temperature for major phase change materials. When
a material in amorphous state is heated up, a crystalline phase will form at some temperature resulting in a significantly lower electrical resistance. (b) Typical in-tegration of a phase change material in a mushroom cell for memory application. (c) Characteristic programming pulses to trigger conversion into crystalline (Set) or amorphous phase (Reset). Source: [6] . . . 23 1.13 (a) Basic structure of a RRAM cell. (b) Unipolar and (c) Bipolar device operation.
Source: [7] . . . 25 1.14 Illustration of basic physical mechanism involved in switching oxide vacancy based
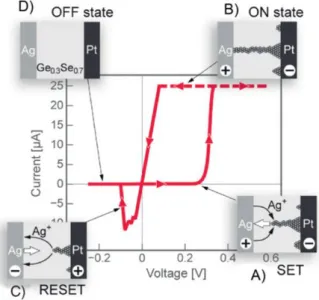
Random Access Memory. Source: [7] . . . 26 1.15 Illustration of basic physical mechanism involved in switching conductive bridge
Random Access Memory. Source: [8] . . . 27 1.16 Basic structure of a MRAM cell. . . 28 1.17 Overview of current MRAM technologies: (a) Toggle, (b) Thermally assisted MRAM,
(c) in-plane STT-RAM, (d) and (e) perpendicular STT-RAM with single and double reference layers (f) domain wall propagation MRAM (g) Spin orbit torque MRAM. Source: [9] . . . 29
LIST OFFIGURES
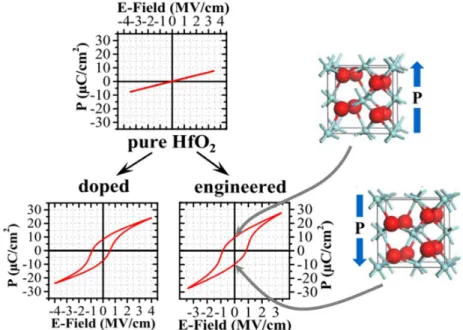
1.18 Principal mechanism of ferroelectric materials. Depending on the orientation of the crystal structure (note the red atoms), the material exhibits a spontaneous electrical polarization with positive or negative polarity. Source: [10] [11] . . . 30 1.19 (a) 3D cross-point and (b) vertical RRAM (VRRAM) integration architectures. Source:
[12] . . . 31 1.20 Comparison of most important emerging non-volatile memory technologies. Source: [13] 32 1.21 (a) Gradual crystallization of PCM cell upon application of identical set pulses. (b)
Abrupt amorphization of PCM cell upon application of identical reset pulses. Source: [14] . . . 34 1.22 (a) The 2-PCM synapse design. Both LTP and LTD device use gradual crystallization in
order to achieve a progressive potentiation and depression of the synaptic weight which corresponds to I. (b) Refresh algorithm to prevent saturation of synaptic weights. LTP and LTD devices are reset and the previous synaptic weight is restored by gradually programming the device which was stronger before the refresh. Source: [15] . . . 34 1.23 Gradual programming of OxRAM cell by increasing the (a) current compliance (CC)
and (b) reset voltage (Vstop). (c) Gradual potentiation and depression achieved by tuning the programing conditions. Source: [16] . . . 35 1.24 (a) Probabilistic programming is shown for a CBRAM cell. For a number of cycles, the
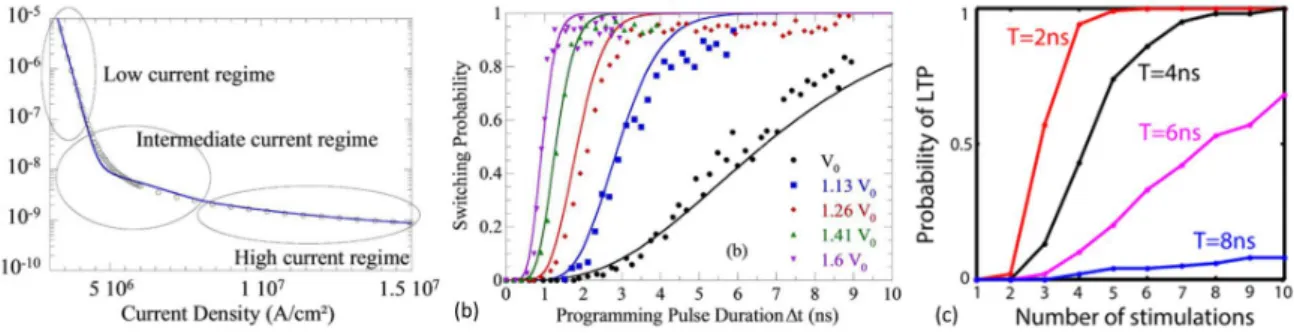
Set pulses fail to switch the device into LRS. This phenomenon can be used to extract (b) Reset and (c) Set probabilities. Source: [17] . . . 37 1.25 (a) Switching time as a function of the applied current density in a MRAM cell.
Switching probability as a function of (b) applied programming time and (c) delay between programming pulses. Source: [18] [19] . . . 37 1.26 (a) Hysteresis loop of ferroelectric polarization indicating gradual polarization change.
(b) Gradual conductance change observed in a FeFET. (c) Ratio of switched polarization area as function of the cumulated pulse time showing gradual changes. Source: [20] [21] [22] . . . 38 1.27 Schematic illustration of fully-connected neural network (FCNN) and convolutional
neural network (CNN). . . 40 3.1 Schematic of 1-Transistor-1-Resistor (1T1R) co-integration. Overview of device
struc-ture and different material compositions analysed for this study for (a) OxRAM and (b) CBRAM. . . 47 3.2 Schematic switching of 1-Transistor-1-Resistor (1T1R) co-integrated RRAM devices.
RRAM IV characteristics (here for Al2O3/H f O2 OxRAM device) for Forming
(sym-bols) and Set/Reset (solid lines, 30 cycles averaged). Operation is shown for different programming currents (PC) . . . 47
3.3 IV characteristics (shown for Al2O3/H f O2 OxRAM) for (a) Forming/1stReset and (b)
Set/Reset. Operation is shown for ICC(i.e. current compliance) ranging from 1.5µA
to 340µA. Note the shift of the Set IV curve towards higher voltages for reduced ICC. 49
3.4 Reset current (IR eset) as a function of ICC for OxRAM and CBRAM material
composi-tions. . . 49 3.5 (a) LRS and (b) HRS as a function of ICC for different oxide materials. . . 50 3.6 (a) IV characteristic of doped MOx CBRAM operated using ICC = 4.5µA and (b)
corresponding resistance values for Low and High Resistance States (LRS and HRS) for 30 switching cycles. . . 50 3.7 Cumulative distribution functions (CDF) of Low Resistive State (LRS) and High
Resis-tive State (HRS) as function of the current compliance (ICC) for different OxRAM
mate-rials: (a) LRS and (b) HRS for 5nm H f O2(c) LRS and (d) HRS for 1nm Al2O3/3nm H f O2 (e) LRS and (f) HRS for 5nm H f O2/4nm TaOx. Note the shift and widening of the
CDF in both LRS and HRS for reduced ICC. . . 52
3.8 Cumulative distribution functions (CDF) of Low Resistive State (LRS) and High Resistive State (HRS) as function of the current compliance (ICC) for different CBRAM materials: (a) LRS and (b) HRS for undoped MOx(c) LRS and (d) HRS for 20%H f −
MOx. Note the shift and widening of the CDF in both LRS and HRS for reduced ICC. 53
3.9 (a) Variability (σR) as a function of programmed mean resistance (µR). (b)µRandσR
extraction methodology from experimental resistance distribution of 30 cycles for one device. . . 54 3.10 LRS and HRS as a function of the current compliance (ICC) for (a) 5nm H f O2,
(b) 1nm Al2O3/3nm H f O2 and (c) 5nm H f O2/4nm T aOx. The bold lines show the
geometrical mean values of LRS and HRS, the shaded areas represent different confidence intervals of the experimental sample, i.e. 1σ, 2σand 3σ. . . 54 3.11 The extraction of (a) the memory window (MW) and (b) the dynamic range for different
confidence intervals (σ) is schematically illustrated. . . 55 3.12 Memory window as function of ICC for (a) 5nm H f O2, (b) 1nm Al2O3/3nm H f O2
and (c) 5nm H f O2/4nm T aOx. The different lines correspond to different confidence
intervals of the experimental sample, i.e. 0σ, 1σ, 2σand 3σ. The dashed lines repre-sent a MW of 1, i.e. LRS and HRS distributions blend into each other. Dynamic range as function of ICC for (a) 5nm H f O2, (b) 1nm Al2O3/3nm H f O2 and (c)
5nm H f O2/4nm TaOx. The different lines correspond to different confidence intervals of the experimental sample, i.e. 0σ, 1σ, 2σand 3σ. . . 55
LIST OFFIGURES
3.13 Memory window as function of ICC for (a) undoped MOxand (b) 20%H f − MOx. The
different lines correspond to different confidence intervals of the experimental sample, i.e. 0σ, 1σ, 2σ and 3σ. The dashed lines represent a MW of 1, i.e. LRS and HRS distributions blend into each other. Dynamic range as function of ICC for (a) undoped MOx and (b) 20%H f : MOx. The different lines correspond to different confidence
intervals of the experimental sample, i.e. 0σ, 1σ, 2σand 3σ. . . 56 3.14 Probability to perform a Set operation (PS et) as a function of the applied Set voltage
(VS et). . . 57
3.15 H f O2endurance test using pulsed programming with VS= 2.5V and tS et,R eset= 1µs
and a variation of current compliance ICC and reset voltage VR: (a) ICC= 30µA, VR=
−1.2V , (b) ICC= 85µA, VR= −1.2V , (c) ICC= 135µA, VR= −1.2V , (d) ICC= 30µA,
VR= −1.5V , (e) ICC= 85µA, VR= −1.5V , (f) ICC= 135µA, VR= −1.5V . The single
devices LRS and HRS are represented in grey lines while the mean LRS and HRS are shown in blue and red. . . 57 3.16 Memory window (MW) for different distribution intervals (σ) of H f O2 endurance
test using pulsed programming with VS= 2.5V and tS et,R eset= 1µs and a variation
of current compliance ICC and reset voltage VR: (a) ICC= 30µA, VR= −1.2V , (b) ICC= 85µA, VR= −1.2V , (c) ICC= 135µA, VR= −1.2V , (d) ICC= 30µA, VR= −1.5V ,
(e) ICC= 85µA, VR= −1.5V , (f) ICC= 135µA, VR= −1.5V . . . 58
3.17 Endurance failure rate of RRAM as a function of the reset voltage VR. Early HRS
failure rate is induced by high VR. . . 58 3.18 Endurance failure rate of RRAM as a function of the reset voltage VR. Early HRS
failure rate is induced by high VR. . . 59
3.19 TaOx/H f O2endurance for pulsed operation using (a) ICC= 5µA, VS et= 3 V , VR eset=
−1.5 V , tS et/R eset= 10 µs (no resistance window) and (b) ICC= 30µA, VS et= 2.5 V ,
VR eset= −1.5 V , tS et/R eset= 1µs (1 decade median-median resistance window). . . 60
3.20 Abrupt Set of single T aOx/H f O2device obtained by applying 100 identical Set pulses
withICC= 30µA. . . 60
3.21 (a) Long Term Potentiation (LTP) and (b) Long Term Depression (LTD) of 10 T aOx/H f O2
devices (grey) obtained by application of 50 identical Set and Reset pulses with ICC= 5µA. Geometric mean over all devices is also shown (red). . . 61
3.22 The pulse number required to increase the single OxRAM device conductance by a certain ratio∆G is shown as a function of the pulse duration for ∆G = 100, ∆G = 300 and∆G = 1000. ICC= 5µA. . . 62 3.23 Data retention of 15x 1nm Al2O3/3nm H f O2devices programmed into LRS using
ICC= 6.5µA. The test was performed at room temperature. Blue and red lines
repre-sent the average LRS or HRS levels. Grey lines show the single device behaviour and black the mean value of all devices. . . 62
3.24 Multi-cell synapse concept. Each equivalent synapse consists of a series of 1T1R integrated RRAM devices, i.e. the corresponding synaptic weight is the sum of device conductances. A driver circuit including a pseudo random number generator (PRNG) is used to enable gradual tuning of the synaptic weight, thus overcoming the typical abrupt switching characteristic of RRAM shown in figure 3.20. . . 64 3.25 Potentiation and Depression for 20 synapses each based on 20 OxRAM devices using
a pseudo random number generator (PRNG) for the application of Set and Reset pro-gramming pulses with pS etand pR eset. OxRAM devices are fitted using experimental
data from figure 3.15 (a). . . 64 3.26 Probabilistic learning rule used for online learning in our SNN inspired by spike
timing dependent plasticity (STDP). Set and Reset probabilities, pS etand pR esetas well as the LTP time window tLT P are indicated. . . 66
3.27 Representation of synaptic evolution for 100 events of potentiation and depression each for synapses based on (a) OxRAM operated at ICC= 340µA and (b) OxRAM operated at ICC= 30µA. The OxRAM was based on a 1nm Al2O3/3nm H f O2 dielectric. Each
grey line represents one synapse based on 20 OxRAM devices. The average synaptic weight evolution is shown in red. . . 67 4.1 Overall schematic of spike sorting approach based on data encoding by N band-pass
filters and a spiking neural network. The approach aims to extract the neural code from electrical neural signals. . . 71 4.2 Signal encoding for spike sorting paradigm based on continuous time-frequency
de-composition of the analog extracellular signal (ES). Different spike shapes (here Spike A and B) exhibit distinct patterns in the spectrogram. These ’finger prints’ are used to distinguish between different spike shapes. . . 72 4.3 Band-pass filter characteristics for 32 order 2 Butterworth filters equally distributed
between 100 H z and 2000 H z. The bandwidth for each filter is B = 60 H z. This filter set is used to pre-process biological spiking data. . . 73 4.4 Band-pass filter output signals from 32 filters applied to a 10ms long signal (see figure
4.2). (a) The raw continuous filter responses are shown as a function of the time which are then full-wave rectified resulting in signals shown in (b). . . 74 4.5 Functional schematic of spike sorting system based on a Spiking Neural Network.
The extracellular signal (ES) is fed through 32 frequency band-pass filters which are connected one-to-one to the input layer of the SNN. Synapses are based on OxRAM devices. Output neurons are interconnected by inhibitory synapses to feature the winner-take-all principle which allows them to become selective to different input spike shapes. . . 75 4.6 Recorded extracellular (ES) signals (black) and representation of frequency bands by
LIST OFFIGURES
4.7 (a) Probabilistic learning rule used for online learning in our SNN inspired by spike timing dependent plasticity (STDP). Set and Reset probabilities, pS etand pR esetas
well as the LTP time window tLT P are indicated. (b) Long Term Potentiation (LTP)
and Long Term Depression (LTD) for 20 synapses each based on 20 OxRAM devices using pS etand pR eset. OxRAM devices are fitted using experimental data from figure
3.19. . . 80 4.8 Schematic algorithm of the proposed spike sorting system. . . 80 4.9 (a) Illustration of the experiment used to obtain real biological data. The crayfish is
dissected and two electrodes are used in-vitro, one intracellular electrode inside a motor neuron in the T5 ganglion and one extracellular positioned against a depressor nerve (’Dep’). (b) The extracellular signal (ES, short sequence shown) contains two different spike shapes, labelled as Spike A and Spike B. The intracellular signal (IS) contains spiking events matching only Spike A of the ES. . . 82 4.10 Schematic illustration of the learning phase for the SNN (see figure 4.5) applied on the
biological data (see figure 4.9). Initially, the SNN is untrained for new input spikes (in the ES signal) and output neurons spike randomly. Due to online learning, different output neurons become gradually selective to certain input spike patterns. . . 83 4.11 Activity of SNN output neurons during 681 s of continuous input signal. Activity is
plotted as the number of spikes in time intervals of 10 seconds. N1 activity matches well with the intracellular reference (blue dots), i.e. N1detects Spike A. N2seems to
be selective to Spike B, however, no reference data is available for verification. . . 84 4.12 Temporal evolution of recognition rate of Spike A by N1. A mean recognition rate
of 86.4% (dashed line) is reached within 15 seconds starting from the first Spike A occurence. . . 85 4.13 Sequences of real biological spiking data used for verification of Spike Sorting system,
recorded in (a) in-vitro crayfish [23] and (b) in-vivo implanted rat hippocampus [24]. Intracellular recordings were simultaneously obtained and provide the ground truth for valid quantification of the spike recognition rate for the labeled spikes (blue arrows). 87 5.1 Estimation of maximum programming power of OxRAM (1nm Al2O3/3nm H f O2) as
a function of the current compliance. . . 92 5.2 Experimental LRS and HRS distributions as a function of the current compliance
(CC) for 1T1R OxRAM devices (1nm Al2O3/3nm H f O2). Set and reset voltages were 2.5V and −1.2V The bold lines mark M edian for both LRS and HRS, the shaded areas include 95% of the samples, i.e. reflect the distribution at 2σ. . . 93 5.3 (a) H f O2endurance test using a ICC= 135µA and (b) extractedσfor LRS and HRS.
(c) Al2O3/H f O2endurance test using a ICC= 30µA and (d) extractedσfor LRS and
HRS. The extraction of the memory window (MW) and variabilitiesσLRSandσHRSis illustrated in (b) and (d). . . 95
5.4 (a) Median-to-median memory window (MW) for the three tested OxRAM materials as a function on the ICC. (b) Resistance variabilityσLRS,HRSof the three tested OxRAM
materials depending on the PC. Two device approaches are chosen as indicated in the graphs: Low Current OxRAM (’LCO’, Al2O3/H f O2, PC = 30µA) and High Current
OxRAM (’HCO’, H f O2, PC = 135µA). . . 96
5.5 LRS and HRS distributions of test conditions for SNN of Fig.10. . . 96 5.6 Overall Recognition Rate of spike sorting SNN as a function of number of devices per
synapses and for different conditions C1 − C3. . . 97 5.7 Recognition rate of SNN used for neural spike classification as a function of LRS and
HRS variability. Synaptic redundancy accounts to (a) 1, (b) 5, (c) 10, (d) 20, (e) 50 and (f) 100. Note that these results were obtained for using the same set of parameters, i.e. neuron threshold etc. . . 97 5.8 Two-layer Spiking Neural Network used for unsupervised detection of cars in different
traffic lanes. . . 98 5.9 The reference activity (blue) is compared to the activity of the corresponding output
neurons (red) to calculate the number of True Positives (TP), False Negatives (FN) and False Positives (FP). . . 98 5.10 (a) False Negatives (FN), (b) False Positives (FP) and (c) F1 score for the different
OxRAM conditions (see figure 5.10). All numbers are averaged over the six traffic lanes. Note that FN and FP shall be as low as possible while F1 has to be maximized (i.e. converge to 1). . . 100 5.11 (a) False Negatives (FN), (b) False Positives (FP) and (c) F1 score for the different
OxRAM conditions (see figure 5.10) for the six traffic lanes. Note that FN and FP shall be as low as possible while F1 has to be maximized (i.e. converge to 1). . . 101 5.12 Recognition rate of car detection SNN (figure 5.8) as a function of LRS and HRS
variability of the OxRAM devices used for the implementation of the SNN synapses. . 101 5.13 (top) The spike trains of the output neurons corresponding to lane 1 (red) of the SNN
shown in figure 5.8 are compared with the reference (blue) for the OxRAM conditions C4 and C5. (bottom) The integrated membrane potential for the two neurons is shown. Every time a car passes (spike in the truth), the integration increases significantly and eventually reaches the threshold. This is true for all events using C4 but 2 events are missed for C5. Note that the increase of the integration is proportional to the input synaptic weights. . . 102
LIST OFFIGURES
5.14 Synaptic weight distribution after sufficient learning period for C4 and C5. The majority of the OxRAM based synapses is depressed, i.e. in High Resistive State (HRS) while a small fraction is potentiated, i.e. in Low Resistive State (LRS). The synapses in LRS are the ones corresponding to relevant input information for a specific lane and allow to detect a passing car while the HRS synapses detect events outside the former lane. C4 bears a much wider distribution of LRS synapses with respect to a very sharp distribution for C5. . . 103 5.15 False Negative (FN), False Positives (FP) and F1 score as a function of the threshold
of the LIF neurons for C4 and C5. . . 104 5.16 Schematic illustration on how to retrieve the MW from experimental distributions of
LRS and HRS. The MW described the gap between those two distributions. . . 104 5.17 False Negative (FN), False Positives (FP) and F1 score as a function of the threshold
of the LIF neurons for C4 and C5. . . 105 5.18 False Negative (FN), False Positives (FP) and F1 score as a function of the MW of the
LIF neurons for C1, C2, C4 and C5. . . 106 5.19 Synaptic window (SW) as a function of the statistical RRAM device memory window
(MW) for different variabilities of low and high resistance states (LRS and HRS). Note that the populations of RRAM devices in both LRS and HRS are assumed to follow Gaussian distributions. . . 106 5.20 Synaptic weight distribution after sufficient learning period for synapses based on 1
C5 device (blue) and 10 C5 devices (red). The majority of the OxRAM based synapses is depressed, i.e. in High Resistive State (HRS) while a small fraction is potentiated, i.e. in Low Resistive State (LRS). The synapses in LRS are the ones corresponding to relevant input information for a specific lane and allow to detect a passing car while the HRS synapses detect events outside the former lane. Note that the absolute ratio between lowest and highest conductance synapses is equivalent for synapses based on 1 and 10 devices, i.e. the dynamic range can not be enhanced by increasing the number of devices per synapse. However, this approach can be used to achieve intermediate synaptic levels instead of only binary weights. . . 108 5.21 Detection Rate (DR) as a function of the number of training epochs. . . 108 6.1 Schematic illustration of synaptic connection between a pre-synaptic axon and a
post-synaptic dendrite. Both the number of neurotransmitters in the pre-synaptic terminal and the number of channels in the post-synaptic terminal determine the amplitude of the voltage in the post-synaptic neuron induced by a spike of the pre-synaptic neuron. Note that the number of neurotransmitters is changed dynamically and modifications decay in an exponential relaxation where the channel number modifications are permanent. Therefore, those two effects are affiliated with Short and Long Term Plasticity, respectively. . . 113
6.2 (a) Functional observation of Excitatory Post-Synaptic Potential (EPSP) evoked in post-synaptic neuron during a pre-synaptic spike. The amplitude of the EPSP reduces upon a rising number of input spikes, e.g. R2 < R1. Note that a stationary EPSP occurs for a spike train of constant frequency. (b) Biological data (symbols) and a simplified rule (line) for the stationary EPSP as a function of the pre-synaptic frequency. Figures reproduced from [25]. . . 114 6.3 Schematic illustration of Short Term Plasticity model according to equation 6.2.
Sev-eral traces are shown for the same spike train example using different STP parameters
τD= [0.3, 1, 3, 10, 100] and fD= [0.1, 0.5, 1.0]. . . 115
6.4 Schematic of proposed Short Term Plasticity synapse ( yi(t)) using 10 H f O2 based
OxRAM cells. Top electrode: Ti PVD 10 nm, resistive switching layer: H f O2 ALD
5 nm, bottom electrode: TiN PVD, 130 nm node. . . 116 6.5 Programming strategy to reproduce Short Term Plasticity using the OxRAM based
synapse (figure 6.4). The synaptic weight is decreased at each pre-synaptic spike and periodically increased (every∆T) in absence of pre-synaptic spikes. . . 117 6.6 Short Term Plasticity synaptic weight evolution obtained using the OxRAM synapse
structure (n = 10) and programming scheme presented in figures 6.4 and 6.5 (black symbols) and the Tsodyks and Markram model (green line). Different values forτDand fDcan be experimentally obtained by changing the set and reset probabilities, pS et
and pR eset. The programming interval was set to∆T =τD/n, hence (a)∆T = 0.1ms
and (b)∆T = 1ms. . . 118 6.7 Stationary amplitude of yi(t) (Fig.4) reached during a train of spikes with a given
pre-synaptic frequency, fpre, for different (a) fDand (b)τDvalues. The limiting frequency
fl imdecreases as theτD and is independent of fD. . . 119
6.8 (a) R2for correlation of Short Term Plasticity based on RRAM and model as a function of ∆T/τD. Relationship between (b)τD and the set probability and (c) fD and the
reset probability. pS etand pR esetare modulated by the OxRAM programming voltages
(Fig.13). . . 120 6.9 Schematic illustration for association of Short Term Plasticity weight ( yi(t)) with Long
Term Plasticity weight (wi j) to create total synaptic weight (gi j). . . 120
6.10 Principal circuit proposed to reproduce both the Short Term Plasticity and Long Term Plasticity rules using non volatile OxRAM cells. The conductance multiplication during the read operation is performed by means of a buffer which modulates the read voltage for the Long Term Plasticity synapse wi j. . . 121
6.11 Integration concept for a Fully Connected Neural Network (FCNN) using 1T − 1R OxRAM arrays. Each layer‚Äôs neurons drive the next layer through weights yi(t) (Short Term Plasticity) and wi j (Long Term Plasticity). . . 122
LIST OFFIGURES
6.12 Photograph of 64 kbit circuit demonstrator and SEM image of CMOS stack including the OxRAM cell between M4 and M5. . . 122 6.13 4−kbit resistance distributions for (a) strong (IS et = 400µA) and (b) weak (IS et = 40µA)
programming conditions. 5 MΩ is the resistance measurement limit. . . 123 6.14 4 − kbit resistance distributions for different (a) set and (b) reset voltages for strong
programming condition (IS et = 400µA) . . . 124
6.15 (a) Set and (b) reset switching probabilities extracted from the 4−kbit array resistance distributions of figure 6.14 and used to tune the Short Term Plasticity conditions,τD
and fD. . . 124
6.16 Probabilistic STP synapses (grey) based on 10 OxRAM cells in parallel architecture and mean value (red) for (a) IS et= 400µA and (b) IS et= 40µA. The ideal STP trace according to the Tsodyks-Markram model is shown for comparison (blue). . . 126 6.17 Pearson correlation coefficient r2for correlation of OxRAM based STP and STP-model
as a function∆T/τD. . . 127
6.18 Two-layer Spiking Neural Network (SNN) used for car (N = 16384, M = 60) or spike detection (N = 32, M = 5). . . 127 6.19 Detection Rate (DR) (a) and False Positive Rate (FPR) (b) as a function of the number
of cells per Long Term Plasticity synapse. Only Long Term Plasticity is considered. Results have been obtained on a bench of 20 simulations (no added noise). . . 128 6.20 Input representation of AER signal while recording cars passing on a freeway. Random
noise is added in the right-hand side presentation. . . 128 6.21 Detection Rate (DR) and False Positive Rate (FPR) as a function of fDand for different
τD. 30 % of random noise is artificially introduced in the input data. Both Detection
Rate (DR) and False Positive Rate (FPR) can be increased by additional Short Term Plasticity with respect to a network featuring only Long Term Plasticity. . . 129 6.22 Detection Rate (DR) and False Positive Rate (FPR) as a funcion of the noise level
artificially introduced in the Adress Event Representation (AER) input data. The Short Term Plasticity parameters for each noise level are reported in the right table. Short Term Plasticity maintains the functionality of the Spiking Neural Network for high noise levels. . . 129 6.23 Snapshots of spiking data featuring different signal-noise-ratios (SNR). . . 130 6.24 Detection Rate (DR) and False Positive Rate (FPR) for the cases of ideal (SNR = 80)
and real (SNR < 27) biological data. Short Term Plasticity is mandatory to reduce the False Positive Rate (FPR) for reliable spike detection in real data. . . 131
6.25 (a) Detection Rate (DR) and (b) False Positive Rate (FPR) as a funcion of the degree of depression, fD, for different recovery timesτD. Short Term Plasticity allows to reduce
the False Positive Rate (FPR) significantly while maintaining a high DR. DR decreases for fD> 0.1 since the Short Term Plasticity disturbs detection of relevant data in this
case. . . 132 6.26 Detection Rate (DR) and False Positive Rate (FPR) as a function of the
Signal-Noise-Ratio (SNR). . . 133 A.1 Band-pass filter characteristic. . . 139 A.2 Band-pass filter characteristics for Butterworth filters of order 1, 2, 4 and 8. The
I
NTRODUCTIONT
he topic of this thesis is embedded within the three main research fields, being (i) biomed-ical engineering, (ii) memory technology and (iii) neuromorphic engineering. A short description of each of these fields is given before explaining the objective of this disserta-tion in more detail.Biomedical engineering: Recording and stimulating the brain
Numerous people suffer from paralysis, e.g. after spinal cord injury (SCI), or neurodegenerative diseases such as Parkinson, Alzheimer, and Huntington’s disease due to traumas and population aging (WHO, 2014). Official numbers are not available, however, estimations state that approxi-mately 2.5% and 1.9% of US citizens are affected by neurodegenerative diseases and paralysis, respectively. This accounts to a total number of approx. 13 million people (7.4M + 5.6M) only in the USA. Consequences of this are a major loss of life quality for individual patients and enormous cost for healthcare, since patients are mostly dependent on around the clock assistance. Innovative therapies are needed in order to cure patients or re-establish their independence. Modern healthcare approaches do not only rely on molecular and pharmacological products but embrace more and more technological approaches for rehabilitation including brain-computer interfaces (BCIs) and neural prostheses (NPs). BCIs are paradigms designed to extract and decode neural signals to control an external device to restore motor commands or communication, while NPs use electrical stimulation of the Central Nervous System (CNS) to restore lost or missing functions as for instance audition with cochlear implants or vision with retinal implants. Therefore, probing motor cortical activity has recently received increased attention for the ex-ploitation of human brain signals within BCI systems. It was shown that BCI’s offer promising rehabilitation possibilities to improve life quality of patients suffering from neurodegenerative diseases or paralysis [3],[4], i.e. numerous signals have to be stored and decoded resulting in vast data rates and computational efforts. This requires the ability to precisely collect and analyse brain signals, e.g. triggered when a person intends to perform movements. The effectiveness and accuracy of BCI systems scale with the number of simultaneously recorded populations of neurons [26],[27]. To this end, advanced microelectrode array (MEA) technologies [28] are unique and increasingly powerful tools exploring the central nervous system in detail. Nowadays, they consist of hundreds or thousands of microelectrodes that allow recording the activity oflarge neural ensembles and especially spikes (action potentials) generated by the surrounding single neuron cells. These technologies generate massive data due to sampling rates of typically 20 − 40 kH z that have to be processed for further use and/or wireless transmission [29]. Spike sorting is a key technique to drastically reduce the amount of data by extracting relevant in-formation as how many cells are active and the different instants at which they fire [30]. This allows to understand the neural code (e.g. of language or motor commands) and thus to develop revolutionary rehabilitation treatments.
Information storage: From early memories to advanced
technologies for the Internet of Things/Big data era
The advent of portable electronics such as smartphones, tablets etc. has led to an ever increasing need of high capacity memory technologies operating on low energy budgets. The storage function was typically satisfied by Flash technologies for many years, more exactly by NOR and NAND for embedded and stand-alone products. These technologies find various applications in fields spanning everyday life products, such as micro-controllers, phones, cameras and automotive applications. Nowadays, novel technologies are emerging from research, appearing to be competi-tive for the replacement of Flash memories which faces several problems in the continuation of scaling according to Moores law. Among the new technologies are: phase change memory (PCM, PCRAM or PRAM), resistive memory (RRAM or ReRAM), ferroelectric memory (FeRAM) and magnetic memory (MRAM). All of those technologies are non-volatile (like Flash), e.g. do not require a power supply for data storage. They offer various advantages over Flash technology such as higher speed and endurance and are achieving storage capacities even higher with respect to Flash as shown in figure 0.1. The rapid emerging of non-volatile memory technologies, most importantly PRAM and RRAM, can also be attributed to their excellent suitability for 3-dimensional integration, hence, increasing massively the memory density on chip. Note that, due to their different characteristics and operation mechanisms, each emerging technology is believed to fulfil a different task in future memory applications.
Von-Neumann computers vs. Brain-Inspired architectures
The Von-Neumann computer architecture [31], based on the separation of processing (CPU, GPU) and data storage (memory), has enabled the rapid progress of human development throughout the late 20th and beginning of 21st century. In parallel, the Internet of Things (IoT) has evolved with billions of connected devices requiring fast and low energy data exchange. As the vast amount of data in the IoT era are rather complex and unstructured, the development of efficient approaches to extract information from them is becoming more and more challenging. Since the von-Neumann architecture is based on a deterministic approach which requires dedicated
LIST OFFIGURES
Figure 0.1: Evolution of storage capacity of several memory technologies: NAND Flash, phase change memory (PRAM), resistive memory (RRAM), ferroelectric memory (FeRAM) and magnetic memory (MRAM).
and sophisticated software, parallel processing of unstructured data becomes critical. An alter-native could be brain-inspired (also known as non-von-Neumann or neuromorphic) computing approaches. This fundamentally different class of architectures is projected to exploit several new device technologies and change the computing paradigm with respect to available von-Neumann technologies, as shown in figure 0.2. Several studies among the last decade have demonstrated the potential of non-von-Neumann computing paradigms, in particular for (parallel) processing of vast amounts of complex data [32]. Indeed, the so-called brain-inspired networks are designed specifically for certain applications, often related to pattern recognition problems. Among the different approaches mimicking essential functions of biological neural systems are the so-called artificial neural networks (ANN). Currently, ANN are simulated using conventional computers which poses a number of problems such as high energy consumption and slow computation speed when highly parallel computation is needed. These bottlenecks could be overcome by customized physical implementations of ANN, which promise to achieve higher energy efficiency thus fitting the requirements of the Internet of Things (IoT) era. In this context, synapse implementations with novel memory technologies will play a key role as the synapses typically outnumber the neurons in the ANN by orders of magnitude. Properties as high integration density, CMOS process compatibility, low power consumption and long lifetime (high cycling numbers) make resistive RAM (RRAM) one of the main candidates for hardware synapse design.
C
H A P T E R1
B
ASICS FORN
EUROMORPHIC DEVICEST
his chapter aims to provide the basics for the design of neuromorphic systems and moreover to understand the results in chapters 3 to 6. It is divided according to the pillars of this dissertation. First, the essentials of neuroscience and rehabilitation approaches for neurological disorders are described in section 1.1. Second, a survey of state-of-the-art non-volatile memory technologies as well as emerging memory technologies is given with an emphasis on resistive memories in section 1.2. Third, the role and potential applications of RRAM technologies in neuromorphic systems, in particular synapses, is introduced in section 1.3. Finally, the most sophisticated neuromorphic design concepts demonstrated previously are reviewed in section 1.4.1.1
Neuroscience
This section introduces the physiological fundamentals of neuroscience in order to understand basic functional mechanisms governing nervous systems. Therefore, the role of neurons and synapses are discussed in detail. Furthermore, a comprehensive overview of state-of-the-art technologies used for sensing and/or stimulating neural activity is given. Finally, this section focusses on the challenge of recording/detecting single neuron activities with the ultimate goal to decode and understand the brain’s activity for potential application of such techniques into brain-computer interfaces.
1.1.1 The central nervous system
The central nervous system (CNS) and the peripheral nervous system (PNS) constitute the two pillars for sensing, acting and processing information of a human individual [1]. The PNS spans the whole body and its purpose is to collect and distribute sensory and motor signals, respectively,
which are send to or received from the CNS. Figure 1.1 shows schematically the location of CNS and PNS in a human. The CNS consists of the brain and spinal cord and forms the basis for all higher level information processing. It is based on a large number of neurons communicating with one another whereas it is known that the brain is organized into specialized functional areas such as the sensory-motor cortex for motion control [33]. Other areas are, for instance, responsible for vision or language related tasks. Neurons in such areas may either be hard-wired or linked temporally by concerted oscillation [34] [35]. Common for all areas in the human brain is the basic structure, namely a large number of neurons being interconnected by synapses. The latter are used by neurons in order to communicate with each other. The entire brain is believed to consist of approximately 1011neurons connected by some 1014synapses. A detailed description of the structural and biochemical basics of neurons and synapses and there crucial role in neural network dynamics is given in the following sections.
1.1.2 Neurons
Neurons, also called nerve cells, are the principal building block of the human CNS. A neuron is a complex cell that features generally three cell areas dedicated to certain functions, namely (i) the soma where the information is processed, (ii) the dendrites as input and (iii) the axon as output terminals as shown schematically in figure 1.2. The soma is also called cell body and features the main signal processing of the neuron by receiving inputs from the dendrites and sending output signals through its axon. The dendritic arbour consists of relatively short branches of thousands of fine dendrites which establish numerous connections with axons of other neurons. These electro-chemical connections between individual axons and dendrites are known as the so-called synapses which are explained in detail in section 1.1.3. It is estimated that each neuron connects to about 104 other neurons constituting a massive connectivity. The computation and memory of the brain is based on the massively parallel communication of neurons with each other that is effected by the propagation of so-called action potentials (AP, also known as spikes) between neurons. An AP is a sharp electrical impulse with a rather uniform voltage amplitude of around 100 mV and exhibits a typical duration of about 1 ms. The AP is travelling from the soma of a pre-synaptic neuron along its axon and it is transmitted via a synapse to the dendrite of a post-synaptic neuron and finally arrives to this one’s soma.
The electric potential of the inner neuron soma with respect to the area outside the cell body is governed by concentration gradients of various ion species such as potassium (K+), sodium (N a+), chlorine (Cl−) or calcium (Ca2+). These concentration gradients are controlled by the properties of so-called active transporters (made of proteins) which pump ions through the cell membrane to build up high concentration gradients and ion channels which allow ions to travel through the cell membrane of a neuron. Typically, a high ion concentration of K+ dominates inside the cell whereas N a+exhibits a high concentration outside. Due to a high K+and low N a+
1.1. NEUROSCIENCE
Figure 1.1: Schematic illustration of location of central nervous system (CNS) and peripheral nervous system (PNS) in human body. Note that the CNS consists of both brain and spinal cord. Figure taken from [1].
resting potential of around −65 mV . In the event of an action potential, the ion specific channel permeabilities are inversed resulting in a positive polarization. By the enormous number of synaptic connections with other neurons, the soma receives numerous input information in the form of synaptic currents. These currents lead to a change of the intracellular potential.
Neurons exhibit an internal threshold at about −40 mV , below which is called the sub-threshold region. If the potential rises to this sub-threshold, the neuron emits an AP which is generated by the rapid depolarization up to +40 mV , followed by a quick recovery towards the resting potential of −65 mV . 1.2. This behaviour is caused by ion channels which open shortly and hence allow ions to flow in or out massively in order to create a concentration equilibrium. After this rapid process, the active ion transporters take control again and establish the resting potential inside the soma. During the transmission of the AP from the axon of a pre-synaptic
Figure 1.2: Structural illustration of a cortical neuron consisting of three main parts: the dendrites, soma and axon.
Figure 1.3: Illustration of a neuronal cell membrane. (a) Active ion transporters move certain species of ions in one preferable direction resulting in concentration gradients. (b) Ion channels permeable for certain species allow to equalize concentration gradients. Source: [1]
neuron to the dendrite of a post-synaptic neuron, the AP is converted into a current whose amplitude is characteristic for the individual synaptic strength.
1.1.3 Synapses
A synapse or synaptic cleft is the interface between two neurons and can be classified into chemical and electrical synapses. Chemical synapses are the majority and hold their name because they convert the electrical signal into a current of a specific chemical species. In a chemical synapse, the AP coming from a pre-synaptic neuron activates voltage-gated ion channels which triggers the release of neurotransmitters that bind to their corresponding receptors. Those receptors
1.1. NEUROSCIENCE
Figure 1.4: Schematic internal voltage of a neuron during the emission of an action potential (spike). Normally, a neuron lies at an internal resting potential of around −65 mV which can be changed by synaptic inputs. If a threshold at around −40 mV is reached, a rapid depolarization reaches to approximately +40 mV followed by the rapid re-polarization to the resting potential. Source: [1]
are located in the membrane of the post-synaptic neuron. When a neurotransmitter arrives to the post-synaptic neuron, it initiates an electrical response or it activates a second messenger. These two scenarios will either excite or inhibit the post-synaptic neuron. On the other hand, electrical synapses are rather rare and are constructed by well aligned gap junctions which are paired channels in the neuron membranes. They are typically of very short distance and allow for a direct ionic current flow between individual cells enabling a very fast information transfer minimizing delays. Due to the domination of chemical over electrical synapses, we will hereafter focus on chemical synapses. When an AP is transmitted over a synapse, a number of glutamate neurotransmitters from pre-synaptic vesicles and N a+via the ion channels is released into the synaptic cleft. The N a+causes a current flow which can either be an Excitatory Post-Synaptic
Current (EPSC) or an Inhibitory Post-Synaptic Current (IPSC) and the amplitude depends on the individual strength of the synapse which is determined by the number of so-called AMPA (α−amino−3− h ydrox yl −5− meth yl −4− isoxazol e− propionate) receptors. An EPSC creates an Excitatory Post-Synaptic Potential (EPSP) which leads to the increase of the intracellular potential of a neuron and therefore increases its likelihood to emit an AP. Accordingly, an IPSC generates an Inhibitory Post-Synaptic Potential (IPSP) which decreases the intracellular potential and thus reduces the likelihood of a neuron to emit an AP. It was demonstrated that EPSPs are affected by fluctuations that might be linked to changing probabilities of neurotransmitter release [36] or due to the specfic axonal structure [37].
The specialization of the CNS throughout life occurs through learning and the creation of memory which are not identical, i.e. learning is a rather quick process to gain some capability and memory is the long term consolidation of the learned feature [38]. It is widely understood that learning and memory are due to synaptic pruning and synaptic plasticity. The former is the
elimination of synaptic connections which takes place mainly during early childhood and is a key mechanism for the beginning specialization of the CNS [39]. Synaptic plasticity is the ability of synapses to change their strength of connectivity according to their history of activations, environment and neural processes or even to form new synaptic connections [40]. Effects of synaptic plasticity can be observed on various time scales, ranging from milliseconds to months or years with characteristic effects. Several different kinds of plasticity can be observed in a single synapse making it an incredibly complex structure [41]. Typically, synaptic plasticity is distinguished between short term and long term effects [42]. While the former tend to exhibit a rather fast transient behaviour, the latter lead to stable modifications. Known short-term plasticity effects are: (i) Short-term facilitation (STF): This is the transient increase of synaptic strength which occurs upon the arrival of two or more APs within a short time at the pre-synaptic terminal. Its effect is an increased emission of neurotransmitters in the event of an AP. (ii) Post-tetanic potentiation: This occurs due to high-frequency bursts of pre-synaptic spikes, known as tetanus, and can be observed with some delay after the burst. Its effect is also an enhanced neurotransmitter release, however it is of longer duration than the STF. (iii) Short-term depression (STD): This effect can be regarded as the opposite of STF because repeated pre-synaptic APs result in a pre-synaptic weakening due to the depletion of pre-synaptic vesicles supplying neurotransmitters. Typically, a synapse can either feature STF or STD, depending on the initial state. If the initial probability for neurotransmitter release is high (low), the synapse tends to perform STD (STF) upon the application of several activations [41].
Known long-term plasticity effects are: (i) Long-term potentiation (LTP) is the persistent strengthening of a synaptic connection, usually referred to as synaptic efficacy or weight. It occurs when a weak pre-synaptic stimulus (low frequency) results in the release of glutamate from the pre-synaptic terminal. The glutamate binds to both NMDA (N-methyl-D-aspartate) and AMPA receptors while the former are blocked by magnesium (M g2+) in the resting state and the latter are permeable for N a+. When a pre-synaptic spike activates the synapse, the
M g2+is removed from NMDA making them permeable for Ca2+. Hence, the Ca2+can enter the post-synaptic neuron where its concentration is strongly increases which eventually triggers the phosphorylation leading to the incorporation of additional AMPA receptors, as shown in figure 1.5 (a). Thus, the sensitivity to pre-synaptic N a+release is increased, i.e. more N a+can be induced by a pre-synaptic spike. (ii) Long-term depression (LTD) is the opposite of LTP, hence, the persistent weakening of a synaptic connection, usually referred to as synaptic efficacy or weight. It is caused by rather long low-frequency (around 1 H z) pre-synaptic stimuli which lead to a slight increase of the Ca2+in the post-synaptic terminal. This results in the activation of phosphatases which cleave phosphate groups and essentially remove AMPA receptors from the post-synaptic terminal, as illustrated in figure 1.5 (b). Accordingly, the sensitivity to pre-synaptic N a+ release is decreased, i.e. less N a+ can be induced by a pre-synaptic spike. Note that the
1.1. NEUROSCIENCE
Figure 1.5: Schematic illustration of (a) Long-term potentiation (LTP) and (b) Long-term depres-sion (LTD). The synaptic efficacy (strength) depends on the density of so-called AMPA receptors. Accordingly, LTP or LTD are due to an increased or decreased density of AMPA receptors. Source: [1]
differ for other CNS regions.
Spike-timing dependent plasticity (STDP) is a so-called learning rule which combines LTP and LTD based on the correlation of pre- and post-synaptic APs, evidenced by Tsodyks and Markram [43] as well as Bi and Poo [2]. When a post-synaptic spike occurs shortly after (before) a pre-synaptic spike, LTP (LTD) is performed on the synapse. Figure 1.6 shows the experimentally observed STDP. It is described as the change of the EPSC that occurs as a function of the relative timing of pre- and post-synaptic APs. A strong increase (decrease) was observed if the timing difference∆t = tpost− tprewas in the range 0 ms <∆t < 40 ms (−40 ms < ∆t < 0 ms). This effect
is also related to Hebbian learning proposed by Donald Hebb. In his theory, he stated that "The general idea is an old one, that any two cells or systems of cells that are repeatedly active at the same time will tend to become ’associated’, so that activity in one facilitates activity in the other." Other kinds of plasticity do certainly exist but are not yet fully understood, e.g. by controlling the membrane excitability, the CNS can actively adapt its sensitivity to sensory input activities [44]. It is believed that this threshold adaptation may as well enable or inhibit synaptic plasticity [45]. Furthermore, oscillation of neuronal ensembles may enhance synaptic plasticity temporally [34].
Figure 1.6: Experimental spike-timing-dependent plasticity found by Bi and Poo [2]. If a post-synaptic neuron spikes after (before) a pre-post-synaptic neuron, so that ∆T > 0 (∆T < 0), their synapse is potentiated (depressed) in an LTP or LTD manner. This change of synaptic strength is expressed by the changed excitatory post-synaptic current (EPSC). A positive change, i.e. an increased EPSC means the synapse has become stronger whereas a negative change, i.e. a decreased EPSC indicates a weakened synaptic strength.
1.1.4 Electrophysiological techniques to record the brain activity
Neurodegenerative diseases or injuries can affect the physical structure of the brain as well as alter mechanisms that are critical for the proper functionality of the CNS. In order to find potential treatments or curing strategies, it is crucial to understand the functional organization and the basic principles of neural computation. This can be studied by using a variety of techniques that aim to record the brain’s activity by means of various approaches:
• Non-invasive:
– Electroencephalography (EEG) – Magnetoencephalography (MEG)
• Invasive by using implanted macroelectrodes:
– Electrocorticography (ECoG)
– Stereotactic electroencephalography (SEEG)
• Invasive by using implanted microelectrodes:
![Figure 1.6: Experimental spike-timing-dependent plasticity found by Bi and Poo [2]. If a post- post-synaptic neuron spikes after (before) a pre-post-synaptic neuron, so that ∆ T > 0 ( ∆ T < 0), their synapse is potentiated (depressed) in an LTP or LT](https://thumb-eu.123doks.com/thumbv2/123doknet/12692434.355057/43.892.287.646.173.484/figure-experimental-dependent-plasticity-synaptic-synaptic-potentiated-depressed.webp)