HAL Id: hal-00000723
https://hal.archives-ouvertes.fr/hal-00000723
Preprint submitted on 14 Oct 2003
HAL is a multi-disciplinary open access
archive for the deposit and dissemination of
sci-entific research documents, whether they are
pub-lished or not. The documents may come from
teaching and research institutions in France or
abroad, or from public or private research centers.
L’archive ouverte pluridisciplinaire HAL, est
destinée au dépôt et à la diffusion de documents
scientifiques de niveau recherche, publiés ou non,
émanant des établissements d’enseignement et de
recherche français ou étrangers, des laboratoires
publics ou privés.
ISGRI: the INTEGRAL Soft Gamma-Ray Imager
F. Lebrun, J.-P. Leray, P. Lavocat, J. Crétolle, M. Arquès, C. Blondel, C.
Bonnin, A. Bouère, C. Cara, T. Chaleil, et al.
To cite this version:
F. Lebrun, J.-P. Leray, P. Lavocat, J. Crétolle, M. Arquès, et al.. ISGRI: the INTEGRAL Soft
Gamma-Ray Imager. 2003. �hal-00000723�
ccsd-00000723 (version 1) : 14 Oct 2003
Astronomy & Astrophysics manuscript no. INTEGRAL62.hyper15148 October 14, 2003 (DOI: will be inserted by hand later)
ISGRI: the INTEGRAL Soft Gamma-Ray Imager
⋆
F. Lebrun
1, J.P. Leray
1, P. Lavocat
1, J. Cr´
etolle
1, M. Arqu`
es
2, C. Blondel
1, C. Bonnin
1, A. Bou`
ere
1, C.
Cara
1, T. Chaleil
3, F. Daly
1, F. Desages
4, H. Dzitko
1, B. Horeau
1, P. Laurent
1, O. Limousin
1, F. Mathy
2,
V. Mauguen
1, F. Meignier
1, F. Molini´
e
3, E. Poindron
1, M. Rouger
4, A. Sauvageon
1, and T. Tourrette
1 1CEA-Saclay, DSM/DAPNIA/Service d’Astrophysique, 91191 Gif-sur-Yvette Cedex, France,
2
CEA-Grenoble, LETI, 17, rue des Martyrs, Grenoble Cedex 9, France,
3
CEA-Saclay, DSM/DAPNIA/SIS, 91191 Gif-sur-Yvette Cedex, France,
4
CEA-Saclay, DSM/DAPNIA/SEDI, 91191 Gif-sur-Yvette Cedex, France Received date; Accepted date
Abstract.For the first time in the history of high energy astronomy, a large CdTe gamma-ray camera is operating in space. ISGRI is the low-energy camera of the IBIS telescope on board the INTEGRAL satellite. This paper details its design and its in-flight behavior and performances. Having a sensitive area of 2621 cm2
with a spatial resolution of 4.6 mm, a low threshold around 12 keV and an energy resolution of ∼ 8% at 60 keV, ISGRI shows absolutely no signs of degradation after 9 months in orbit. All aspects of its in-flight behavior and scientific performance are fully nominal, and in particular the observed background level confirms the expected sensitivity of 1 milliCrab for a 106
s observation.
Key words.Space Telescope, Cadmium Telluride Detectors, Gamma-ray Astronomy, Calibration, INTEGRAL, IBIS.
1. Introduction
A spectral coverage from several tens of keV to sev-eral MeV was one of the main requirements for the INTEGRAL imager IBIS (Ubertini et al., 2003). It is diffi-cult with a single detector and its electronic chain to cover more than two decades in energy. For that reason, the IBIS detection unit uses two gamma cameras, ISGRI covering the range from 15 keV to 1 MeV and PICsIT (Labanti et al. 2003) covering the range from 170 keV to 10 MeV. This paper describes the ISGRI gamma camera and reports its ground performance and its flight behaviour. The in-flight calibration is reported by Terrier et al. (2003). Detectors in space are affected for some time after the passage of charged particles such as cosmic-ray protons that deposit a huge amount of energy. A very large detector such as the gamma camera of the SIGMA telescope on board GRANAT (Paul et al. 1991) is crossed several times per millisecond. As a result, the overall performances, and par-ticularly the spatial resolution, are degraded at low energy.
Send offprint requests to: F. Lebrun (flebrun@cea.fr)
⋆ Based on observations with INTEGRAL, an ESA project
with instruments and science data centre funded by ESA member states (especially the PI countries: Denmark, France, Germany, Italy, Switzerland, Spain), Czech Republic and Poland, and with the participation of Russia and the USA.
Pixel gamma-cameras, where each pixel is an independent detector with its own electronic chain, avoid this problem since the average time between two successive protons in a single detector can be relatively long; allowing for a com-plete recovery of the electronics. Moreover, the angular resolution of pixel gamma cameras is independent of en-ergy and can be made as good as permitted by the power consumed and dissipated by the large number of electronic chains. This and the need to ensure a low threshold below 20 keV were the main drivers for the design of the ISGRI gamma camera. The spectral performance, the ability to operate at ambient temperature and the technological ma-turity of the cadmium telluride (CdTe) manufacturing led to the choice of this semi-conductor that was never used to build a large gamma camera neither in space nor even on ground.
2. Instrument requirements
The scientific requirements concerned the energy range, the sensitivity, the spatial resolution, the timing accuracy and the spectral performance. The energy range should offer an ample overlap with the X-ray monitor JEM-X (Lund et al., 2003) on one side and PICsIT on the other side. The sensitivity should be close to that attained by OSSE (Johnson et al., 1993). The spatial resolution should allow a sufficient sampling of the mask pattern in order not
2 Lebrun et al: ISGRI
Fig. 1.View of the 8 ISGRI MDUs (white color) at the bottom of the passive shield well (black color) after integration in the IBIS detection unit at LABEN premises. Four DBBs (black boxes with a red connector cap) are visible on the shield side (Courtesy IAS).
to degrade the sensitivity. The timing accuracy should be good enough to allow digital coincidences between ISGRI and PICsIT. There were no strong requirements on the spectral performance. As far as engineering requirements were concerned, the total power consumption was limited to 130 W and the weight to ∼ 30 kg. The experiment should be able to sustain the space and launch conditions, i.e. temperature range, particle irradiation, electromag-netic interferences and vibrations. An important reliability requirement was that no single point failure could induce a loss of data exceeding 20%.
3. Instrument design
Figure 1 is a view of the detection plane of the ISGRI cam-era formed with 8 independent modules. Each pixel of the camera is a CdTe detector read out by a dedicated inte-grated electronic channel. Altogether, there are 16384 de-tectors (128×128) and as many electronic channels. Each detector is a 2 mm thick CdTe:Cl crystal of 4×4 mm by side with platinum electrodes deposited with an electroless (chemical) process. The ACRORAD company provided 35 000 detectors in total for the various models of ISGRI. All detectors have been screened for their spectroscopic performance and stability under a 100 V bias at 20◦C.
Observed instabilities led to the rejection of about 10% of the detectors. With regard to the spectral performance, the lot has been found very homogeneous. Degradation of the spectroscopic performance of the detectors under pro-ton irradiation has been evaluated with accelerator tests
(Lebrun et al. 1996) and found not to be a concern in the context of the INTEGRAL mission.
The large difference in the electron and hole mobili-ties in CdTe implies that the pulse rise-time depends on the interaction depth. As a result, a wide range in the pulse rise-time (0.5 – 5 µs) is observed and the adopted shaping time is a compromise between the response to fast and slow pulses. Celestial low energy photons, below 50 keV, always induce fast pulses. At higher energy, slow pulses may be induced but are still less numerous than the fast ones. As a result, a shaping time around 1.5 µs has been chosen and the ballistic losses are important for slow pulses. The optimum temperature for the detector stability and spectral performance is around 0◦C. PICsIT
having a similar requirement, IBIS and INTEGRAL have been designed to provide an operational range around this value. In view of the number of independent channels, in-tegrated electronics are necessary. A low noise and very low power consumption (2.8 mW/channel) Application Specific Integrated Circuit (ASIC) has been designed for the readout of 4 channels (Arques et al. 1999). It allows for the simultaneous measurement of the height and the rise time of every pulse. The RMS noise of the preamplifier is 165 e− (1pF input capacitance) allowing good
spec-tral performance down to ∼ 12 keV. This chip has many functionalities. For every channel, the low-threshold (0-70 keV) and the gain are both adjustable as well as the ASIC output gain and high threshold (around 1 MeV). An event significantly above 1 MeV may saturate the preamplifier and destabilize the baseline. For that rea-son, a system to reset the ASIC and restore the baseline
Lebrun et al: ISGRI 3
was implemented since cosmic-ray particle may generate very high energy deposits. Internal generators can sim-ulate 60 keV and 600 keV events of various rise times. Finally, the output of every channel can be disabled. The layout used a radiation hardened library of components so that the chip is latch-up free and only weakly sensi-tive to Single Event Upsets (SEU). Sixteen detectors are mounted on one side of a multilayer ceramic plate that hosts 4 ASICs on the other side. The spacing between detectors is 600 µm. The detectors are connected to the ASICs through vias in the ceramic substrate. The elec-tronics is protected with an hermetic titanium cover. An alumina plate with a copper flash covers the detectors to provide the bias (∼ 100 V) and radiates away part of the heat dissipated by the ASICs. The thickness of ev-ery component (except detectors) have been minimized to optimize the transparency to gamma-rays. As a result, this 4×4 micro camera, called polycell, shown in figure 2, weights less than 5g. The polycells are glued and their twelve pins soldered on a multi-layer printed circuit board stiffened with an aluminium grid. Each cell of the grid con-tains a polycell. There are 8 rows of 16 polycells each. A Field Programmable Gate Array (FPGA) allows to disable each of the 8 polycell-rows. With 2048 detectors, the so formed Modular Detection Unit (MDU) represents 1/8 of the ISGRI detection area. Two thermal probes are placed on the MDU frame, one on the long side (TEMP1) and one on the short side (TEMP2).
Each MDU is connected to a Detector Bias Box (DBB) that delivers a very stable bias voltage in the range 60 V – 160 V and routes the commands and signals to a Module Control Electronics (MCE). The MCE configures the ASICs, encodes the pulse height and rise time and processes the housekeeping data. Multiple triggers within a single MDU are discarded (after encoding). The ASIC configuration is stored in a context table containing the pixel status, thresholds and gains as well as the MDU bias.
Fig. 2.Front side of one of the 1024 ISGRI polycells. The 4×4 detectors can be seen in sandwich between the ce-ramic plates.
The detector stability cannot be guaranteed at 100% and this was a concern since a noisy detector triggering continuously precludes the detection of gamma rays. A Noisy Pixel Handling System (NPHS) was therefore im-plemented in the MCE to automatically switch off (or raise the low threshold) of noisy pixels. This system has got one counter per pixel (PC) and one counter per module (MC). Two maximum values, PCM and MCM are defined. If MC reaches MCM, all counters are reset but if one PC (out of 2048) reaches PCM, the relevant pixel low threshold is raised by one step before the counter reset, unless it is already at the maximum value (LTM). In that case, the NPHS disables the relevant pixel and resets all counters. Once per hour every pixel having a low threshold lower than step 63 (70 keV) is enabled. If the pixel is noisy, it will be disabled immediately, on the other hand, if quiet it will stay ON. This allows for the recovery of pixels that are noisy only for a short period. This dynamic tuning of each MDU guaranties the best MDU functionality in spite of the unpredictable detector behavior. The PCM and MCM values governs the NPHS sensitivity. Values of 3 for the PCM and 100 for the MCM were perfectly adapted to the detector behavior in the laboratory. Each MDU with its DBB and MCE forms a fully independent gamma camera. This independence implies that any single point failure cannot induce a loss of more than 12.5% of the sensitive area. The data relative to single events from each MCE are transferred to the ISGRI Fifo Data Manager (IFDM) that encodes the arrival time of the events, sorts the events in time and transfers them to the IBIS Hardware Event Processing Interface. This HEPI ensures the coincidence with PICsIT, the high energy camera, and transfers the data to the Data Processing Electronics (DPE) that for-mats the telemetry. Trigger rates, temperatures and tech-nological parameters are directly transmitted to the DPE in the housekeeping data. The IFDM, HEPI and DPE are cold redundant to maintain the overall reliability. To reject the prompt background due to cosmic-ray protons, the IBIS detection unit is surrounded with a VETO BGO de-tector that delivers a programmable strobe to the IFDM. The ISGRI events in coincidence with this strobe are dis-carded. A 22
Na tagged source provides an on-board cal-ibration system. This calcal-ibration source delivers also a strobe to the IFDM. Events in coincidence with the cali-bration source are marked in the IFDM with a calicali-bration flag. The programmable delay and width of the VETO and calibration strobes are identical. Four MCEs and one IFDM are fitted in an ISGRI Electronics Box (IEB). There are two IEBs, all MCEs being connected to the two IFDMs for redundancy. After selection on the rise time (low and high thresholds) and the energy (high threshold), all the information relative to every valid ISGRI event (time, detector address, pulse height, pulse rise-time) is down-linked.
4 Lebrun et al: ISGRI
Fig. 3.ISGRI image of the Cygnus region in the 15–40 keV energy range.
4. Camera performance
4.1. In flight detector behaviour
Since launch, the measured temperature at the detector-layer level is comprised between −10◦C and +10◦C, i.e.
very close to the expected temperature. The hole mobil-ity is smaller at lower temperature and consequently, the pulse rise-time increases. As a result, ballistic losses are higher and the energy resolution is worse. Increasing the bias voltage allows to maintain the pulse rise-times in the filter bandpass. While in the laboratory at 20◦C the bias
was usually set to 100 V, it was set to 120 V in flight. The first camera switch-on in orbit was done progressively, MDU by MDU. When the first one was switch-on, it was noticed that the NPHS was switching-OFF pixels at a very high rate, nearly one per second, so that the MDU was shortly nearly blind. This was the result of isolated bursts of triggers in single detectors, appearing randomly in the MDU, hardly attributable to detector behavior. This is most likely the result of preamplifier overload may be due to ∼10 MeV electrons passing through the mask holes. The maximum number of consecutive triggers observed in a detector was about one hundred. Setting the PCM to 200 and the MCM to 10 000 allowed a full recovery of the MDU functionality.
However, with these values, the NPHS is much less sensitive and the pixel low thresholds are less accurately adjusted. A fine adjustment of the low thresholds is per-formed at the ISDC on the basis of the pixel spectra regis-tered in the previous orbit (Terrier et al. 2003). For the few tens of detector per MDU exhibiting unreasonable spectra, the low thresholds were set to step 63, i.e. disabled. After an initial period with a fast increase of the number of dis-abled pixels, some sort of saturation was reached with ∼
400 detectors disabled. The pulse rise-time of the consecu-tive triggers is always zero. To avoid a telemetry overload, the on-board software was modified to reject events with a pulse rise-time lower than a predefined value (rise-time low threshold). After 9 months in orbit, the ISGRI de-tectors show no sign of degradation. The only significant change with regard to the ground behavior is the thermal gradient along the detection plane. This is due to vacuum conditions that change the thermal balance (Terrier et al., 2003). This proves that CdTe can be safely used in space.
4.2. Imaging performance
The sensitivity of a coded mask telescope depends on the ability of the camera to finely sample the shadowgram. This so called imaging efficiency is governed by the ratio of the smallest mask elements and the detector spatial res-olution. For pixel cameras such as ISGRI and PICsIT it is energy independent and should be insensitive to the space conditions. This is a definitive advantage over the Anger gamma camera where a monolithic scintillator is read out by many photomultiplier tubes. As a matter of fact, the Anger gamma camera spatial resolution varies with en-ergy and is strongly degraded by the effect of cosmic-ray protons. The 4 mm ISGRI pixels are spaced every 4.6 mm ensuring, with 11.2 mm mask elements, an excellent imag-ing efficiency of 0.86. With a mask-ISGRI distance of 3.2 m the angular resolution is 12′ and a 10σ source can be
localized with an accuracy of 1′. The total ISGRI area
is around 3600 cm2
but dead zones between pixels and between MDUs restrict the sensitive area to 2621 cm2
. In addition, about 3% of the pixels are switched off at any given time, increasing accordingly the dead zone area. Finally some pixels have a threshold higher than the
min-Lebrun et al: ISGRI 5
imum. Below their threshold, they can be considered as disabled. The data processing, in particular the image de-convolution takes all these effects into account (Goldwurm et al. 2003). As a result, ISGRI produces the finest im-ages obtained so far in the soft gamma-ray domain. This performance is illustrated in figure 3 that shows a pic-ture of the Cygnus region in the energy range 15-40 keV where at least 3 sources are clearly visible and studied in other papers of this volume: Cygnus X-1 (Bazzano et al. 2003), Cygnus X-3 (Goldoni et al. 2003) and EXO2030-338 (Kuznetsov et al. 2003).
4.3. Timing accuracy
ISGRI timing is used to establish coincidences with the PICsIT, VETO and calibration source and also to provide useful scientific information. ISGRI records the event time with a 240 ns precision. However, there is a very important jitter, mainly due to the variety in pulse rise-times, result-ing in a FWHM timresult-ing accuracy of the order of 2.5 µs. The strobe width has been adjusted to 5 µs as a compro-mise between the VETO efficiency and the induced dead time. Due to telemetry limitations the relative accuracy accessible for source timing studies is degraded to 61 µs. Taking into account systematic errors the final absolute timing accuracy is of the order of 90 µs (at 3σ).
4.4. Energy range
The low energy threshold of IBIS/ISGRI results from the detector/electronics noise and the transparency of the in-tervening material (mask, polycell caps). As far as the camera is concerned, a low threshold of 12 keV is attained. However the opacity of the mask is very low at this energy and the low threshold was conservatively set to 13 keV. Moreover, the noise renders the data processing more dif-ficult close to the low threshold. The precise value of the effective low threshold remains to be determined but is certainly lower than 15 keV (the Crab is clearly seen be-tween 14 and 17 keV). The high threshold allowed by the electronics is ∼ 1 MeV and was never changed.
4.5. Spectral response
In a pixel camera such as ISGRI, every pixel is a spec-trometer chain with its own characteristics. The spectral performance of the camera depends therefore critically on the alignment of the pixel gains and offsets. This align-ment is performed in two steps. First, the electronics al-low for a rough alignment and second, a fine software cor-rection must be applied. This and the temperature effect is detailed in the next section. Since Compton scattering plays a large role, the spectral response of a gamma-ray instrument operating in the soft gamma-ray domain is al-ways complex. The spectral response of IBIS and ISGRI in particular was estimated with Monte-Carlo simulations
Fig. 4. Contour plot of the count per pulse-height and pulse rise-time bins.
carefully built to reproduce the calibration measurements (Laurent et al., 2003).
4.5.1. ISGRI MDU tuning and ground calibration
The 8 flight and the spare MDU have been successively mounted in 3 test benches ensuring a thermal control be-tween −15◦C and 30◦C. First the ASICs gains were
ad-justed to minimize the dispersion in the pulse-height and rise-time gains. The ASIC configuration was then stored in the ISGRI context that is loaded in the ASICs every 4 s to minimize the effect of a SEU in flight. The actual pulse height and rise-time gains and offsets were deter-mined for every pixel to allow fine software corrections that are mandatory for a proper spectral response of the whole MDU. Then the average gains of each MDU were set by resistor adjustment and the MDU calibration could proceed. Since the flight temperature was not precisely known, spectral calibration measurements were performed using various radioactive sources at different temperatures and bias voltages. This represents hundreds of measure-ments and more than 50 000 hours of data acquisition. The dependence of the gains and offsets with temperature and bias voltage was carefully calibrated. While the offsets are almost independent of the temperature, the pulse-height and rise-time gain variations are respectively 0.4% deg−1
and 3.3% deg−1. Gain corrections for temperature
varia-tions are therefore necessary and are based on the MDU thermal probe measurements.
4.5.2. Charge loss correction
Because of the charge loss, the ISGRI spectral response is rather unusual above 60 keV. This is illustrated in figure 5 that displays a pulse-height spectrum obtained with a collimated 139
Ce source. The line at 166 keV exhibits a plateau in its left wing at half the height of the line. On the other hand, the 33 keV blend of lines doesn’t have this wide left wing. This high-energy behavior is due to
6 Lebrun et al: ISGRI
Fig. 5. Pulse height spectrum acquired at 0◦C with the
spare MDU biased at 120 V and illuminated by a 139
Ce source.
the ballistic losses that are important for slow pulses, i.e. due to interactions close to the anode. The longer is the rise-time, the more important are the losses. At 33 keV, all interactions take place close to the cathode and pro-duce fast pulses. The charge loss is negligible in this case. At 166 keV, a significant fraction of the interactions oc-curs near the anode and the pulse height alone can no longer represent the energy deposited. Measuring simul-taneously the pulse height and the pulse rise-time allows for a proper energy estimate. The relationship between the charge loss and the pulse rise-time is illustrated in figure 4 that displays the measured pulse height as a function of the pulse rise-time. Below 60 keV, lines appears as verti-cal ellipsoids in this bi-parametric diagram. Their vertiverti-cal elongation is due to the uncertainty in the pulse rise-time measurement that is more difficult for weak pulses. At higher energy, lines appear as inclined tracks. From this, it can be seen that a 166 keV energy deposit occuring close to the anode (rise time ∼ 5 µs) gives a pulse of 50– 60 keV. These bi-parametric diagrams are the basis of the charge loss correction. Each point of this diagram, a cou-ple of pulse-height and pulse rise-time, should correspond uniquely to an energy. This is generally the case except in the top-left region of the diagram where medium and low energy can be mixed. The effect of this correction is illus-trated with the spectrum displayed in figure 6. Rejecting events with rise-time greater than 4.5 µs avoids most of the confusion region above mentioned and represents only a loss of a few percent in efficiency. By comparison with figure 5, one notes that the plateau below the 166 keV line is strongly reduced and that the peak is significantly enhanced. Athough the peak is much more symmetric, large wings are present in the line profile. They are due to long rise-time events that have a much worse energy resolution. The line shape is not gaussian and the FWHM should be taken with care. Selecting only events with rise-time shorter than 0.6 µs improves drastically the spectral performance (see Fig. 7) at the expense of the efficiency that is reduced by ∼ 70%. In this case, the line profile is almost gaussian.
Fig. 6. 139
Ce spectrum corrected for the charge loss. Events with pulse rise-time longer than 4.6 µs have been discarded.
Fig. 7. 139
Ce spectrum corrected for the charge loss. Events with pulse rise-time longer than 0.6 µs have been discarded.
4.5.3. Spectral performance
The spectral performance depends on the temperature and the bias voltage. Measurements on the flight model MDUs have been performed at various temperatures but mostly with a 100 V bias. Figure 8 illustrates the ISGRI spectral resolution as a function of energy. This is based on measurements performed on MDU 2 with a 100 V bias at 0◦C. Since the performance depends on the
se-lection applied on the pulse rise-time, two extreme cases have been considered: no selection and only pulse rise-time equal to 0.5µs. While there is almost no difference up to 60 keV, the spectral performance with no selection degrades rapidly above this energy to reach a maximum difference of a factor of 3 near 250 keV. Then the spec-tral performance for short pulses is almost independent of energy with ∆E (FWHM)/E around 0.03. Measurements at 0◦C with various bias have been performed using a
radioactive source of 139
Ce both on MDU 2 and on the spare MDU. The results are compatible indicating a 7% improvement in the energy resolution (without rise-time selection) when rising the bias from 100 V to 120 V. There
Lebrun et al: ISGRI 7
Fig. 8. Spectral performance of ISGRI estimated from MDU 2. Two extreme cases are considered: without any selection on the rise time and with rise time equal to 0.5 µs only.
is a small degradation with the time after the bias is set (∼ 4% after 100h). Possible drifts in the detector response can be tracked thanks to the on-board tagged radioactive source of22
Na that produces photons at 511 and 1275 keV and induces lines at 60 and 75 keV from the fluorescence of tungsten and lead (Terrier et al. 2003).
4.6. ISGRI Sensitivity
4.6.1. Efficiency
The efficiency of the ISGRI camera depends first on the detector efficiency. Although very thin, 2 mm, the detec-tion efficiency of the ISGRI detectors is still around 50% at 150 keV. This is due to the high atomic numbers of Cd and Te and also to the high density, ∼ 6 g cm−3, of the
CdTe. However, the overall efficiency depends also on the intervening absorbing material, the mask and the polycell caps. Although every effort has been given to maximize their transparency, they have a major effect at low en-ergy. The overall efficiency is given in figure 9. Due to the opaque mask elements, the overall efficiency is reduced by a factor of 2. The imaging efficiency was also taken into account in the overall efficiency. Below 20 keV, the mask transparency becomes so weak that the effective low threshold of ISGRI is not anymore governed by the detec-tor and electronic noise.
4.6.2. Dead time
The overall ISGRI dead time is due to the ISGRI event processing time and to the coincidence applied with PICsIT, VETO and the calibration source. The optimum anticoincidence width, depending on the background level, has been determined in flight during the INTEGRAL com-missioning phase to be 5µs .The ISGRI event processing time is 114 µs and the trigger rate per module is around 800 s−1 so that the associated dead time is around 9%.
Even more significant is the dead time due to the
co-Fig. 9.ISGRI detection efficiency (solid line). The detec-tor efficiency (dashed line), the mask hole transparency (dashed-dotted line) and the polycell cap transparency (dotted line) are also given. Note that since half of the mask elements are opaque, the ISGRI detection efficiency has been divided by a factor two
incidences. The VETO and the calibration source count rates are respectively 2.5 × 10⁴
s−1 and 5.6 × 10³
s−1
in-ducing dead times of 12.5% and 2.8% respectively. The PICsIT count-rate is 4.5 × 10³
s−1, with a coincidence
width of 3.8µs it induces a dead time on ISGRI of 1.7%. The VETO, CAL and PICsIT events being independent, the overall ISGRI dead time is of the order of 24%.
4.6.3. Background
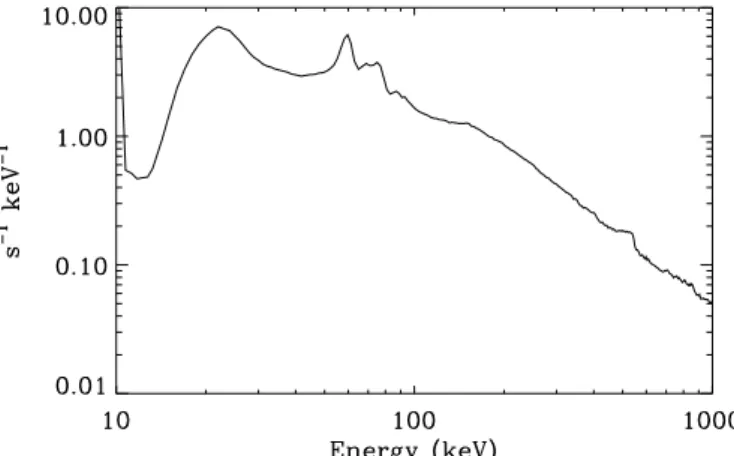
In the case of ISGRI, the most critical and uncertain per-formance parameter was the background spectrum. The low energy part (E<100 keV) is dominated by extragalac-tic emission and is relatively well known (Kinzer et al., 1997; Watanabe et al. 1997). On the other hand, the high energy part of the spectrum is dominated by the inter-nal background. It is due mainly to the de-excitation of nuclei produced by the spallation reactions of cosmic-rays on the instrument. It was uncertain because it could not be extrapolated from a previous mission and Monte-Carlo simulations have not yet reached the required accuracy. It was critical not only because it impacts directly on the experiment sensitivity but also because it could induce a telemetry overflow. This spectrum displayed in figure 10 is close to the expectations.
4.6.4. Broad-band sensitivity
The ISGRI sensitivity can be computed from the observed background spectrum (Fig. 10) and the above reported efficiency (Fig. 9) and dead time estimate. Figure 11 gives this ISGRI broad-band (∆E=E/2) sensitivity at 3σ for an observing time of 106
8 Lebrun et al: ISGRI
Fig. 10. ISGRI background spectrum observed while INTEGRAL was pointing to an empty field.
Fig. 11.ISGRI broad-band sensitivity.
5. Conclusion
Today, after 9 months of in-flight operations, there are no signs of detector degradation. The ISGRI performance is fully nominal. The observed background, very close to the expectations, implies a milliCrab sensitivity for a 106
s observing time. CdTe was known for its very good poten-tial as a gamma-ray spectrometer and it is now proven that a large detector can be realized and safely used in space. The ISGRI camera produces the best images ever obtained in the soft gamma-ray domain. In the coming years, CdTe (or CdZnTe) will undoubtedly play a key role in instrumental high-energy astrophysics.
Acknowledgements. The authors would like to thank – CNES
– the IAS team in Roma – the LABEN team in Milano
– and the INTEGRAL project team at ESA
for their indefectible support during the difficult phases of the programme.
References
Arqu`es M., Baffert, N., Lattard, D. et al. 1999, IEEE Trans. on Nucl. Sc., 46, 3
Bazzano A., Bird, A.J., Capitanio, F. et al. 2003, this volume
Goldoni P., Bonnet-Bidaud, J.-M., Falanga, M. and Goldwurm, A., 2003, this volume
Goldwurm A., David, P., Foschini, L. et al., 2003, this volume Johnson, W.N., Kinzer, R.L., Kurfess, J.D. et al., 1993, ApJS,
86, 693
Kinzer, R. L., Jung, G. V., Gruber, D. E., Matteson, J. L., and Peterson, L. E. 1997, ApJ, 475, 361
Kuznetsov, S., Goldwurm, A., Blay, P. et al., 2003, this volume Labanti, C., Di Cocco, G., Ferro, G. et al., 2003, this volume Laurent P., Limousin, O., Cadolle-Bel, M. et al. 2003, this
vol-ume
Lebrun, F., Blondel, C., Fondeur, I., Goldwurm, A., Laurent, P. and Leray, J.-P., 1996, SPIE proc. 2806, 258
Lund, N., Budz-Jorgensen, C., Westergaard, N.J. et al., 2003, this volume
Paul, J., Mandrou, P., Ballet, J. et al., 1991, Adv. Sp. Res., 11, 289
Terrier, R., Lebrun, F., Sauvageon, A. et al., 2003, this volume Ubertini P., Lebrun, F., Di Cocco, G. et al. 2003, this volume Watanabe, K., Hartmann, D. H., Leising, M. D., Share, G. H., and Kinzer, R. L. 1997, in AIP Conf. Proc. 410, The Fourth CGRO Symposium, ed. C. D. Dermer, M. S. Strickman and J. D. Kurfess (New York: AIP), 1223