HAL Id: cea-02509717
https://hal-cea.archives-ouvertes.fr/cea-02509717
Submitted on 17 Mar 2020
HAL is a multi-disciplinary open access
archive for the deposit and dissemination of sci-entific research documents, whether they are pub-lished or not. The documents may come from teaching and research institutions in France or abroad, or from public or private research centers.
L’archive ouverte pluridisciplinaire HAL, est destinée au dépôt et à la diffusion de documents scientifiques de niveau recherche, publiés ou non, émanant des établissements d’enseignement et de recherche français ou étrangers, des laboratoires publics ou privés.
Evaluation of the Effect of Burn-up on Neutron Flux
and Reaction Rate Distributions in the TRIGA Mark II
Reactor
Z. Stancar, L. Barbot, L. Snoj
To cite this version:
Z. Stancar, L. Barbot, L. Snoj. Evaluation of the Effect of Burn-up on Neutron Flux and Reaction Rate Distributions in the TRIGA Mark II Reactor. PHYSOR 2016 : Unifying Theory and Experiments in the 21st Century, May 2016, Sun Valley, United States. �cea-02509717�
Extended Summary for the PHYSOR 2016 Conference
Evaluation of the Effect of Burn-up on Neutron Flux and
Reaction Rate Distributions in the TRIGA Mark II Reactor
ˇ
Ziga ˇStancara, Lo¨ıc Barbot b, Luka Snoj a
a Joˇzef Stefan Institute, Jamova cesta 39, SI-1000 Ljubljana, Slovenia
b CEA, DEN, DER, Instrumentation Sensors and Dosimetry Laboratory, Cadarache,
F-13108, Saint-Paul-Lez-Durance, France August 2015
1. Introduction
At the Reactor Physics Department of the Joˇzef Stefan Institute (JSI) a detailed Monte Carlo geometrical model of the TRIGA Mark II research reactor has been developed. It has been continuously utilized for the calculation of reactor parameters and in the support of the design and safety assessment of various experiments [1, 2]. A series of experiments aimed at measuring the core neutron flux and reaction rate distributions has been performed with the objective of comparing the measurements and Monte Carlo calculations – the ultimate goal being the validation of the computational model.
One of the performed validation experiments was based on measurements of in-core axial fission rate profiles using CEA developed miniature fission chambers [3]. During the extensive analysis, accompanying the proposal of including the experiment into the International Reactor Physics Experiment Evaluation Project Handbook, support neutron transport calculations were performed. Due to low average burnup of fuel (< 5 MWd) in the TRIGA reactor the basic computational model used in the evaluation process contained fresh fuel, which is a homogenous mixture of uranium and ZrH containing 12 wt % uranium with 20 % enrichment. However in an effort to identify major modelling biases a detailed study of the TRIGA fuel burnup and its effects on the neutronic properties of the core was conducted.
Although this topic has already been tackled using similar approaches to calculating the fuel burnup [4–6], the research in the paper represents a step forward regarding the detailed Monte Carlo analysis of crucial reactor parameters and most importantly validating the results of the burnup calculations against in-core fission chamber measurements. In the paper the method for assessing the burnup and computing the consequent isotopic composition of individual fuel elements will be presented. The latter will be used to construct several Monte Carlo models of the reactor, each distributing different radial and axial distributions of fuel burnup. Its effect on the multiplication factor of the reactor model, neutron spectra, neutron flux and reaction rate distributions will be shown and concluded with a measurement to calculation comparison. 2. Burnup Assessment
A common approach to modelling burnup in Monte Carlo codes is to use a separate code for the calculation of isotopic composition and use it as an input for further neutron transport calcula-tions. By coupling of the codes one gains a comprehensive tool for burnup analysis – examples of such an approach are the VESTA code [7], CINDER package [8] and MONTEBURNS [9].
The method used for the evaluation of the TRIGA fuel burnup comprises the following procedures – in the initial step an in-house developed TRIGLAV software was used, which is a program package intended specifically for reactor core management in the TRIGA Mark II research reactor [10]. In order to calculate the burn-up of individual fuel elements at the time of the experiment the operating time of the reactor up to the specific date had to be
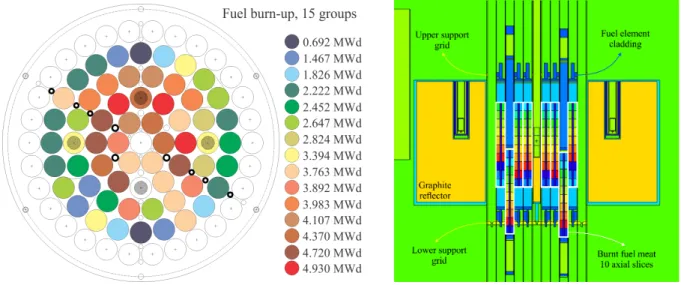
assessed. The JSI TRIGA reactor does not operate continuously, which means that the operating power and duration are strongly dependent on the required conditions in the core which differ greatly between experiments. An approximate estimate of the total thermal power produced by the reactor since its reconstruction in 1991 was obtained from the reactor operation logbooks, where it was found that after 20 years of operation the average burn-up of the TRIGA fuel is approximately 2.2 MWd, which correspond to 25 days of operation at full steady state power of 250 kW per year. The operation time was used as an input for the TRIGLAV program which, upon solving the four group diffusion equation, returned burnup values for each of the 56 fuel elements that were part of the core configuration. The core elements were distributed into 15 groups depending on the individual burnup levels, shown left in Figure 1, with their burnups varying from 0.7 MWd to 4.9 MWd.
Figure 1: Left – Top view of the TRIGA core denoting the positions of fuel elements and their burn-up in MWd. Right – Scheme of the Monte Carlo model of the TRIGA rector core depicting the different radial and axial levels of fuel meat burnup, denoted with white rectangles (material colors are symbolic).
In the following step the change in isotopic composition of the burnt fuel was calculated using the ORIGEN 2.2 computer code in combination with the enclosed PWR libraries [11]. Albeit these libraries are not an ideal solution due to some difference between the spectra in a PWR and a TRIGA reactor, they are suitable for an assessment study. The burnup levels of a specific element group were input into the code, calculating the masses of fission products in the fuel meat in approximately 30 time steps. Special attention was paid to the production of isotopes which significantly affect the effective cross section of the fuel, with either absorption, scattering or fission reactions. It was found that the maximum fuel burnup of 5 MWd corresponds to approximately 14 % 235U weight deficit.
The TRIGLAV two-dimensional burnup calculations are executed for simplified fuel cells with effective cross sections averaged over the whole volume of the fuel meat, although the neutron flux distribution in the core distributes an axial dependency. Two typical profiles of fission rates on 235U and 238U are presented in Figure 2, where neutron flux core form can be seen. Expectedly it is greatest at core mid-plain where the center of the fuel meat is located and decreasing toward the upper and lower support grid of the reactor. This being a crucial factor in the calculation of reaction rate axial dependency, the fuel in the elements was additionally divided into 3, 5 and 10 axial steps. Using the Monte Carlo flux distribution calculations, the integral of flux in each of the equidistant axial parts was calculated and weighted relative to the average flux in the full fuel volume. The axial isotopic weight factors were thus obtained with which the isotopic composition of axial fuel slices for specific burnup groups was constructed. The calculated material composition was included in the Monte Carlo model of the TRIGA reactor where the fuel burnup was thus described with up to 170 cells exhibiting different materials and isotopic composition, corresponding to the axial flux distribution. A scheme of the TRIGA Mark II Monte Carlo model with implemented 10 axial burnup slices can be seen on the right-hand
side of Figure 1.
Figure 2: Normalized fission rate profiles calculated for the 235U and 238U isotopes. The axial distance is normalized to the upper support grid of the reactor, increasing towards the bottom support grid.
3. Monte Carlo Neutron Transport Calculations
After implementing the isotopic composition of the burnt fuel into the Monte Carlo model of the reactor and distributing it into a number of axial slices, neutron transport calculations were performed using the state of the art Monte Carlo computer code MCNP 6.1 [12] and the extensively validated ENDF/B-VII.1 nuclear data library [13].
Special attention is paid to the values of the effective multiplication factor of the reactor model – namely the kef f in the initial computational model of the reactor containing fresh
fuel implied on a supercritical system with a value of 1.042. In the paper the dependency of the effective multiplication factor on the different combinations of radial and axial fuel burnup composition is presented, where it is shown that one can approach criticality and achieve a decrease of kef f of up to approximately – 0.013.
The study of the effect of fuel burnup on neutron flux is presented next – it will be shown, that due to highest fuel burnup around the mid-plane of the reactor core and lower levels of burnup towards the top and bottom of the fuel the relative distribution of the neutron flux changes. In the paper radial flux profiles at different heights of the reactor core are shown and the relative difference between computations performed with fresh and burnt fuel material will be presented. The differences in neutron spectra in various positions in the core of the reactor will also be discussed. It will be shown that due to the change in ratio between the number density of 235U and 238U and the build up of plutonium isotopes in the fuel meat, which consequently results in the alteration of the absorption to fission ratio, a slight shift of the neutron spectrum towards higher energies is observed.
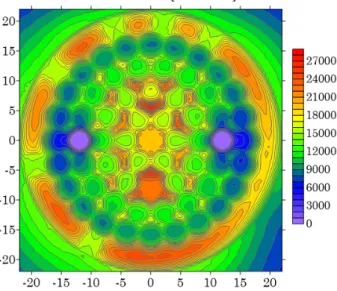
Due to changes in the core distribution of the neutron flux and different neutron spectra in a burnt core one can also anticipate changes in reaction rate values. In the paper an investigation into the results of Monte Carlo reaction rate computations with core burnup will be presented, focusing on the characteristics of fission reactions on 235U and 238U isotopes. A235U fission rate profile at core mid-plain can be seen in Figure 3.
In addition to radial reaction rate differences between a fresh and burnt core the effect on axial distributions will also be studied. Several fission rate profiles will be presented where it will be shown that there is a significant difference to be seen between the two uranium isotopes. As expected the fission rate for both isotopes decreases at the center of the core after burnup, the relative difference being approximately – 14 % for 235U and – 5 % for 238U. The fission rate at the edges of the core however increases in comparison to the fresh core computations which is a
Figure 3: Radial235U fission rate profile at reactor core mid-plane. The dimensions of the core are in centimetres.
result of lower burnup levels on the top and bottom of the fuel meat and the effect of axial flux redistribution. The results of reactor parameter analysis will be used to assess the experimental bias of the benchmark measurements of fission rate profiles. These were conducted using two different types of absolutely calibrated fission chambers, one with a fissionable coating composed mainly of235U and the other of238U, at multiple locations inside the core of the TRIGA Mark II reactor. The paper demonstrates the characteristics of the measured axial profiles and analyses the effect of isotopic composition of the burnt fuel on the absolute values of the fission chamber response. In conclusion the fission rate measurements and the Monte Carlo computations will be compared, where it will be shown that the two quantities show good agreement within the evaluated uncertainties, representing another milestone in the validation process of the Monte Carlo model of the TRIGA reactor.
[1] L. Snoj et al., “Analysis of neutron flux distribution for the validation of computational methods for the optimization of research reactor utilization,” Applied Radiation and Iso-topes, vol. 69, no. 1, pp. 136–141, 2011.
[2] L. Snoj, A. Kavˇciˇc, G. ˇZerovnik, and M. Ravnik, “Calculation of kinetic parameters for mixed TRIGA cores with Monte Carlo,” Annals of Nuclear Energy, vol. 37, no. 2, pp. 223– 229, 2010.
[3] ˇZ. ˇStancar, L. Snoj, L. Barbot, and C. Domergue, “Evaluation of Fission Rate Profile Ex-perimental Benchmark at the JSI TRIGA Mark II Reactor Using Monte Carlo Method,” in Proceeding of ANS MC2015 - Joint International Conference on Mathematics and Compu-tation (M&C), Supercomputing in Nuclear Applications (SNA) and the Monte Carlo (MC) Method, (Nashville, Tennessee), American Nuclear Society, April 19-23 2015.
[4] R. Jeraj, T. ˇZagar, and M. Ravnik, “Monte Carlo simulation of the TRIGA Mark II bench-mark experiment with burned fuel,” Nuclear Technology, vol. 137, pp. 169–180, March 2002.
[5] B. E. Bakkari, T. E. Bardouni, B. Nacir, C. E. Younoussi, Y. Boulaich, H. Boukhal, and M. Zoubair, “Fuel burnup analysis for the Moroccan TRIGA research reactor,” Annals of Nuclear Energy, vol. 51, pp. 112–119, 2013.
[6] M. T¨urkmen and ¨Uner C¸ olak, “Fuel Burnup Calculation in ITU TRIGA Mark II Research Reactor by Using Monte Carlo Method,” in Proceedings of the 23rd international Conference Nuclear Energy for New Europe, Portoroˇz, Slovenia, 8 – 11 September, 2014.
[7] W. Haeck and B. Verboomen, “An optimum approach to monte carlo burn-up,” Nuclear Science and Engineering, vol. 156, pp. 180–196, 2007.
[8] W. B. Wilson, S. T. Cowell, T. R. England, A. C. Hayes, and P. Moller, A Manual for CINDER’90 Version 07.4 Codes and Data. Los Alamos National Laboratory, LA-UR-07-8412, March 2008.
[9] D. L. Poston and H. R. Trellue, User’s Manual, Version 2.0 for MONTEBURNS Version 1.0. D. L. Poston, and H. R. Trellue, LA-UR-99-4999, September 1999.
[10] A. Perˇsiˇc, M. Ravnik, S. Slaviˇc, and T. ˇZagar, TRIGLAV - A Program Package for Research Reactor Calculations. Joˇzef Stefan Institute, IJS-DP-7862, March 2000.
[11] A. G. Croff and S. Ludwig, “ORIGEN2 V2.2: Isotope Generation and Depletion Code, Matrix Exponential Method,” CCC-371, Oak Ridge National Laboratory, Oak Ridge, Ten-nessee, June 2002.
[12] Los Alamos National Laboratory, MCNP6 Users Manual – Code Version 6.1.1 Beta, LA-CP-14-00745, June 2014.
[13] M. B. Chadwick et al., “ENDF/B-VII.1 Nuclear Data for Science and Technology: Cross Sections, Covariances, Fission Product Yields and Decay Data,” Nuclear Data Sheets, vol. 112, no. 12, pp. 2887–2996, 2011.