HAL Id: hal-01485243
https://hal.inria.fr/hal-01485243
Submitted on 8 Mar 2017
HAL is a multi-disciplinary open access
archive for the deposit and dissemination of
sci-entific research documents, whether they are
pub-lished or not. The documents may come from
teaching and research institutions in France or
abroad, or from public or private research centers.
L’archive ouverte pluridisciplinaire HAL, est
destinée au dépôt et à la diffusion de documents
scientifiques de niveau recherche, publiés ou non,
émanant des établissements d’enseignement et de
recherche français ou étrangers, des laboratoires
publics ou privés.
Scientific User and Developper Guide
George Bosilca, Clément Foyer, Emmanuel Jeannot, Guillaume Mercier,
Guillaume Papauré
To cite this version:
George Bosilca, Clément Foyer, Emmanuel Jeannot, Guillaume Mercier, Guillaume Papauré. Online
Dynamic Monitoring of MPI Communications: Scientific User and Developper Guide. [Research
Report] RR-9038, Inria Bordeaux Sud-Ouest. 2017, pp.43. �hal-01485243�
0249-6399 ISRN INRIA/RR--9038--FR+ENG
RESEARCH
REPORT
N° 9038
February 2017Monitoring of MPI
Communications:
Scientific User and
Developper Guide
George Bosilca, Clément Foyer, Emmanuel Jeannot, Guillaume
Mercier, Guillaume Papauré
RESEARCH CENTRE BORDEAUX – SUD-OUEST
Developper Guide
George Bosilca
∗, Clément Foyer
†, Emmanuel Jeannot
†‡,
Guillaume Mercier
†‡§, Guillaume Papauré
¶Project-Team TADAAM
Research Report n° 9038 — February 2017 — 40 pages
Abstract: Understanding application communication patterns became increasingly relevant as the complexity and diversity of the underlying hardware along with elaborate network topologies are making the implementation of portable and efficient algorithms more challenging. Equipped with the knowledge of the communication patterns, external tools can predict and improve the performance of applications either by modifying the process placement or by changing the com-munication infrastructure parameters to refine the match between the application requirements and the message passing library capabilities. This report presents the design and evaluation of a communication monitoring infrastructure developed in the Open MPI software stack and able to expose a dynamically configurable level of detail about the application communication patterns, accompanied by a user documentation and a technical report about the implementation details. Key-words: MPI, Monitoring, Communication Pattern, Process Placement
∗Univ of Tennessee, ICL †Inria
‡Labri §Bordeaux INP ¶ATOS - BULL
scientifique et documentation technique
Résumé : La diversité ainsi que la complexité des supports de communica-tions couplées à la complexité des topologies résiliennes rendent l’implémenta-tion d’algorithmes portables et efficaces de plus en plus difficile. Il en est devenu particulièrement pertinent d’être capable d’appréhender les modèles de commu-nication des applications. Des outils extérieurs à ces applications peuvent ainsi prévoir et en améliorer les performances, à l’aide de la connaissance de ces modèles, soit en modifiant le placement des processus, soit en changeant les paramètres des infrastructures de communication afin d’affiner la correspon-dance entre les besoins de ces applications et les possibilités offertes par la bibliothèque de passage de messages. Ce rapport présente la conception et l’évaluation d’une infrastructure de surveillance des communications dévelop-pée au sein de la pile logicielle Open MPI. Celle-ci exporte divers niveaux de détails des modèles de communication et est configurable dynamiquement. Ce rapport comprend également un guide d’utilisateur ainsi qu’une documentation technique décrivant les détails d’implémentation.
Mots-clés : MPI, Surveillance, Schéma de communication, Placement de processus
1
Introduction
With the expected increase of applications concurrency and input data size, one of the most important challenges to be addressed in the forthcoming years is that of data transfers and locality, i.e. how to improve data accesses and transfers in the application.Among the various aspects of locality, one partic-ular issue stems from both the memory and the network. Indeed, the transfer time of data exchanges between processes of an application depends on both the affinity of the processes and their location. A thorough analysis of an ap-plication behavior and of the target underlying execution platform, combined with clever algorithms and strategies have the potential to dramatically improve the application communication time, making it more efficient and robust to the changing network conditions (e.g. contention). In general the consensus is that the performance of many existing applications could benefit from an improved data locality [8].
Hence, to compute an optimal – or at least an efficient – process placement we need to understand on one hand the underlying hardware characteristics (including memory hierarchies and network topology) and on the other hand how the application processes are exchanging messages. The two inputs of the decision algorithm are therefore the machine topology and the application communication pattern. The machine topology information can be gathered through existing tools, or be provided by a management system. Among these tools Netloc/Hwloc [3] provides a (almost) portable way to abstract the un-derlying topology as a graph interconnecting the various computing resources. Moreover, the batch scheduler and system tools can provide the list of resources available to the running jobs and their interconnections.
To address the second point, and understand the data exchanges between processes, precise information about the application communication patterns is needed. Existing tools are either addressing the issue at a high level fail-ing to provide accurate details, or they are intrusive, deeply embedded in the communication library. To confront these issues we have designed a light and flexible monitoring interface for MPI applications that possess the following fea-tures. First, the need to monitor more than simply two-sided communications (a communication where the source and destination of the message are explic-itly invoking an API for each message) is becoming prevalent. As such, our monitoring support is capable of extracting information about all types of data transfers: two-sided, one-sided (or Remote Memory Access) and I/O. In the scope of this report, we will focus our analysis on one-sided and two-sided com-munications. We record the number of messages, the sum of message sizes and the distribution of the sizes between each pair of processes. We also record how these messages have been generated (direct user calls via the two-sided API, automatically generated as a result of collective algorithms, related to one-sided messages). Second, we provide mechanisms for the MPI applications themselves to access this monitoring information, through the MPI Tool interface. This al-lows to dynamically enable or disable the monitoring (to record only specific parts of the code, or only during particular time periods) and gives the ability
to introspect the application behavior. Last, the output of this monitoring pro-vides different matrices describing this information for each pair of processes. Such data is available both on-line (i.e. during the application execution) or/and off-line (i.e. for post-mortem analysis and optimization of a subsequent run).
We have conducted experiments to assess the overhead of this monitoring infrastructure and to demonstrate is effectiveness compared to other solutions from the literature.
The outline of this report is as follows: in Section 2 we present the related work. The required background is exposed in Section 3. We then present the design in Section 4, and the implementation in Section 5. Results are discussed in Section 6 while the scientific conclusion is exposed in Section 7. The user documentation of the monitoring component is to be found in Section 8 with an example and the technical details are in Section 9.
2
Related Work
Monitoring an MPI application can be achieved in many ways but in general relies on intercepting the MPI API calls and delivering aggregated information. We present here some example of such tools.
PMPI is a customizable profiling layer that allows tools to intercept MPI calls. Therefore, when a communication routine is called, it is possible to keep track of the processes involved as well as the amount of data exchanged. How-ever, this approach has several drawbacks. First, managing MPI datatypes is awkward and requires a conversion at each call. And last but not least, it cannot comprehend some of the most critical data movements, as an MPI collective is eventually implemented by point-to-point communications but the participants in the underlying data exchange pattern cannot be guessed without the knowledge of the collective algorithm implementation. For instance, a re-duce operation is often implemented with an asymmetric tree of point-to-point sends/receives in which every process has a different role (root, intermediary and leaves). Known examples of stand-alone libraries using PMPI are DUMPI [9] and mpiP [14].
Score-P [12] is another tool for analyzing and monitoring MPI programs. This tool is based on different but partially redundant analyzers that have been gathered within a single tool to allow both online and offline analysis. Score-P relies on MPI wrappers and call-path profiles for online monitoring. Neverthe-less, the application monitoring support offered by these tools is kept outside of the library, limiting the access to the implementation details and the communi-cation pattern of collective operations once decomposed.
PERUSE [11] took a different approach by allowing the application to regis-ter callbacks that will be raised at critical moments in the point-to-point request lifetime, providing an opportunity to gather information on state-changes inside the MPI library and therefore gaining a very low-level insight on what data (not
only point-to-point but also collectives), how and when is exchanged between processes. This technique has been used in [4, 11]. Despite their interesting outcome the PERUSE interface failed to gain traction in the community.
We see that there does not exist tools that provide a monitoring that is both light and precise (e.g. showing collective communication decomposition).
3
Background
The Open MPI Project [7] is a comprehensive implementation of the MPI 3.1 standard [6] that was started in 2003, taking ideas from four earlier institutionally-based MPI implementations. It is developed and maintained by a consortium of academic, laboratory, and industry partners, and distributed under a modi-fied BSD open source license. It supports a wide variety of CPU and network architectures that is used in the HPC systems. It is also the base for a num-ber of vendors commercial MPI offerings, including Mellanox, Cisco, Fujitsu, Bull, and IBM. The Open MPI software is built on the Modular Component Architecture (MCA) [1], which allows for compile or runtime selection of the components used by the MPI library. This modularity enables experiments with new designs, algorithms, and ideas to be explored, while fully maintaining functionality and performance. In the context of this study, we take advantage of this functionality to seamlessly interpose our profiling components along with the highly optimized components provided by the stock Open MPI version.
MPI Tool, is an interface that has been added in the MPI-3 standard [6]. This interface allows the application to configure internal parameters of the MPI library, and also get access to internal information from the MPI library. In our context, this interface will offer a convenient and flexible way to access the monitored data stored by the implementation as well as control the monitoring phases.
Process placement is an optimization strategy that takes into account the affinity of processes (represented by a communication matrix) and the machine topology to decrease the communication costs of an application [8]. Various algorithms to compute such a process placement exist, one being TreeMatch [10] (designed by a subset of the authors of this article). We can distinguish between static process placement which is computed from traces of previous runs, and dynamic placement computed during the application execution (See experiments in Section 6).
4
Design
The monitoring generates the application communication pattern matrix. The order of the matrix is the number of processes and each (i, j) entry gives the amount of communication between process i and process j. It outputs sev-eral values and hence sevsev-eral matrices: the number of bytes and the number of
messages exchanged. Moreover it distinguishes between point-to-point commu-nications and collective or internal protocol commucommu-nications.
It is also able to monitor collective operations once decomposed into point-to-point communications. Therefore, it requires to intercept the communication inside the MPI library itself, instead of relinking weak symbols to a third-party dynamic one, which allows this component to be used in parallel with other profiling tools (e.g. PMPI).
For scalability reasons, we can automatically gather the monitoring data into one file instead of dumping one file per rank.
To sum up, we aim at covering a wide spectrum of needs, with different levels of complexity for various levels of precision. It provides an API for each appli-cation to enable, disable or access its own monitoring information. Otherwise, it is possible to monitor an application without any modification of its source code by activating the monitoring components at launch time and to retrieve results when the application completes. We also supply a set of mechanisms to combine monitored data into communication matrices. They can be used either at the end of the application (when MPI_Finalize is called), or post-mortem. For each pair of processes, an histogram of geometrically increasing message sizes is available.
5
Implementation
The precision needed for the results had us to implement the solution within the Open MPI stack1. The component described in this article has been developed in a branch of Open MPI (available at [13]) that will soon be made available on the stock version. As we were planning to intercept all types of commu-nications, two-sided, one-sided and collectives, we have exposed a minimalistic common API for the profiling as an independent engine, and then linked all the MCA components doing the profiling with this engine. Due to the flexibility of the MCA infrastructure, the active components can be configured at runtime, either via mpiexec arguments or via the API (implemented with the MPI Tool interface).
In order to cover the wide range of operations provided by MPI, four com-ponents were added to the software stack. One in the collective communication layer (COLL), one in the one-sided layer (remote memory accesses , OSC), one in the point-to-point management layer (PML), and finally one common layer capable of orchestrating the information gathered by the other layers and record data. This set of components when activated at launch time (through the mpiexec option --mca pml_monitoring_enable x ), monitors all speci-fied types of communications, as indicated by the value of x. The design of Open MPI allows for easy distinctions between different types of communica-tion tags, and x allows the user to include or exclude tags related to collective communications, or to other internal coordination (these are called internal tags in opposition to external tags that are available to the user via the MPI API).
Specifically, the PML layer sees communications once collectives have been decomposed into point-to-point operations. COLL and OSC both work at a higher level, in order to be able to record operations that do not go through the PML layer, for instance when using dedicated drivers. Therefore, as opposed to the MPI standard profiling interface (PMPI) approach where the MPI calls are intercepted, we monitor the actual point-to-point calls that are issued by Open MPI, which yields much more precise information. For instance, we can infer the underlying topologies and algorithms behind the collective algorithms, as an example the tree topology used for aggregating values in a MPI_Reduce call. However, this comes at the cost of a possible redundant recording of data for collective operations, when the data-path goes through the COLL and the PML components2.
For an application to enable, disable or access its own monitoring, we imple-mented a set of callback functions using MPI Tool. At any time, it is possible to know the amount of data exchanged between a pair of processes since the beginning of the application or just in a specific part of the code. Furthermore, the final summary dumped at the end of the application gives a detailed output of the data exchanged between processes for each point-to-point, one-sided and collective operation. The user is then able to refine the results.
Internally, these components use an internal process identifier (ids) and a single associative array employed to translate sender and receiver ids into their MPI_COMM_WORLD counterparts. Our mechanism is therefore oblivious to communicator splitting, merging or duplication. When a message is sent, the sender updates three arrays: the number of messages, the size (in bytes) sent to the specific receiver, and the message size distribution. Moreover, to distinguish between external and internal tags, one-sided emitted and received messages, and collective operations, we maintain five versions of the first two arrays. Also, the histogram of message sizes distribution is kept for each pair of ids, and goes from 0 byte messages to messages of more than 264bytes. Therefore, the memory
overhead of this component is at maximum 10 arrays of N 64 bits elements, in addition to the N arrays of 66 elements of 64 bits for the histograms, with N being the number of MPI processes. These arrays are lazily allocated, so they only exist for a remote process if there are communications with it.
In addition to the amount of data and the number of messages exchanged between processes, we keep track of the type of collective operations issued on each communicator: one-to-all operations (e.g MPI_Scatter), all-to-one opera-tions (e.g MPI_Gather) and all-to-all operaopera-tions (e.g MPI_Alltoall). For the first two types of operations, the root process records the total amount of data sent and received, respectively, and the count of operations of each kind. For all-to-all operations, each process records the total amount of data sent, and the count of operations. All these pieces of data can be flushed into files either at the end of the application or when requested through the API.
6
Results
We carried out the experiments on an Infiniband cluster (HCA: Mellanox Tech-nologies MT26428 (ConnectX IB QDR)). Each node features two Intel Xeon Nehalem X5550 CPUs with 4 cores (2.66 GHz) per each CPU.
6.1
Overhead Measurement
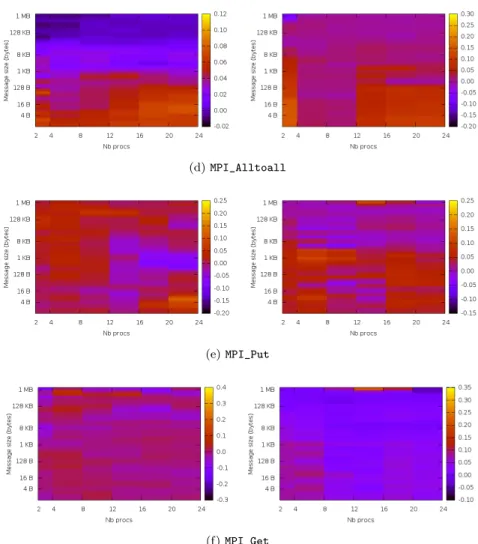
One of the main issues of monitoring is the potential impact on the application time-to-solution. As our monitoring can be dynamically enabled and disabled, we can compute the upper bound of the overhead by measuring the impact with the monitoring enabled on the entire application. We wrote a micro benchmark that computes the overhead induced by our component for various kinds of MPI functions, and measured this overhead for both shared- and distributed-memory cases. The number of processes varies from 2 to 24 and the amount of data ranges from 0 up to 1MB. Fig. 1 displays the results as heatmaps (the median of thousand measures). Blue nuances correspond to low overhead while yellow colors to higher overhead. As expected the overhead is more visible on a shared memory setting, where the cost of the monitoring is more significant compared with the decreasing cost of data transfers. Also, as the overhead is related to the number of messages and not to their content, the overhead decreases as the size of the messages increases. Overall, the median overhead is 4.4% and 2.4% for respectively the shared- and distributed-memory cases, which proves that our monitoring is cost effective.
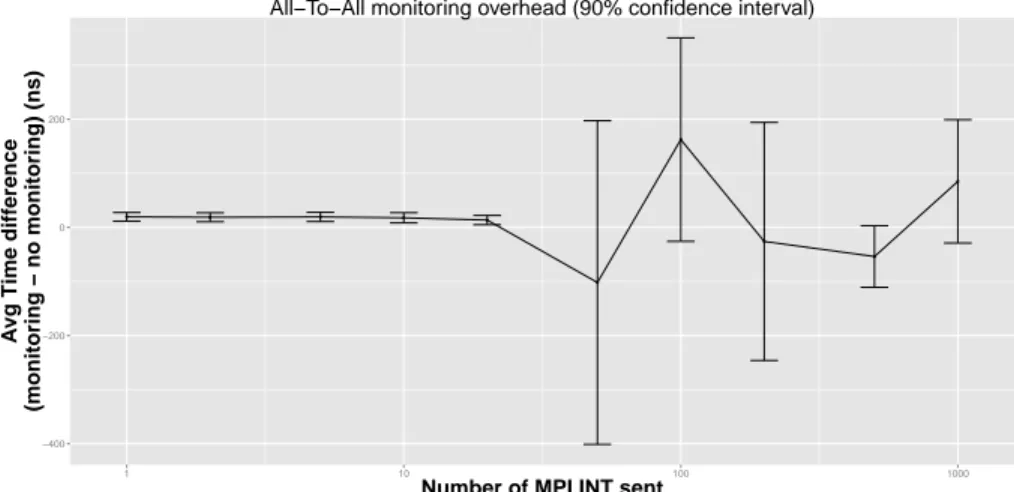
We have also build a second micro benchmarks that performs a series of all-to-all only (with no computation) of a given buffer size. In Fig. 2, we outline the average difference between monitoring and non monitoring time when the exchanged buffer size varies and once we have normalize to one all-to-all call and to one processes. We also plot, as error bars, the 95% confidence interval computed with the Student paired T-Test.
We see that when the buffer size is small (less than 50 integers), the mon-itoring time is statistically longer than the non-monmon-itoring time. On average monitoring one all-to-all call to one processes takes around 10ns. However, when the buffer size increases the error bars cover both negative and positive values meaning that, statistically, there is no difference between the monitoring time and the non-monitoring time. This is explained as follows : when the buffer size increases, the execution time increases while the monitoring time stays constant (we have the same number of messages). Therefore, the whole execution time is less stable (due to noise in the network traffic and software stack) and hence the difference between the monitoring case and the non-monitoring case becomes less visible and is hidden by this noise.
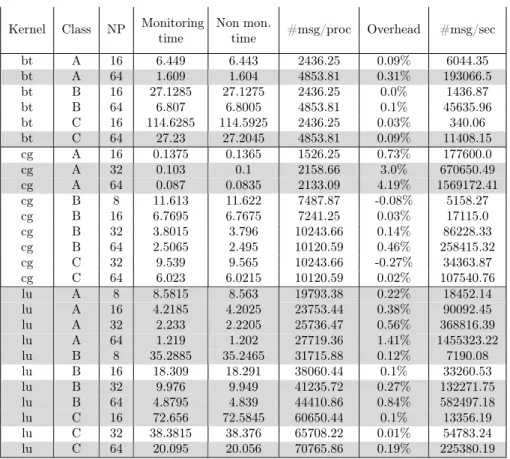
In order to measure the impact on applications, we used some of the NAS parallel benchmarks, namely BT, CG and LU. The choice of these tests is not innocent, we picked the ones with the highest number of MPI calls, in order to maximize the potential impact of the monitoring on the application. Table 1 shows the results, which are an average of 20 runs. Shaded rows mean that
(a) MPI_Send
(b) MPI_Send (prog. overhead)
(c) MPI_Bcast
Figure 1: Monitoring overhead for MPI_Send, MPI_Bcast, MPI_Alltoall, MPI_Put and MPI_Get operations. Left: distributed memory, right: shared memory.
the measures display a statistically significant difference (using the Student’s t-Teston the measures) between a monitored run and non-monitored one.
Only BT, CG and LU kernels have been evaluated as they are the ones issuing the largest number of messages per processors. They are therefore the ones for which the monitoring overhead should be most visible.
Overall, we see that the overhead is consistently below 1% and on average around 0.35%. Interestingly, for the LU kernel, the overhead seems lightly correlated with the message rate meaning that the larger the communication activity, the higher the overhead. For the CG kernel, however, the timings are
(d) MPI_Alltoall
(e) MPI_Put
(f) MPI_Get
Figure 1: Monitoring overhead for MPI_Send, MPI_Alltoall and MPI_Put op-erations. Left: distributed memory, right: shared memory. (cont.)
● ● ● ● ● ● ● ● ● ● −400 −200 0 200 1 10 100 1000
Number of MPI INT sent
A
vg Time diff
erence
(monitoring − no monitoring) (ns)
All−To−All monitoring overhead (90% confidence interval)
Figure 2: Mircobenchmark experiments.
so small that it is hard to see any influence of this factor beyond measurements noise.
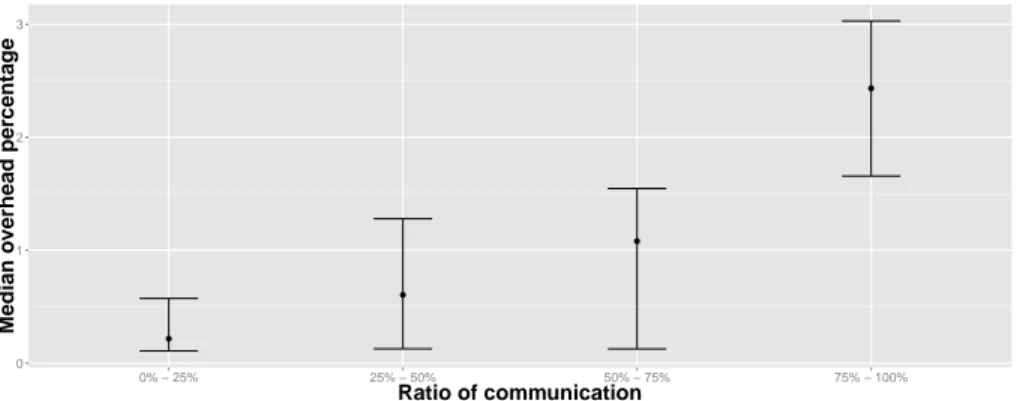
We have also tested the Minighost mini-application [2] that computes a stencil in various dimensions to evaluate the overhead. An interesting feature of this mini-application is that it outputs the percentage of time spent to perform communication. In Fig. 3, we depict the overhead depending on this communi-cation ratio. We have run 114 different executions of the Minighost applicommuni-cation and have split these runs in four categories depending on the percentage of time spent in communications (0%-25%, 25%-50%, 50%-75% and 75%-100%). A point represents the median overhead (in percent) and the error bars represent the first and third quantile. We see that the median overhead is increasing with the percentage of communication. Indeed, the more time you spend in commu-nication the more visible is the overhead for monitoring these commucommu-nications. However, the overhead accounts for only a small percentage.
6.2
MPI Collective Operations Optimization
In these experiments we have executed a MPI_Reduce collective call on 32 and 64 ranks (on 4 and 8 nodes respectively), with a buffer which size ranges between 1.106 and 2.108 integers and rank 0 acts as the root. We took advantage of
the Open MPI infrastructure, to block the dynamic selection of the collective algorithm and instead forced the reduce operation to use a binary tree algorithm. Since we monitor the collective communications once they have been broken down into point-to-point communications, we are able to identify details of the collective algorithm implementation, and expose the underlying binary tree algorithm (see Fig. 4b). This provides a much more detailed understanding of the underlying communication pattern compared with existing tools, where the use of a higher-level monitoring tool (e.g. PMPI) completely hides the
Kernel Class NP Monitoringtime Non mon.time #msg/proc Overhead #msg/sec bt A 16 6.449 6.443 2436.25 0.09% 6044.35 bt A 64 1.609 1.604 4853.81 0.31% 193066.5 bt B 16 27.1285 27.1275 2436.25 0.0% 1436.87 bt B 64 6.807 6.8005 4853.81 0.1% 45635.96 bt C 16 114.6285 114.5925 2436.25 0.03% 340.06 bt C 64 27.23 27.2045 4853.81 0.09% 11408.15 cg A 16 0.1375 0.1365 1526.25 0.73% 177600.0 cg A 32 0.103 0.1 2158.66 3.0% 670650.49 cg A 64 0.087 0.0835 2133.09 4.19% 1569172.41 cg B 8 11.613 11.622 7487.87 -0.08% 5158.27 cg B 16 6.7695 6.7675 7241.25 0.03% 17115.0 cg B 32 3.8015 3.796 10243.66 0.14% 86228.33 cg B 64 2.5065 2.495 10120.59 0.46% 258415.32 cg C 32 9.539 9.565 10243.66 -0.27% 34363.87 cg C 64 6.023 6.0215 10120.59 0.02% 107540.76 lu A 8 8.5815 8.563 19793.38 0.22% 18452.14 lu A 16 4.2185 4.2025 23753.44 0.38% 90092.45 lu A 32 2.233 2.2205 25736.47 0.56% 368816.39 lu A 64 1.219 1.202 27719.36 1.41% 1455323.22 lu B 8 35.2885 35.2465 31715.88 0.12% 7190.08 lu B 16 18.309 18.291 38060.44 0.1% 33260.53 lu B 32 9.976 9.949 41235.72 0.27% 132271.75 lu B 64 4.8795 4.839 44410.86 0.84% 582497.18 lu C 16 72.656 72.5845 60650.44 0.1% 13356.19 lu C 32 38.3815 38.376 65708.22 0.01% 54783.24 lu C 64 20.095 20.056 70765.86 0.19% 225380.19
Table 1: Overhead for the BT, CG and LU NAS kernels
collective algorithm communications. With this pattern, we have computed a new process placement with the TreeMatch algorithm, and compared with the placement obtained using a high-level monitoring (that does not see the tree and hence is equivalent to the round-robin placement). Results are shown in Fig. 4a. We see that the optimized placement is much more efficient than the one based on high-level monitoring. For instance with 64 ranks and a buffer of 5.106integers the walltime is 338 ms vs. 470 ms (39% faster).
6.3
Use Case: Fault Tolerance with Online Monitoring
In addition to the usage scenarios mentioned above, the proposed dynamic mon-itoring tool has been demonstrated in one of our recent work. In [5], we have used the dynamic monitoring feature to compute the communication matrix during the execution of an MPI application. The goal was to perform elastic computations in case of node failures or when new nodes are available. The run-time system migrates MPI processes when the number of computing resources changes. To this end, the authors used the TreeMatch [10] algorithm to
recom-● ● ● ● 0 1 2 3 0% − 25% 25% − 50% 50% − 75% 75% − 100% Ratio of communication Median o verhead per centa g e
Figure 3: Minighost application overhead in function of the communication percentage of the total execution time.
10 100 1000 10000 15000 10 100 1000 10000 15000 NP = 32 NP = 64 1000 2000 5000 10000 20000 50000 1e+05 2e+05
Buffer size (1000 int)
Median Time (ms)
High−level monitoring PML Monitoring
MPI_Reduce time at root after process placement
(a) MPI_Reduce (MPI_MAX) walltime (x and y log-scale) for 32 and 64 ranks and various buffer sizes. Process place-ment based on our PML monitoring vs. high-level monitor-ing (RR placement) 10 20 30 40 50 60 10 20 30 40 50 60 MPI_Reduce Pattern, NP= 64 Sender rank Receiv er r ank (b) Communication pattern as seen by our monitoring tool (once the collective communica-tion is decomposed into point-to-point communications).
Figure 4: MPI_Reduce Optimization
pute the process mapping onto the available resources. The algorithm decides how to move processes based on the application’s gathered communication ma-trix: the more two processes communicate, the closer they shall be re-mapped onto the physical resources. Gathering the communication matrix was per-formed online using the callback routines of the monitoring: such a result would not have been possible without the tool proposed in this report.
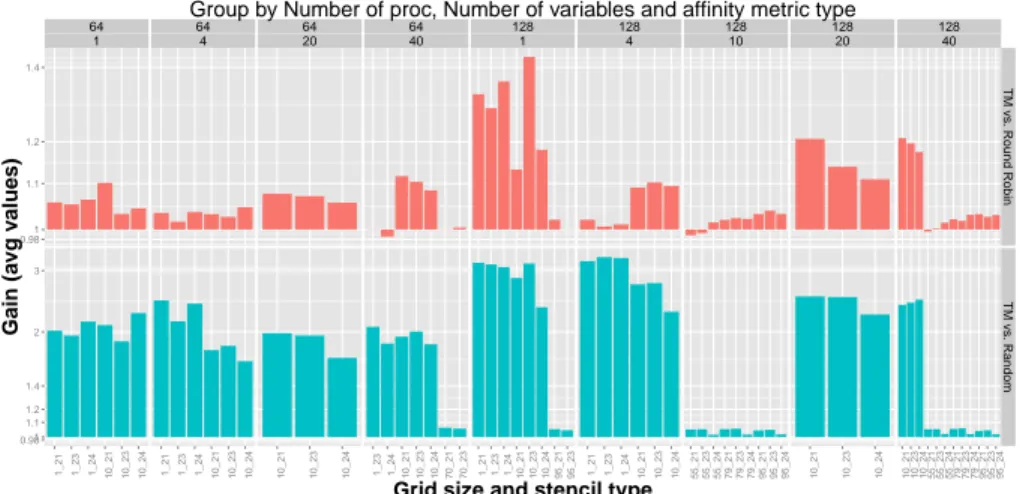
64 1 64 4 64 20 64 40 128 1 128 4 128 10 128 20 128 40 0.981 1.1 1.2 1.4 0.981 1.1 1.2 1.4 2 3 TM vs . Round Robin TM vs . Random 1_21 1_23 1_24 10_21 10_23 10_24 1_21 1_23 1_24 10_21 10_23 10_24 10_21 10_23 10_24 1_23 1_24 10_21 10_23 10_24 70_21 70_23 1_21 1_23 1_24 10_21 10_23 10_24 95_21 95_23 1_21 1_23 1_24 10_21 10_23 10_24 55_2155_23 55_24 79_2179_23 79_24 95_2195_23 95_24 10_21 10_23 10_24 10_21 10_23 10_24 55_21 55_23 55_24 79_21 79_23 79_24 95_21 95_23 95_24 Grid size and stencil type
Gain (a
vg v
alues)
Group by Number of proc, Number of variables and affinity metric type
Figure 5: Average gain of TreeMatch placement vs. Round Robin and random placements for various Minighost runs
6.4
Static Process Placement of applications
We have tested the TreeMatch algorithm for performing static placement to show that the monitoring provides relevant information allowing execution op-timization. To do so, we first monitor the application using the proposed moni-toring tool of this report, second we build the communication matrix (here using the number of messages) then we apply the TreeMatch algorithm on this matrix and the topology of the target architecture and last we re-execute the applica-tion using the newly computed mapping. Different settings (kind of stencil, the stencil dimension, number of variables per stencil point, and number of pro-cesses) are shown in fig. 5. We see that the gain is up to 40% when compared to round-robin placement (the standard MPI placement) and 300% against random placement. The decrease of performance is never greater than 2%.
7
Scientific Conclusions
Parallel applications tend to use a growing number of computational resources connected via complex communication schemes that naturally diverge from the underlying network topology. Optimizing application’s performance requires to identify any mismatch between the application communication pattern and the network topology, and this demands a precise mapping of all data exchanges between the application processes.
In this report we proposed a new monitoring framework to consistently track all types of data exchanges in MPI applications. We have implemented the tool as a set of modular components in Open MPI, allowing fast and flexible low level monitoring (with collective operation decomposed to their point-to-point expression) of all types of communications supported by the MPI-3 standard
(including one-sided communications and IO). We have also provided an API based on the MPI Tool standard, for applications to monitor their state dynam-ically, focusing the monitoring to only critical portions of the code. The basic usage of this tool does not require any change in the application, nor any special compilation flag. The data gathered can be provided at different granularities, either as communication matrices, or as histograms of message sizes. Another significant feature of this tool is that it leaves the PMPI interface available for other usages, allowing additional monitoring of the application using more traditional tools.
Micro-benchmarks show that the overhead is minimal for intra-node com-munications (over shared memory) and barely noticeable for large messages or distributed memory. Once applied to real applications, the overhead remains hardly visible (at most a few percents). Having such a precise and flexible mon-itoring tool opens the door to dynamic process placement strategies, and could lead to highly efficient process placement strategies. Experiments show that this tool enables large gain for dynamic or static cases. The fact that the monitoring records the communication after collective decomposition into point-to-points allows optimizations that were not otherwise possible.
8
User Documentation
This section details how the component is to be used. This documentation presents the concepts on which we based our component’s API, and the different options available. It first explains how to use the component, then summarize it in a quick start tutorial.
8.1
Introduction
MPI_Tool is a concept introduced in the MPI-3 standard. It allows MPI devel-opers, or third party, to offer a portable interface to different tools. These tools may be used to monitor application, measure its performances, or profile it. MPI_Tool is an interface that ease the addition of external functions to a MPI library. It also allows the user to control and monitor given internal variables of the runtime system.
The present section is here to introduce the use the MPI_Tool interface from a user point of view, and to facilitate the usage of the Open MPI moni-toring component. This component allows for precisely recording the message exchanges between nodes during MPI applications execution. The number of messages and the amount of data exchanged are recorded, including or exclud-ing internal communications (such as those generated by the implementation of the collective algorithms).
This component offers two types of monitoring, whether the user wants a fine control over the monitoring, or just an overall view of the messages. Moreover, the fine control allows the user to access the results through the application, and let him reset the variables when needed. The fine control is achieved via the
MPI_Tool interface, which needs the code to be adapted by adding a specific initialization function. However, the basic overall monitoring is achieved without any modification of the application code.
Whether you are using one version or the other, the monitoring need to be enabled with parameters added when calling mpiexec, or globally on your Open MPI MCA configuration file ($HOME/.openmpi/mca-params.conf). Three new parameters have been introduced:
--mca pml_monitoring_enable value This parameter sets the monitoring mode. value may be:
0 monitoring is disabled
1 monitoring is enabled, with no distinction between user issued and li-brary issued messages.
≥ 2 monitoring enabled, with a distinction between messages issued from the library (internal) and messages issued from the user (external). --mca pml_monitoring_enable_output value This parameter enables the
au-tomatic flushing of monitored values during the call to MPI_Finalize. This option is to be used only without MPI_Tool, or with value = 0. value may be:
0 final output flushing is disable
1 final output flushing is done in the standard output stream (stdout) 2 final output flushing is done in the error output stream (stderr) ≥ 3 final output flushing is done in the file which name is given with the
pml_monitoring_filename parameter.
Each MPI process flushes its recorded data. The pieces of information can be aggregated whether with the use of PMPI (see Section 8.4) or with the distributed script test/monitoring/profile2mat.pl.
--mca pml_monitoring_filename filename Set the file where to flush the re-sulting output from monitoring. The output is a communication matrix of both the number of messages and the total size of exchanged data be-tween each couple of nodes. This parameter is needed if pml_monitoring _enable_output ≥ 3.
Also, in order to run an application without some monitoring enabled, you need to add the following parameters at mpiexec time:
--mca pml ˆmonitoring This parameter disable the monitoring component of the PML framework
--mca osc ˆmonitoring This parameter disable the monitoring component of the OSC framework
--mca coll ˆmonitoring This parameter disable the monitoring component of the COLL framework
8.2
Without MPI_Tool
This mode should be used to monitor the whole application from its start until its end. It is defined such as you can record the amount of communications without any code modification.
In order to do so, you have to get Open MPI compiled with monitoring enabled. When you launch your application, you need to set the parameter pml _monitoring_enableto a value > 0, and, if pml_monitoring_enable_output ≥ 3, to set the pml_monitoring_filename parameter to a proper filename, which path must exists.
8.3
With MPI_Tool
This section explains how to monitor your applications with the use of MPI_Tool. 8.3.1 How it works
MPI_Tool is a layer that is added to the standard MPI implementation. As such, it must be noted first that it may have an impact to the performances.
As these functionality are orthogonal to the core ones, MPI_Tool initializa-tion and finalizainitializa-tion are independent from MPI’s one. There is no restricinitializa-tion regarding the order or the different calls. Also, the MPI_Tool interface initial-ization function can be called more than once within the execution, as long as the finalize function is called as many times.
MPI_Tool introduces two types of variables, control variables and perfor-mance variables. These variables will be referred to respectively as cvar and pvar. The variables can be used to tune dynamically the application to fit best the needs of the application. They are defined by the library (or by the external component), and accessed with the given accessors functions, specified in the standard. The variables are named uniquely through the application. Every variable, once defined and registered within the MPI engine, is given an index that will not change during the entire execution.
Same as for the monitoring without MPI_Tool, you need to start your ap-plication with the control variable pml_monitoring_enable properly set. Even though, it is not required, you can also add for your command line the desired filename to flush the monitoring output. As long as no filename is provided, no output can be generated.
8.3.2 Initialization
The initialization is made by a call to MPI_T_init_thread. This function takes two parameters. The first one is the desired level of thread support, the second one is the provided level of thread support. It has the same semantic as the MPI _Init_threadfunction. Please note that the first function to be called (between MPI_T_init_thread and MPI_Init_thread) may influence the second one for the provided level of thread support. This function goal is to initialize control and performance variables.
But, in order to use the performance variables within one context without influencing the one from an other context, a variable has to be bound to a session. To create a session, you have to call MPI_T_pvar_session_create in order to initialize a session.
In addition to the binding of a session, a performance variable may also depend on a MPI object. For example, the pml_monitoring_flush variable needs to be bound to a communicator. In order to do so, you need to use the MPI_T_pvar_handle_alloc function, which takes as parameters the used session, the id of the variable, the MPI object (i.e. MPI_COMM_WORLD in the case of pml_monitoring_flush), the reference to the performance variable handle and a reference to an integer value. The last parameter allow the user to receive some additional information about the variable, or the MPI object bound. As an example, when binding to the pml_monitoring_flush performance variable, the last parameter is set to the length of the current filename used for the flush, if any, and 0 otherwise ; when binding to the pml_monitoring_messages _count performance variable, the parameter is set to the size of the size of bound communicator, as it corresponds to the expected size of the array (in number of elements) when retrieving the data. This parameter is used to let the application determines the amount of data to be returned when reading the performance variables. Please note that the handle_alloc function takes the variable id as parameter. In order to retrieve this value, you have to call MPI _T_pvar_get_index which take as a IN parameter a string that contains the name of the desired variable.
8.3.3 How to use the performance variables
Some performance variables are defined in the monitoring component:
pml_monitoring_flush Allow the user to define a file where to flush the recorded data.
pml_monitoring_messages_count Allow the user to access within the ap-plication the number of messages exchanged through the PML framework with each node from the bound communicator (MPI_Comm). This vari-able returns an array of number of nodes unsigned long integers.
pml_monitoring_messages_size Allow the user to access within the ap-plication the amount of data exchanged through the PML framework with each node from the bound communicator (MPI_Comm). This variable returns an array of number of nodes unsigned long integers.
osc_monitoring_messages_sent_count Allow the user to access within the application the number of messages sent through the OSC framework with each node from the bound communicator (MPI_Comm). This vari-able returns an array of number of nodes unsigned long integers.
osc_monitoring_messages_sent_size Allow the user to access within the application the amount of data sent through the OSC framework with each
node from the bound communicator (MPI_Comm). This variable returns an array of number of nodes unsigned long integers.
osc_monitoring_messages_recv_count Allow the user to access within the application the number of messages received through the OSC frame-work with each node from the bound communicator (MPI_Comm). This variable returns an array of number of nodes unsigned long integers. osc_monitoring_messages_recv_size Allow the user to access within the
application the amount of data received through the OSC framework with each node from the bound communicator (MPI_Comm). This variable returns an array of number of nodes unsigned long integers.
coll_monitoring_messages_count Allow the user to access within the ap-plication the number of messages exchanged through the COLL framework with each node from the bound communicator (MPI_Comm). This vari-able returns an array of number of nodes unsigned long integers.
coll_monitoring_messages_size Allow the user to access within the appli-cation the amount of data exchanged through the COLL framework with each node from the bound communicator (MPI_Comm). This variable returns an array of number of nodes unsigned long integers.
coll_monitoring_o2a_count Allow the user to access within the applica-tion the number of one-to-all collective operaapplica-tions across the bound com-municator (MPI_Comm) where the process was defined as root. This variable returns a single unsigned long integer.
coll_monitoring_o2a_size Allow the user to access within the application the amount of data sent as one-to-all collective operations across the bound communicator (MPI_Comm). This variable returns a single unsigned long integers. The communications between a process and itself are not taken in account
coll_monitoring_a2o_count Allow the user to access within the applica-tion the number of all-to-one collective operaapplica-tions across the bound com-municator (MPI_Comm) where the process was defined as root. This variable returns a single unsigned long integer.
coll_monitoring_a2o_size Allow the user to access within the application the amount of data received from all-to-one collective operations across the bound communicator (MPI_Comm). This variable returns a single unsigned long integers. The communications between a process and itself are not taken in account
coll_monitoring_a2a_count Allow the user to access within the applica-tion the number of all-to-all collective operaapplica-tions across the bound com-municator (MPI_Comm). This variable returns a single unsigned long integer.
coll_monitoring_a2a_size Allow the user to access within the application the amount of data sent as all-to-all collective operations across the bound communicator (MPI_Comm). This variable returns a single unsigned long integers. The communications between a process and itself are not taken in account
In case of uncertainty about how a collective in categorized as, please refer to the list given in Table 2.
Once bound to a session and to the proper MPI object, these variables may be accessed through a set of given functions. It must be noted here that each of the functions applied to the different variables need, in fact, to be called with the handle of the variable.
The first variable may be modified by using the MPI_T_pvar_write function. The later variables may be read using MPI_T_pvar_read but cannot be written. Stopping the flush performance variable, with a call to MPI_T_pvar_stop, force the counters to be flushed into the given file, reseting to 0 the counters at the same time. Also, binding a new handle to the flush variable will reset the counters. Finally, please note that the size and counter performance variables may overflow for multiple large amounts of communications.
The monitoring will start on the call to the MPI_T_pvar_start until the moment you call the MPI_T_pvar_stop function.
Once you are done with the different monitoring, you can clean everything by calling the function MPI_T_pvar_handle_free to free the allocated handles, MPI_T_pvar_session_free to free the session, and MPI_T_Finalize to state the end of your use of performance and control variables.
8.3.4 Overview of the calls
To summarize the previous informations, here is the list of available performance variables, and the outline of the different calls to be used to properly access monitored data through the MPI_Tool interface.
• pml_monitoring_flush • pml_monitoring_messages_count • pml_monitoring_messages_size • osc_monitoring_messages_sent_count • osc_monitoring_messages_sent_size • osc_monitoring_messages_recv_count • osc_monitoring_messages_recv_size • coll_monitoring_messages_count • coll_monitoring_messages_size
One-To-All All-To-One All-To-All MPI_Bcast MPI_Gather MPI_Allgather MPI_Ibcast MPI_Gatherv MPI_Allgatherv MPI_Iscatter MPI_Igather MPI_Allreduce MPI_Iscatterv MPI_Igatherv MPI_Alltoall MPI_Scatter MPI_Ireduce MPI_Alltoallv MPI_Scatterv MPI_Reduce MPI_Alltoallw
MPI_Barrier MPI_Exscan MPI_Iallgather MPI_Iallgatherv MPI_Iallreduce MPI_Ialltoall MPI_Ialltoallv MPI_Ialltoallw MPI_Ibarrier MPI_Iexscan MPI_Ineighbor_allgather MPI_Ineighbor_allgatherv MPI_Ineighbor_alltoall MPI_Ineighbor_alltoallv MPI_Ineighbor_alltoallw MPI_Ireduce_scatter MPI_Ireduce_scatter_block MPI_Iscan MPI_Neighbor_allgather MPI_Neighbor_allgatherv MPI_Neighbor_alltoall MPI_Neighbor_alltoallv MPI_Neighbor_alltoallw MPI_Reduce_scatter MPI_Reduce_scatter_block MPI_Scan
• coll_monitoring_o2a_count • coll_monitoring_o2a_size • coll_monitoring_a2o_count • coll_monitoring_a2o_size • coll_monitoring_a2a_count • coll_monitoring_a2a_size
Add to your command line at least --mca pml_monitoring_enable [1,2] Sequence of MPI_Tool:
1. MPI_T_init_thread Initialize the MPI_Tools interface 2. MPI_T_pvar_get_index To retrieve the variable id
3. MPI_T_session_create To create a new context in which you use your variable
4. MPI_T_handle_alloc To bind your variable to the proper session and MPI object
5. MPI_T_pvar_start To start the monitoring
6. Now you do all the communications you want to monitor 7. MPI_T_pvar_stop To stop and flush the monitoring 8. MPI_T_pvar_handle_free
9. MPI_T_pvar_session_free 10. MPI_T_finalize
8.4
Use of LD_PRELOAD
In order to automatically generate communication matrices, you can use the monitoring_proftool that can be found in test/monitoring/monitoring_prof.c. While launching your application, you can add the following option in addition to the --mca pml_monitoring_enable parameter:
-x LD_PRELOAD=ompi_install_dir/lib/monitoring_prof.so
This library automatically gathers sent and received data into one communi-cation matrix. Although, the use of monitoring MPI_Tool within the code may interfere with this library. The main goal of this library is to avoir dumping one file per MPI process, and gather everything in one file aggregating all pieces of information.
The resulting communication matrices are as close as possible as the effec-tive amount of data exchanged between nodes. But it has to be kept in mind
that because of the stack of the logical layers in Open MPI, the amount of data recorded as part of collectives or one-sided operations may be duplicated when the PML layer handles the communication. For an exact measure of communi-cations, the application must use MPI_Tool’s monitoring performance variables to potentially subtract double-recorded data.
8.5
Examples
First is presented an example of monitoring using the MPI_Tool in order to de-fine phases during which the monitoring component is active. A second snippet is presented for how to access monitoring performance variables with MPI_Tool. 8.5.1 Monitoring Phases
You can execute the following example with
mpiexec -n 4 --mca pml_monitoring_enable 2 test_monitoring. Please note that you need the prof directory to already exists to retrieve the dumped files. Following the complete code example, you will find a sample dumped file and the corresponding explanations.
test_monitoring.c (extract) #include <stdlib.h>
#include <stdio.h> #include <mpi.h>
static const void* nullbuff = NULL; static MPI_T_pvar_handle flush_handle;
static const char flush_pvar_name[] = "pml_monitoring_flush"; static const char flush_cvar_name[] = "pml_monitoring_enable"; static int flush_pvar_idx;
int main(int argc, char* argv[]) {
int rank, size, n, to, from, tagno; int MPIT_result, provided, count; MPI_T_pvar_session session; MPI_Status status; MPI_Comm newcomm; MPI_Request request; char filename[1024]; /* Initialization of parameters */ n = -1; MPI_Init(&argc, &argv);
MPI_Comm_rank(MPI_COMM_WORLD, &rank); MPI_Comm_size(MPI_COMM_WORLD, &size); to = (rank + 1) % size;
from = (rank + size - 1) % size; tagno = 201;
/* Initialization of performance variables */
MPIT_result = MPI_T_init_thread(MPI_THREAD_SINGLE, &provided); if (MPIT_result != MPI_SUCCESS) MPI_Abort(MPI_COMM_WORLD, MPIT_result); MPIT_result = MPI_T_pvar_get_index(flush_pvar_name, MPI_T_PVAR_CLASS_GENERIC, &flush_pvar_idx); if (MPIT_result != MPI_SUCCESS) {
printf("cannot find monitoring MPI_T \"%s\" pvar, " "check that you have monitoring pml\n", flush_pvar_name);
MPI_Abort(MPI_COMM_WORLD, MPIT_result); }
MPIT_result = MPI_T_pvar_session_create(&session); if (MPIT_result != MPI_SUCCESS) {
printf("cannot create a session for \"%s\" pvar\n", flush_pvar_name);
MPI_Abort(MPI_COMM_WORLD, MPIT_result); }
/*
* Allocating a new PVAR in a session will reset the counters */
MPIT_result = MPI_T_pvar_handle_alloc(session, flush_pvar_idx, MPI_COMM_WORLD,
&flush_handle, &count); if (MPIT_result != MPI_SUCCESS) {
printf("failed to allocate handle on \"%s\" pvar, " "check that you have monitoring pml\n", flush_pvar_name);
MPI_Abort(MPI_COMM_WORLD, MPIT_result); }
MPIT_result = MPI_T_pvar_start(session, flush_handle); if (MPIT_result != MPI_SUCCESS) {
printf("failed to start handle on \"%s\" pvar, " "check that you have monitoring pml\n", flush_pvar_name); MPI_Abort(MPI_COMM_WORLD, MPIT_result); } if (rank == 0) { n = 25; MPI_Isend(&n,1,MPI_INT,to,tagno,MPI_COMM_WORLD,&request); } while (1) { MPI_Irecv(&n,1,MPI_INT,from,tagno,MPI_COMM_WORLD,&request); MPI_Wait(&request, &status); if (rank == 0) {n--;tagno++;} MPI_Isend(&n,1,MPI_INT,to,tagno,MPI_COMM_WORLD,&request); if (rank != 0) {n--;tagno++;} if (n<0){ break; } } /*
* Build one file per processes
* Every thing that has been monitored by each
* process since the last flush will be output in filename *
* Requires directory prof to be created.
* Filename format should display the phase number * and the process rank for ease of parsing with * aggregate_profile.pl script
*/
sprintf(filename,"prof/phase_1");
if( MPI_SUCCESS != MPI_T_pvar_write(session, flush_handle, filename) )
{
fprintf(stderr,
"Process %d cannot save monitoring in %s.%d.prof\n", rank, filename, rank);
}
/* Force the writing of the monitoring data */
if (MPIT_result != MPI_SUCCESS) {
printf("failed to stop handle on \"%s\" pvar, " "check that you have monitoring pml\n", flush_pvar_name);
MPI_Abort(MPI_COMM_WORLD, MPIT_result); }
/*
* Don’t set a filename. If we stop the session before setting * it, then no output will be generated.
*/
if( MPI_SUCCESS != MPI_T_pvar_write(session, flush_handle, &nullbuff) )
{
fprintf(stderr,
"Process %d cannot save monitoring in %s\n", rank, filename); } (void)MPI_T_finalize(); MPI_Finalize(); return EXIT_SUCCESS; } prof/phase_1.0.prof # POINT TO POINT E 0 1 108 bytes 27 msgs sent 0,0,0,27,0,[...],0 # OSC # COLLECTIVES D MPI_COMM_WORLD procs: 0,1,2,3 O2A 0 0 bytes 0 msgs sent A2O 0 0 bytes 0 msgs sent A2A 0 0 bytes 0 msgs sent
As it show on the sample profiling, for each kind of communication (point-to-point, one-sided and collective), you find all the related informations. There is one line per peers communicating. Each line start with a lettre describing the kind of communication, such as follows:
E External messages, i.e. issued by the user I Internal messages, i.e. issued by the library
R Received one-sided messages, i.e. reading access to the remote memory C Collective messages
This letter is followed by the rank of the issuing process, and the rank of the receiving one. Then you have the total amount in bytes exchanged and the count of messages. For point-to-point entries (i.e. E of I entries), the line is completed by the full distribution of messages in the form of a histogram. See variable size_histogram in Section 9.1.1 for the corresponding values. In the case of a disabled filtering between external and internal messages, the I lines are merged with the E lines, keeping the E header.
The end of the summary is a per communicator information, where you find the name of the communicator, the ranks of the processes included in this communicator, and the amount of data send (or received) for each kind of collective, with the corresponding count of operations of each kind. The first integer corresponds to the rank of the process that sent or recieved through the given collective operation type.
8.5.2 Accessing Monitoring Performance Variables
The following snippet presents how to access the performances variables defined as part of the MPI_Tool interface. The session allocation is not presented as it is the same as in the previous example. Please note that contrary to the pml _monitoring_flush variable, the class of the monitoring performance values is MPI_T_PVAR_CLASS_SIZE, whereas the flush variable is of class GENERIC. Also, performances variables are only to be read.
test/monitoring/example_reduce_count.c (extract) MPI_T_pvar_handle count_handle;
int count_pvar_idx;
const char count_pvar_name[] = "pml_monitoring_messages_count"; uint64_t*counts;
/* Retrieve the proper pvar index */
MPIT_result = MPI_T_pvar_get_index(count_pvar_name, MPI_T_PVAR_CLASS_SIZE, &count_pvar_idx); if (MPIT_result != MPI_SUCCESS) {
printf("cannot find monitoring MPI_T \"%s\" pvar, check that" " you have monitoring pml\n",
count_pvar_name);
MPI_Abort(MPI_COMM_WORLD, MPIT_result); }
/* Allocating a new PVAR in a session will reset the counters */ MPIT_result = MPI_T_pvar_handle_alloc(session, count_pvar_idx,
MPI_COMM_WORLD, &count_handle, &count);
if (MPIT_result != MPI_SUCCESS) {
printf("failed to allocate handle on \"%s\" pvar, check that" " you have monitoring pml\n",
count_pvar_name);
MPI_Abort(MPI_COMM_WORLD, MPIT_result); }
counts = (uint64_t*)malloc(count * sizeof(uint64_t)); MPIT_result = MPI_T_pvar_start(session, count_handle); if (MPIT_result != MPI_SUCCESS) {
printf("failed to start handle on \"%s\" pvar, check that " "you have monitoring pml\n",
count_pvar_name);
MPI_Abort(MPI_COMM_WORLD, MPIT_result); }
/* Token Ring communications */ if (rank == 0) { n = 25; MPI_Isend(&n,1,MPI_INT,to,tagno,MPI_COMM_WORLD,&request); } while (1) { MPI_Irecv(&n,1,MPI_INT,from,tagno,MPI_COMM_WORLD,&request); MPI_Wait(&request, &status); if (rank == 0) {n--;tagno++;} MPI_Isend(&n,1,MPI_INT,to,tagno,MPI_COMM_WORLD,&request); if (rank != 0) {n--;tagno++;} if (n<0){ break; } }
MPIT_result = MPI_T_pvar_read(session, count_handle, counts); if (MPIT_result != MPI_SUCCESS) {
printf("failed to read handle on \"%s\" pvar, check that you" " have monitoring pml\n",
count_pvar_name);
MPI_Abort(MPI_COMM_WORLD, MPIT_result); }
/* Global reduce so everyone knows the maximum messages sent to each rank */
MPI_MAX, MPI_COMM_WORLD); /* OPERATIONS ON COUNTS */
...
free(counts);
MPIT_result = MPI_T_pvar_stop(session, count_handle); if (MPIT_result != MPI_SUCCESS) {
printf("failed to stop handle on \"%s\" pvar, check that you" " have monitoring pml\n",
count_pvar_name);
MPI_Abort(MPI_COMM_WORLD, MPIT_result); }
MPIT_result = MPI_T_pvar_handle_free(session, &count_handle); if (MPIT_result != MPI_SUCCESS) {
printf("failed to free handle on \"%s\" pvar, check that you" " have monitoring pml\n",
count_pvar_name);
MPI_Abort(MPI_COMM_WORLD, MPIT_result); }
9
Technical Documentation of the
Implementa-tion
This section describes the technical details of the components implementation. It is of no use from a user point of view but it is made to facilitate the work for future developer that would debug or enrich the monitoring components.
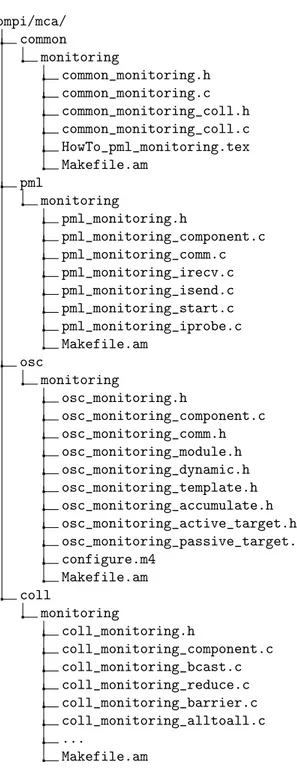
The architecture of this component is as follows. The Common component is the main part where the magic occurs. PML, OSC and COLL components are the entry points to the monitoring tool from the software stack point-of-view. The relevant files can be found in accordance with the partial directory tree presented in Figure 6.
9.1
Common
This part of the monitoring components is the place where data is managed. It centralizes all recorded information, the translation hash-table and ensures a unique initialization of the monitoring structures. This component is also the one where the MCA variables (to be set as part of the command line) are defined and where the final output, if any requested, is dealt with.
The header file defines the unique monitoring version number, different pre-processing macros for printing information using the monitoring output stream object, and the ompi monitoring API (i.e. the API to be used INSIDE the ompi
ompi/mca/ common monitoring common_monitoring.h common_monitoring.c common_monitoring_coll.h common_monitoring_coll.c HowTo_pml_monitoring.tex Makefile.am pml monitoring pml_monitoring.h pml_monitoring_component.c pml_monitoring_comm.c pml_monitoring_irecv.c pml_monitoring_isend.c pml_monitoring_start.c pml_monitoring_iprobe.c Makefile.am osc monitoring osc_monitoring.h osc_monitoring_component.c osc_monitoring_comm.h osc_monitoring_module.h osc_monitoring_dynamic.h osc_monitoring_template.h osc_monitoring_accumulate.h osc_monitoring_active_target.h osc_monitoring_passive_target.h configure.m4 Makefile.am coll monitoring coll_monitoring.h coll_monitoring_component.c coll_monitoring_bcast.c coll_monitoring_reduce.c coll_monitoring_barrier.c coll_monitoring_alltoall.c ... Makefile.am
software stack, not the one to be exposed to the end-user). It has to be noted that the mca_common_monitoring_record_* functions are to be used with the destination rank translated into the corresponding rank in MPI_COMM_WORLD. This translation is done by using mca_common_monitoring_get_world_rank. The use of this function may be limited by how the initialization occurred (see in 9.2).
9.1.1 Common monitoring
The the common_monitoring.c file defines multiples variables that has the fol-lowing use:
mca_common_monitoring_hold is the counter that keeps tracks of whether the common component has already been initialized or if it is to be released. The operations on this variable are atomic to avoid race conditions in a multi-threaded environment.
mca_common_monitoring_output_stream_obj is the structure used internally by Open MPI for output streams. The monitoring output stream states that this output is for debug, so the actual output will only happen when OPAL is configured with --enable-debug. The output is sent to stderr standard output stream. The prefix field, initialized in mca _common_monitoring_init, states that every log message emitted from this stream object will be prefixed by “[hostname:PID] monitoring: ”, where hostname is the configured name of the machine running the process and PID is the process id, with 6 digits, prefixed with zeros if needed. mca_common_monitoring_enabled is the variable retaining the original value
given to the MCA option system, as an example as part of the com-mand line. The corresponding variable is pml_monitoring_enable. This variable is not to be written by the monitoring component. It is used to reset the mca_common_monitoring_current_state variable between phases. The value given to this parameter also defines whether or not the filtering between internal and externals messages is enabled.
mca_common_monitoring_current_state is the variable used to determine the actual current state of the monitoring. This variable is the one used to define phases.
mca_common_monitoring_output_enabled is a variable, set by the MCA en-gine, that states whether or not the user requested a summary of the monitored data to be streamed out at the end of the execution. It also states whether the output should be to stdout, stderr or to a file. If a file is requested, the next two variables have to be set. The corresponding vari-able is pml_monitoring_envari-able_output. Warning: This varivari-able may be set to 0 in case the monitoring is also controlled with MPI_Tool. We cannot both control the monitoring via MPI_Tool and expect accurate answer upon MPI_Finalize.
mca_common_monitoring_initial_filename works the same as mca_common _monitoring_enabled. This variable is, and has to be, only used as a placeholder for the pml_monitoring_filename variable. This variable has to be handled very carefully as it has to live as long as the program and it has to be a valid pointer address, which content is not to be released by the component. The way MCA handles variable (especially strings) makes it very easy to create segmentation faults. But it deals with the memory release of the content. So, in the end, mca_common_monitoring _initial_filename is just to be read.
mca_common_monitoring_current_filename is the variable the monitoring com-ponent will work with. This variable is the one to be set by MPI_Tool’s control variable pml_monitoring_flush. Even though this control vari-able is prefixed with pml for historical and easy reasons, it depends on the common section for its behavior.
pml_data and pml_count arrays of unsigned 64-bits integers record respec-tively the cumulated amount of bytes sent from the current process to another process p, and the count of messages. The data in this array at the index i corresponds to the data sent to the process p, of id i in MPI _COMM_WORLD. These arrays are of size N, where N is the number of nodes in the MPI application. If the filtering is disabled, these variables gather all information regardless of the tags. In this case, the next two arrays are, obviously, not used, even though they will still be allocated. The pml_dataand pml_count arrays, and the nine next arrays described, are allocated, initialized, reset and freed all at once, and are concurrent in the memory.
filtered_pml_data and filtered_pml_count arrays of unsigned 64-bits in-tegers record respectively the cumulated amount of bytes sent from the current process to another process p, and the count of internal messages. The data in this array at the index i corresponds to the data sent to the process p, of id i in MPI_COMM_WORLD. These arrays are of size N, where N is the number of nodes in the MPI application. The internal messages are defined as messages sent through the PML layer, with a negative tag. They are issued, as an example, from the decomposition of collectives operations.
osc_data_s and osc_count_s arrays of unsigned 64-bits integers record re-spectively the cumulated amount of bytes sent from the current process to another process p, and the count of messages. The data in this array at the index i corresponds to the data sent to the process p, of id i in MPI _COMM_WORLD. These arrays are of size N, where N is the number of nodes in the MPI application.
osc_data_r and osc_count_r arrays of unsigned 64-bits integers record re-spectively the cumulated amount of bytes received to the current process to another process p, and the count of messages. The data in this array
at the index i corresponds to the data sent to the process p, of id i in MPI _COMM_WORLD. These arrays are of size N, where N is the number of nodes in the MPI application.
coll_data and coll_count arrays of unsigned 64-bits integers record respec-tively the cumulated amount of bytes sent from the current process to another process p, in the case of a all-to-all or one-to-all operations, or received from another process p to the current process, in the case of all-to-one operations, and the count of messages. The data in this array at the index i corresponds to the data sent to the process p, of id i in MPI_COMM _WORLD. These arrays are of size N, where N is the number of nodes in the MPI application. The communications are thus considered symmetrical in the resulting matrices.
size_histogram array of unsigned 64-bits integers records the distribution of sizes of pml messages, filtered or not, between the current process and a process p. This histogram is of log-2 scale. The index 0 is for empty messages. Messages of size between 1 and 264 are recorded such as the
following. For a given size S, with 2k≤ S < 2k+1, the k-th element of the
histogram is incremented. This array is of size N ×max_size_histogram, where N is the number of nodes in the MPI application.
max_size_histogram constant value correspond to the number of elements in the size_histogram array for each processor. It is stored here to avoid having its value hang here and there in the code. This value is used to compute the total size of the array to be allocated, initialized, reset or freed. This value equals (10 + max_size_histogram) × N, where N correspond to the number of nodes in the MPI application. This value is also used to compute the index to the histogram of a given process p ; this index equals i × max_size_histogram, where i is p’s id in MPI_COMM _WORLD.
log10_2 is a cached value for the common logarithm (or decimal logarithm) of 2. This value is used to compute the index at which increment the histogram value. This index j, for a message that is not empty, is computed as follow j = 1 + blog10(S)/log10(2)c, where log10 is the decimal logarithm and S
the size of the message.
rank_world is the cached value of the current process in MPI_COMM_WORLD. nprocs_world is the cached value of the size of MPI_COMM_WORLD.
common_monitoring_translation_ht is the hash table used to translate the rank of any process p of rank r from any communicator, into its rank in MPI_COMM_WORLD. It lives as long as the monitoring components do. In any case, we never monitor communications between one process and itself.
The different functions to access MPI_Tool performance variables are pretty straight forward. Note that for PML, OSC and COLL, for both count and size, performance variables the notify function is the same. At binding, it sets the count variable to the size of MPI_COMM_WORLD, as requested by the MPI-3 standard (for arrays, the parameter should be set to the number of elements of the array). Also, the notify function is responsible for starting the monitoring when any monitoring performance value handle is started, and it also disable the monitoring when any monitoring performance value handle is stopped. The flushcontrol variable behave as follows. On binding, it returns the size of the filename defined if any, 0 otherwise. On start event, this variable also enable the monitoring, as the performance variables do, but it also disable the final output, even though it was previously requested by the end-user. On the stop event, this variable flushes the monitored data to the proper output stream (i.e. stdout, stderr or the requested file). Note that these variables are to be bound only with the MPI_COMM_WORLD communicator. For far, the behavior in case of a binding to another communicator is not tested.
For the flushing itself, it is decomposed into two functions. The first one (mca_common_monitoring_flush) is responsible for opening the proper stream. If it is given 0 as its first parameter, it does nothing with no error propagated as it correspond to a disable monitoring. The filename parameter is only taken in account if fd is strictly greater than 2. Note that upon flushing, the record arrays are reset to 0. Also, the flushing called in common_monitoring.c call the specific flushing for per communicator collectives monitoring data.
For historical reasons, and because of the fact that the PML layer is the first one to be loaded, MCA parameters and the monitoring_flush control variable are linked to the PML framework. The other performance variables, though, are linked to the proper frameworks.
9.1.2 Common Coll Monitoring
In addition to the monitored data kept in the arrays, the monitoring component also provide a per communicator set of records. It keeps pieces of information about collective operations. As we cannot know how the data are indeed ex-changed (see Section 9.4), we added this complement to the final summary of the monitored operations.
We keep the per communicator data set as part of the coll_monitoring _module. Each data set is also kept in a hash table, with the communica-tor structure address as the hash-key. This data set is made to keep tracks of the mount of data sent through a communicator with collective operations and the count of each kind of operations. It also cache the list of the processes’ ranks, translated to their rank in MPI_COMM_WORLD, as a string, the rank of the current process, translated into its rank in MPI_COMM_WORLD and the communicator’s name.
The process list is generated with the following algorithm. First, we allocate a string long enough to contain it. We define long enough as 1 + (d + 2) × s, where d is the number of digit of the higher rank in MPI_COMM_WORLD and s the