HAL Id: hal-02904427
https://hal.archives-ouvertes.fr/hal-02904427
Submitted on 26 Jul 2020
HAL is a multi-disciplinary open access
archive for the deposit and dissemination of
sci-entific research documents, whether they are
pub-lished or not. The documents may come from
teaching and research institutions in France or
abroad, or from public or private research centers.
L’archive ouverte pluridisciplinaire HAL, est
destinée au dépôt et à la diffusion de documents
scientifiques de niveau recherche, publiés ou non,
émanant des établissements d’enseignement et de
recherche français ou étrangers, des laboratoires
publics ou privés.
The sonorous beat of optical waves in a Michelson
interferometer
Matthias Büchner, Jean-Philippe Loisel
To cite this version:
Matthias Büchner, Jean-Philippe Loisel. The sonorous beat of optical waves in a Michelson
inter-ferometer. American Journal of Physics, American Association of Physics Teachers, 2020, 88 (8),
pp.612-616. �10.1119/10.0001208�. �hal-02904427�
Matthias B¨uchner1, a)and Jean-Philippe Loisel1
Laboratoire Collisions Agr´egats R´eactivit´e-IRSAMC
Universit´e de Toulouse III Paul Sabatier, CNRS UMR 5589, 118 Route de Narbonne, 31062 Toulouse, France
(Dated: 26 July 2020)
This paper describes time dependant phase modulation experiments using an optical Michelson interferometer. Changes in the path length of the interferometer arms induce phase shifts in time and, thanks to a loudspeaker, the interferometric signal is audible. We produce time fluctuating refractive indices and mechanical motions of one reflecting mirror. A sinusoidal motion is applied, thus creating a phase modulation of one interferometer arm wave. Sidebands of the laser frequency appear which interfere with the other interferometer wave. Our hearing sense is quite developed and we use it to analyse the non linear character by the acoustic timbre. Finally we transfer information by phase modulation. Our set-up benefits to the visually-impaired community as temporal phase changes can be analysed by the auditory sense, but this unconventional use of an optical interferometer also attracts a general audience.
I. INTRODUCTION
The Michelson interferometer is a standard instrument to demonstrate interference of an optical wave. It can also be used as a precision instrument to detect tiny changes in the length of optical interferometer paths. One or both interferometer output beams can be sent to photodetectors and the optical intensity signals can be recorded, allowing high precision measurements of laser wavelengths1,2 and distance changes3. One impressive
example is the detection of gravitational waves with the LIGO experiment, rewarded in 2017 by the Nobel prize for R. Weiss, B.C. Barish and K.S. Thorne4–6,
Traditionally in education, the fringe patterns are ob-served visually and indeed their beauty is impressive and flawless.
Such an interferometer can also be used to demonstrate interferences in time, i.e. beats of optical waves. Mickey McDonald et al.7 described a Mach-Zehnder interferom-eter with an acousto-optical modulator (AOM), placed in each interferometer arm. These AOM shift differently the laser frequency by about 80 MHz and their frequency difference is some Hertz. The optical beating of the two laser waves can be directly observed: the intensity at any point within the pattern is seen to oscillate sinusoidally in magnitude. The beauty of this experiment is the ob-servation by eye of a pulsation in the Hertz region, at low frequencies never directly introduced in the experiment. Our approach also aims to observe beat notes of op-tical waves, but our set-up places the beat observation into the sound world. In fact, our auditory sense8–12can
discern precise frequencies: our fascination with music is based on this fact13,14. Our set-up doesn’t need AOMs
and their highly stabilised power supplies. The use of the auditory sense is of interest for the visually-impaired community but also adds an amusing educational aspect for a wide-spread audience.
a)Electronic mail: [email protected]
We add another component to a standard optical Michelson interferometer: we monitor the optical inter-ference signal by a photodiode and we send its amplified signal to a loudspeaker or headphone. We placed one mirror on a piezo actuator controlled translation stage. Our goal is to detect relative optical path length changes; i.e. phase shifts in time, by simply listening to the sound. Changing optical path length in time can be created by moving the position of the piezo-mounted mirror. An-other possibility is to alter the refractive index of the op-tical medium probed by one interferometer arm. In our case, the optical medium is air, its pressure and temper-ature fluctuations change the optical path difference thus the signal amplitude. Interference in time, i e. beating of the optical waves takes place and thanks to our set-up this beat is audible.
In the following, we recall briefly the theoretical back-ground. The experimental set-up will be described. We will then detail some experiments :
1. Touching the mirror mounts. This induces tiny changes in the mechanical path length difference, i.e. phase shifts in time which can be heard. 2. Making audible temporal changes of the refractive
index of the air.
3. Applying a sinusoidal phase modulation by modu-lating the position of one mirror. Harmonics are created which depend on the motion amplitude. The order and intensity of the harmonics can be analysed by listening to the sound as the acousti-cal timbre changes.
4. Finally the electrical signal of a MP3 player is am-plified and sent to a piezo mounted mirror, acting on the mirror position: The sound is transmitted by phase modulation and the interference signal con-tains this information.
Finally we will give hints to lower the costs, i.e. to re-place some commercial material by low-cost home made components. A conclusion completes our paper.
2
II. THEORETICAL BACKGROUND
We assume, that the light source emits a plane wave, with frequency νL and wavelength λL. The laser
wave-length bandwidth is supposed to be negligibly small. The electric field is then given by the well-known equation:
E(t, x) = E0cos ϕ(x, t), with (1)
ϕ(x, t) = 2π[ x λL
− νLt]
The incident wave is split into two parts with equal in-tensities (see fig.1). We use a 50%-50% beamsplitter, its coated side points to the right. One wave is travelling to the right; the other is reflected at the second (coated) surface of the beamsplitter and travels upwards. Both beams are reflected by two mirrors and are superposed on the beam splitter, which recombines both beams. The upper wave is phase shifted by 4πL/λL, where L is the
distance between the beam splitter and the mirror. A phase shift φ1 is added to include other differences in
the optical path, e.g. due to perturbation of the air re-fractive index. The other wave undergoes a similar phase shift of 4π(L+∆x)/λL+φ2, where L+∆x is the distance
between the right mirror and the beamsplitter.
The wave (”1”) travelling downwards passes through the beam splitter, while the other wave (”2”) is reflected at the right (air-side) surface, undergoing a π phase shift. We dropped all phase shifts related to the beamsplitter thickness. Both waves are superposed and form an out-put beam, situated at the lower part where we place our detector. Defining the wave phases ϕ1(2) at the detector
position yD:
ϕ1= 2π(yD+ 2L)/λL+ φ1− 2πνt
ϕ2= 2π(yD+ 2L + 2∆x)/λL+ φ2+ π− 2πνt
We can write ˜E(t)2= [E(t, y
D)/E0]2/2:
˜
E(t)2= [cos ϕ1(t) + cos ϕ2(t)] 2
(2) = cos2ϕ1+ cos2ϕ2+ 2 cos ϕ1cos ϕ2
= cos2ϕ1+ cos2ϕ2+ cos (ϕ1− ϕ2) + cos (ϕ1+ ϕ2)
The detected intensity, I(t), is proportional to ⟨
E(t, yD)2
⟩
T, where < . >T stands for the average over
the detector response time T with T >> 2π/νL. The
terms ⟨cos2ϕ 1(2)
⟩
T are oscillating at twice the optical
frequency νL=474 THz (λL= 632.8 nm), and each term
averages to 1/2. For the same reason, the interference term⟨cos (ϕ1+ ϕ2)⟩T vanishes. We get
I(t)∝ 1 + cos (ϕ1− ϕ2) (3)
∝ 1 + cos (4π∆x/λL+ φ2− φ1) + π
III. EXPERIMENTAL SET-UP
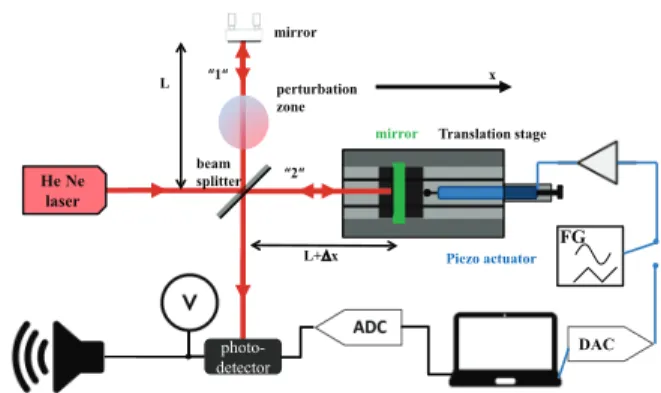
Figure 1 shows our set-up. The optical part is the well know Michelson interferometer. An initial wave is emit-ted by the He-Ne laser (Lasos LGR7621, 5mW, λL=632.8
nm). He Ne laser beam splitter mirror perturbation zone photo-detector Piezo actuator mirror Translation stage
x L L+'x FG DAC pho “1“ “2“
FIG. 1. Experimental set-up of our Michelson interferometer. One mirror is mounted on a piezo-driven translation stage and the interference signal is monitored by a photodetector. The photodetector signal is amplified and sent to a loudspeaker and to a computer via an analog-digital convertor (ADC). A pilot voltage is created by summing up a DC bias and a time varying voltage. This pilot voltage is amplified and drives the piezo actuator mounted mirror thus changing the optical path length. This pilot voltage can be created by a function generator (FG), a digital-analog convertor (DAC) or a MP3 player.
A beam splitter separates this wave into two equal parts, one travelling to the right, the other upwards. Thanks to two mirrors (Thorlabs PF10-03-P01), both waves are reflected and superposed on the beam split-ter.
The beam splitter recombines the two waves and two output beams can be distinguished, one at the bottom of the figure, the other on the left, with the outgoing beam pointing towards the laser. Remember, that this out-going beam should not be injected into the laser. Large fluctuations in intensity and frequency or even laser dam-age may occur otherwise.
We monitor the first output beam using the amplified signal from a photodetector (Thorlabs PDA36A2). The signal is connected to a oscilloscope, a loudspeaker and to a computer via an analog-digital convertor. We used the software Labview (National Instruments) to commu-nicate with a multifunction card (National Instruments: PCI 6259).
The right mirror is mounted on a commercial trans-lation stage (ACMEL TM-21-10). A piezo actuator (Piezomechanik GmbH Pst 150/5/40) with a maximum extension of 40 µm was placed between the moving ele-ment and an end-mounted positioning screw.We use a low voltage which is composed by a DC bias and a time vary-ing voltage. This pilot voltage is amplified by a home-made amplifier up to 100 V to drive the piezo actuator. The choice of all components was dictated by the avail-ability of the material in our laboratory.
At the beginning, it is convenient to align the Michel-son interferometer as usual, i.e. in the traditional optical way. Using a ruler, we equalize the distances between the mirrors and the beamsplitter. We superposed the
two outgoing beams till fringes are visible. Then, we act carefully on the inclinations of the mirrors to get the fringes as big as possible. The observed signal of the photodetector is given by:
I(t) = I0 [ 1 +V cos (4π∆x(t) λL + φ2− φ1) ] (4) with I0the mean value, proportional to the laser power,
and ∆x(t) the optical path length difference of the in-terferometer arms. This difference can be varied by the piezo actuator. V is the fringes visibility with V ≤ 1. There are many reasons which lead to smallerV, we can cite non-perfect superposition of the interfering beams and a path difference longer than the coherence length.
Once fringes are visible, a triangular signal from a waveform generator drives the position of the mounted mirror in a linear forth-back motion. The photodetec-tor signal is moniphotodetec-tored by an oscilloscope. We used the modulation signal to improve the alignment.
Typical values for our Michelson interferometer are
V= 95 % and I0= 4.5 V. Our maximal phase
sensitiv-ity ∆I/∆ϕ = I0V is about 4.3 mV/mrad and for the
displacement sensitivity we get ∆I/∆x= 85 mV/nm.
I(t) contains two parts (see eq.(4)). The constant part, I0, can not be heard. The other part is proportional to
the fringe visibilityV and I0 and this part produces the
sound. For typical speeds of the mirror mount around
vM= 70 µm/s, νM is about 221 Hz and this interference
signal can be heard thanks to the loudspeaker.
IV. APPLICATIONS
In this section, we will discuss several applications of our set-up and detail the underlying physics. The first two and the last examples (subsections A,B,D) concern qualitative experiments, while C is of more quantitative nature.
A. Transforming mechanical motion into sound: playing like a disk-jockey
A ”starter” to demonstrate the sensitivity of the in-terferometer is to transform mechanical vibration into sound. By changing the DC bias voltage, we set our interferometer to work around mid-fringe, i.e. at max-imum phase sensitivity. Just by pushing gently on the fixed mirror, one interferometer path length is changed in time, the fringes move and you can create sounds in a disk-jockey way. i.e. moving vinyl discs by hand back and forth.
The file ”disk-jockey.wav”15 contains one example of
sound recording. During the first 7 seconds, one can hear the vibrations induced by the footsteps. Then, the fixed mirror is pushed and the time varying path length difference leads to intensity fluctuation, thus to audible sounds.
One might think, that the pushed mirror changed the direction of the laser beam and only a fraction of the laser beam hit the sensitive area of the photodetector thus inducing a different signal. While continuing the pushing, we blocked at 14 seconds the right interferometer arm: no sounds are created. Unblocking this interferometer arm, again the sound is audible. We now blocked the other arm and again the sound died. This experiment proves that both interferometer arms are needed to create sounds. We also pushed the other mirror with the same results (29 seconds).
An alternative approach is to reduce the visibility to zero by misaligning the interferometer. The resulting sig-nal is given only by I0and no sounds are audible.
B. Listening to refractive index fluctuations
We can induce refractive index fluctuations on one in-terferometer arm. The refractive index of air depends on the temperature and the pressure. Taking the equation of Birch and Downs16 for dry air at temperature 20◦C
and pressure 1 bar (100 kPa), a pressure change of +10 kPa increases the refractive index of ∆n≈ 3×10⁻⁵(λL=
633 nm). Over a length of ℓ = 1 mm, this change induces a phase shift of ∆φ = 2π∆n(ℓ/λL)≈ 0.3 rad. For a
tem-perature change of +10◦C, we get ∆n≈ −0.9 × 10⁻⁵, i.e. ∆φ≈ -0.1 rad.
We provoked air density fluctuations in the probe zone. We tried to apply a heating resistance under one inter-ferometer arm, the fringes did move but their motion was too slow to be audible. Better results were achieved with a lightened match, although not to be recommend-able nearby optical elements (”allumette.wav”15). We employed an air duster with good results. A weak air stream is directed towards one interferometer beam in a vertical direction.
The file ”airduster.wav”15 contains the sound pro-duced (start at 4 seconds). At 11 seconds, one interferom-eter arm is blocked, released and at 14 seconds the other arm is blocked. Of course, both interferometer beams should be present to produce the sound. At 19 seconds the air stream is directed towards the blind side of the mirror mount. No sound can be heard, i.e. the sound heard before is not related to a hypothetical mirror vi-bration produced by the air stream.
C. Generation of frequency harmonics
Our set-up can be used to create frequency combs of the main laser frequency. Theodor W. H¨ansch17 and John Hall18 received the Nobel prize in 2005 for their ground breaking work on laser frequency combs and their important applications in high resolution spectroscopy.
We create frequency combs by phase-modulating one optical wave in the interferometer. A sinusoidal pilot voltage is applied to the piezo actuator, i.e. the mirror
4 is oscillating with an amplitude am and frequency νm:
∆x = ∆x0 + amsin (ωmt), with the angular frequency
ωm= 2πνm. By changing the DC bias voltage, ∆x0 can
be varied slowly in time. Inserting the fast sinusoidal motion, eq. (4) reads:
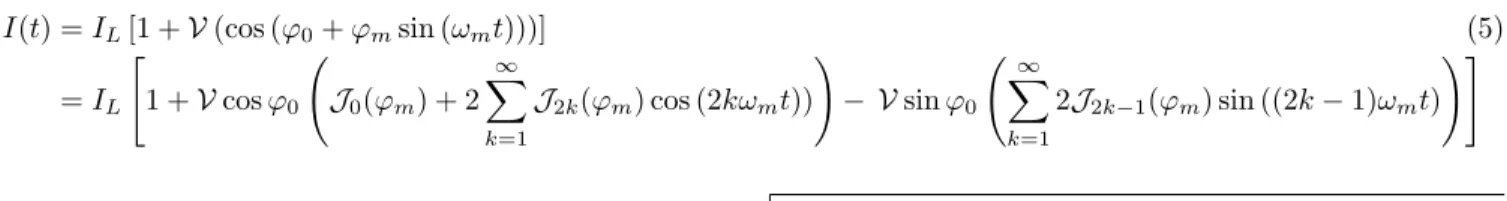
I(t) = IL[1 +V (cos (φ0+ φmsin (ωmt)))] (5)
= IL [ 1 +V cos φ0 ( J0(φm) + 2 ∞ ∑ k=1 J2k(φm) cos (2kωmt)) ) − V sin φ0 (∞ ∑ k=1 2J2k−1(φm) sin ((2k− 1)ωmt) )]
with φ0 = 4π∆x0/λL, φm = 4πam/λL. We developed I(t) using first-order Bessel functionsJk (see e.g. ref.19).
Harmonics of the mirror excitation frequency νm are
created with frequencies and amplitudes governed byJk.
If we choose φ0 = −π/2, the total phase is modulated
around zero, i.e. at midfringe. Only odd harmonics exist. For φ0= 0, modulation occurs at the maximum intensity.
Only even harmonics exist.
We recorded the interference signal of a phase modu-lation with a frequency ωm = 2π× 220 Hz and a small
modulation amplitude of φm= 0.14 rad. Figure 2 shows
our data. 0 10 20 30 40 50 60 0 1 2 3 4 5 6 7 8 9 26.940 26.942 26.944 26.946 3.5 4.0 4.5 5.0 signal (V) time (s) 0 50 100 150 200 250 300 350 400 450 0.000 0.005 0.010 0.015 FFT Amplitude (a.u.) 0 100 200 300 400 0.0 0.1 0.2 0.3 0.4 0.5 Frequency (Hz) FFT Amplitude (a.u.) B
FIG. 2. A sinusoidal phase modulation with φm= 0.14 and
ωm = 2π× 220 Hz was applied on one interferometer arm.
We varied slowly φ0 as a function of time. The left hand
inset shows a zoom on the recorded data demonstrating the applied modulation. A subset of data (inside the rectangles at 39 and 58 s) was selected for a Fast Fourier transform (FFT) analysis. The results are shown in the right hand insets.
We varied slowly the offset of the DC bias voltage, thus scanning the interference fringes. We pass from mid-fringe through the minimum (17 s recording time) and the maximum intensity (34 s). For this small phase modulation amplitude only the fundamental (k = 1) and the first harmonic (k = 2) contribute to the signal:
J1(0.14) = 0.06983 (220 Hz) andJ2= 0.00245 (440Hz).
The rectangles on the graph enclose the data subsets
taken for two Fourier analysis shown on Figure 2. The upper FFT graph corresponds to data in the mid-fringe window (≈ 39 s) and the lower to data around minimum (≈ 58 s). The first FFT analysis shows the presence of the fundamental frequency only (220Hz) while the second exhibits the second harmonic (440 Hz) only. As expected, these results are in complete agreement with the Bessel function amplitude.
We converted the data to a sound file (”220Hz10mV.wav”15). While scanning the pilot
offset voltage, the change in timbre can easily be recognized. At mid-fringe (φ0 = −π/2, 28s recording
time) the fundamental at 220 Hz (music notation: A3)
dominates as expected, while for the minima and max-ima the second harmonic (440 Hz, A4, 17, 34 and 47 s),
can clearly be heard. The 440 Hz sound component has lower volume, about 4 % of the 220 Hz one, according to the amplitude ratio|J2(0.14)/J1(0.14)|.
For the following experiment we set the offset of the pilot function to mid-fringe, i.e. φ0= π/2. We applied a
220 Hz modulation changing the modulation amplitude pilot voltage in order to vary the phase modulation am-plitude φmfrom 0.25 to 7.5 rad in steps of 0.25. The file
”midfringes3.wav” contains the recorded sound.
At the beginning the volume of the fundamental fre-quency increases with higher modulation amplitudes. While increasing φm, the change in timbre can clearly
be recognized. In fact the harmonics get stronger. At 24 seconds the third harmonic (660 Hz, A5) can be
distin-guished, but this depends on the person listening. However, one has to be aware that φ0 drifts slowly as
we do not employ any active stabilisation techniques. Ad-ditionally, the response of a piezo actuator is non linear to the applied voltage and this is particularly true for large voltage amplitudes. As a consequence, the phase modulation is only approximately linear.
At 49 seconds of recording time, the 220 Hz sound is weak. This corresponds to the first zero of the Bessel functionJ1(φm) with φm= 3.8 rad. Using the first part
of eq.(5), we fitted the interference signal and got φm=
3.8 rad, which is in agreement with the theoretical value. For high phase amplitude modulations, higher order har-monics are produced, we can speak of a frequency comb. This frequency comb has frequency spacing in the 100– 2000 Hertz region, well below the typical bandwidth of
a multimode 633 nm free running He-Ne laser, typically in the GHz region. As a consequence, sidebands can not be resolved in the energy (frequency) spectrum, but as we superpose this frequency comb to a coherent reference wave (the other interferometer arm), frequency fluctua-tions of the laser source are rejected and beats are pro-duced which are in our case audible. This is the base of homodyne detection technique.
D. Transfer of music by phase modulation of optical waves
An interesting experiment is the transmission of mu-sic by phase modulation of optical waves. We adjust our interferometer to mid fringe φm = π/2. We used
a sound file with music (”04-petit-pantin-au-coeur-de-glace-eponyme.wav”26). The sound amplitudes are
con-verted by a Labview program and a digital-analog conver-tor produces the driving voltage for the piezo actuaconver-tor, i.e. sound is converted to mechanical motion. The am-plification and the sound volume should be weak in order to privilege the fundamental frequency in phase modula-tion. Higher amplitudes promote higher harmonics, thus distortion of the sound. The sound file ”musicPM.wav” contains the interference signal.
During a demonstration, one person of the audience may be invited to use his/her mp3 player to plug the driving voltage input into the sound port. The sound is transmitted via phase modulation and this can be ver-ified by blocking the interferometer arms one after the other: once again the need of two laser beams for the transmission is demonstrated.
A discussion may be triggered about the advantages and inconveniences of the optical phase modulation tech-niques. Obviously this transmission protocol is not very handy for every-day use as this setup is very sensitive to vibrations and two coherent laser beams are needed (the two interferometer arms). However phase-modulation, in a radio–frequency or optical domain, is very important for research, we can cite the Pound-Drever-Hall technique for laser locking24,25.
According to quantum mechanics, phase modulation, especially beating (or the transmission of music), is not reserved to acoustic or electromagnetic waves: matter waves can also be phase modulated in time. We can cite the work of D´ecamps et al.21,22 (and refs. within). The
group studied beating of lithium waves by phase modula-tion in an atom Mach-Zehnder interferometer and trans-mission of music has been realised by phase modulated atom waves (see D´ecamps et al.23).
E. Reducing costs and improvements
The He-Ne laser can be replaced by a low cost laser pointer. The replacement of the electronics and/or the mechanical parts depends on the skills in electronics and
mechanics of the user: the high voltage amplification unit and the photodetector may be replaced by home-made versions as well as the mirror mountings. In fact, the pilot voltage is less than 10 V and it must be biased by a static voltage of about 50 V. The piezo actuator can be replaced by an positioner based on electromag-netic forces. Yin-Yen Kuo et al.27 describe a 3D printed positioner which has micrometer accuracy. The displace-ment of a permanent magnet is controlled by a coil and the magnet acts on a moving stage.
V. CONCLUSION
We used an optical Michelson interferometer to make time-varying optical path length changes audible. Our hearing, especially recognizing frequency changes, is very sensitive and we use it to demonstrate beat notes of op-tical waves. We apply this interferometer to recognize mechanical vibration of the interferometer mirrors and refractive index fluctuations of the air.
We applied a sinusoidal phase modulation by mechan-ically displacing one interferometer mirror. The non-linear response in phase of the interferometer leads to the creation of harmonics of the fundamental frequency. Optical frequency combs can be created, their beat has timbres as a function of applied phase modulation am-plitude. Finally we realized a transmission of music by phase modulation of an optical wave.
This non-conventional set-up adds educational aspects, which are original and amusing. Making optical interfer-ence audible paves the way for a visually-impaired com-munity to understand interferences of optical waves and but we think that the audible character of interferences also interests a general audience. The ”disk-jockey” ex-periment has already been shown during a public event in our university. The audience comprised pupils of sec-ondary education level. The experiments and the under-lying physics described in this paper will serve for edu-cational events, courses at school and talks for general public.
ACKNOWLEDGMENTS
We gratefully acknowledge Laurent Polizzi, Eric Panader and Michel Gianesin for the realisation of some mechanical supports. The authors owe particular grat-itude to Bruno Lepetit and Stephen Gibson for fruitful discussions and careful review of the manuscript. Fi-nancial support from the INP-CNRS and the Universit´e Toulouse III Paul Sabatier is acknowledged.
1M. Dobosz, M. Ko ˙zuchowski,“Overview of the laser-wavelength
measurement methods“, Optics and Lasers in Engineering 98 10711 (2017)
2J. Pedregosa-Gutierrez, D. Guyomarch, M. Vedel, C.
Cham-penois and M. Knoop, “Computer-controlled high-precision Michelson wavemeter“, Eur. Phys. J. Plus 129 203 (2014)
6
3K. Riles, “Gravitational waves: Sources, detectors and searches“,
Prog. Part. Nucl. Phys. 68, 1-54 (2013)
4R. Weiss, “LIGO and the Discovery of Gravitational Waves, I:
Nobel Lecture, December 8, 2017“, Ann. Phys. 531, 1800349 (2019)
5B.C. Barish, “LIGO and Gravitational Waves II: Nobel Lecture,
December 8, 2017“, Ann. Phys. 531, 1800357 (2019)
6K.S. Thorne, “LIGO and Gravitational Waves, III: Nobel
Lec-ture,December 8, 2017“, Ann. Phys. 531, 1800350 (2019)
7Mickey McDonald, Jiyoun Ha, Bart H. McGuyer, and Tanya
Zelevinsky, “Visible optical beats at the hertz level“, American Journal of Physics 82, 1003–1007 (2014)
8G. Stix, “How Hearing Works [Video]“ video
pub-lished by Scientific American, August 1 (2015):
”www.scientificamerican.com/article/how-hearing-works-video”
9S. Rigby, “ Human brains naturally tuned to hear music“,
Science Focus, 20th July (2019),
”https://www.sciencefocus.com/news/human-brains-naturally-tuned-to-hear-music/”
10Joseph E. Hawkins, “Human ear“, in Encyclopædia Britannica
inc, October 25 (2018),
”www.britannica.com/science/ear”
11W.M. Hartmann, “Signals, Sound, and Sensation“, Springer
Sci-ence & Business Media, Springer, New York, NY (2004)
12C.J. Plack, “The Sense of Hearing“, 3rd Edition, London:
Rout-ledge (2018)
13O. Freke , “Sine language“, in Plus Magazine, University of
Cam-bridge, Millennium Mathematics Project, Centre for Mathemat-ical Sciences, March 1 (2009),
”plus.maths.org/content/sine-language”
14W.M. Hartmann , “Principles of Musical Acoustics“, Springer
Science+Business Media, Springer, New York, NY (2013)
15supplementary material, [URL will be inserted by AIP]
16K.P Birch and M.J Downs, “An Updated Edl´en Equation for the
Refractive Index of Air“, Metrologia 30, 155–162 (1993)
17Theodor W. H¨ansch, “Nobel Lecture: Passion for precision“,
Rev. of Modern Physics, 78, 1297–1309 (2006)
18John L. Hall, “Nobel Lecture: Defining and measuring optical
frequencies“, Rev. of Modern Physics, 78, 1279–1295 (2006)
19M. Abranowitz and I.A. Stegan, “Handbook of Mathematical
Functions: with Formulas, Graphs, and Mathematical Tables“,
Dover Publications, Inc. New York, 9thedition (1965)
20R. Feynman, R. B. Leighton, and M. Sands, “The Feynman
Lec-tures on Physics“, (Addison-Welsley, Reading, MA,1962), Vol. I, 2nd printing (1966)
21B. D´ecamps et al., “Observation of Atom-Wave Beats Using a
Kerr Modulator for Atom Waves“, Phys. Ref. Lett. 116, 053004– 053004-5 (2016)
22B. D´ecamps et al., “Phase modulation of atom waves: theory and
experiment using the atom optics analogue of the Kerr effect“, Europ. Journal of Physics D 71, 334 (2017)
23B. D´ecamps et al., “Observation of Atom-Wave Beats Using a
Kerr Modulator for Atom Waves“, Phys. Ref. Lett. 116, 053004– 053004-5 (2016), suppl. material
24R.W.P. Drever, J.L. Hall, J. L.; F.V. Kowalski, J. Hough, G.M.
Ford, A.J. Munley, H. Ward, “Laser phase and frequency sta-bilization using an optical resonator“; Applied Physics B. 31, 97-105 (1983)
25Eric D. Black, “An introduction to PoundDreverHall laser
fre-quency stabilization“, Am. J. Phys. 69, 79-87 (2001)
26Laei, “Petit pantin au coeur de glace“, source: lacrymosa.
tuxfamily.org/, Licence: artlibre.org/licence/lal, www.
auboutdufil.com/index.php?id=458 (6MB)
27Y.-Y Kuo, C.-H; Cheng and Sh.-K. Hung, “3D-Printed Linear
Positioner with Micrometer Accuracy“, MATEC Web of Confer-ences 95, 10005 (2017)