HAL Id: hal-03105376
https://hal.sorbonne-universite.fr/hal-03105376
Submitted on 11 Jan 2021
HAL is a multi-disciplinary open access archive for the deposit and dissemination of sci-entific research documents, whether they are pub-lished or not. The documents may come from teaching and research institutions in France or abroad, or from public or private research centers.
L’archive ouverte pluridisciplinaire HAL, est destinée au dépôt et à la diffusion de documents scientifiques de niveau recherche, publiés ou non, émanant des établissements d’enseignement et de recherche français ou étrangers, des laboratoires publics ou privés.
Covid-19
Thierry Poynard, Olivier Deckmyn, Marika Rudler, Valentina Peta, Yen Ngo,
Mathieu Vautier, Sepideh Akhavan, Vincent Calvez, Clemence Franc, Jean
Castille, et al.
To cite this version:
Thierry Poynard, Olivier Deckmyn, Marika Rudler, Valentina Peta, Yen Ngo, et al.. Performance of serum apolipoprotein-A1 as a sentinel of Covid-19. PLoS ONE, Public Library of Science, 2020, 15 (11), pp.e0242306. �10.1371/journal.pone.0242306�. �hal-03105376�
RESEARCH ARTICLE
Performance of serum apolipoprotein-A1 as a
sentinel of Covid-19
Thierry PoynardID1☯*, Olivier Deckmyn2☯
, Marika Rudler3, Valentina Peta2, Yen Ngo2, Mathieu Vautier4, Sepideh Akhavan5, Vincent Calvez6, Clemence Franc2, Jean Marie Castille2, Fabienne Drane2, Mehdi Sakka
ID6, Dominique Bonnefont-Rousselot6,
Jean Marc Lacorte7, David Saadoun4, Yves Allenbach4, Olivier Benveniste4, Frederique Gandjbakhch8, Julien Mayaux9, Olivier Lucidarme10, Bruno Fautrel8, Vlad Ratziu3,11,12, Chantal Housset1, Dominique Thabut3, Patrice Cacoub4
1 Institute of Cardiometabolism and Nutrition (ICAN), Centre de Recherche Saint-Antoine (CRSA), INSERM, Sorbonne Universite´ , Assistance Publique-Hoˆpitaux de Paris (AP-HP), Paris, France, 2 BioPredictive, Research, Paris, France, 3 Department of Hepatology, Sorbonne Universite´, AP-HP Pitie´-Salpêtrière, Paris, France, 4 Department of Internal Medicine and Clinical Immunology, Sorbonne Universite´ , AP-HP Pitie´-Salpêtrière, Paris, France, 5 Department of Virology, Sorbonne Universite´ , AP-HP Pitie´-Salpêtrière, Paris, France, 6 Department of Metabolic Biochemistry, Sorbonne Universite´ , AP-HP Pitie´-Salpêtrière, Paris, France, 7 Department of Biochemistry, Endocrinology and Oncology, Sorbonne Universite´, AP-HP Pitie´-Salpêtrière, Paris, France, 8 Department of Rhumatology, Sorbonne Universite´ , AP-HP Pitie´-Salpêtrière, Paris, France, 9 Department of Intensive Care, Sorbonne Universite´, AP-HP Pitie´-Salpêtrière, Paris, France, 10 Department of Radiology, Sorbonne Universite´ , AP-HP Pitie´-Salpêtrière, Paris, France, 11 Institut of Cardiometabolism and Nutrition ICAN, Sorbonne Universite´, AP-HP Pitie´-Salpêtrière, Paris, France, 12 INSERM, Sorbonne University, UMRS 1269 Nutriomique, service de Nutrition, APHP, Paris, France ☯These authors contributed equally to this work.
*thierry@poynard.com
Abstract
Background
Since 1920, a decrease in serum cholesterol has been identified as a marker of severe pneumonia. We have assessed the performance of serum apolipoprotein-A1, the main transporter of HDL-cholesterol, to identify the early spread of coronavirus disease 2019 (Covid-19) in the general population and its diagnostic performance for the Covid-19.
Methods
We compared the daily mean serum apolipoprotein-A1 during the first 34 weeks of 2020 in a population that is routinely followed for a risk of liver fibrosis risk in the USA (212,297 serum) and in France (20,652 serum) in relation to a local increase in confirmed cases, and in com-parison to the same period in 2019 (266,976 and 28,452 serum, respectively). We prospec-tively assessed the sensitivity of this marker in an observational study of 136 consecutive hospitalized cases and retrospectively evaluated its specificity in 7,481 controls represent-ing the general population.
Results
The mean serum apolipoprotein-A1 levels in the survey populations began decreasing in January 2020, compared to the same period in 2019. This decrease was highly correlated
a1111111111 a1111111111 a1111111111 a1111111111 a1111111111 OPEN ACCESS
Citation: Poynard T, Deckmyn O, Rudler M, Peta V,
Ngo Y, Vautier M, et al. (2020) Performance of serum apolipoprotein-A1 as a sentinel of Covid-19. PLoS ONE 15(11): e0242306.https://doi.org/ 10.1371/journal.pone.0242306
Editor: Ratna B. Ray, Saint Louis University,
UNITED STATES
Received: August 26, 2020 Accepted: October 31, 2020 Published: November 20, 2020
Copyright:© 2020 Poynard et al. This is an open access article distributed under the terms of the
Creative Commons Attribution License, which permits unrestricted use, distribution, and reproduction in any medium, provided the original author and source are credited.
Data Availability Statement: All relevant data are
within the manuscript and itsSupporting informationfiles.
Funding: EIT Health is funding short-term projects
to help combat the COVID-19 pandemic as part of its Rapid Response initiative (https://eithealth.eu/ covid-19/covid-19-rapid-response/). The present article is the first step of the PROCOP project, focusing on apolipoprotein-A1 performances, belong to the 15 projects selected cover biotechnology, diagnostics, digital health and med tech, and are run by 41 partners
with the daily increase in confirmed Covid-19 cases in the following 34 weeks, both in France and USA, including the June and mid-July recovery periods in France. Apolipopro-tein-A1 at the 1.25 g/L cutoff had a sensitivity of 90.6% (95%CI84.2–95.1) and a specificity of 96.1% (95.7–96.6%) for the diagnosis of Covid-19. The area under the characteristics curve was 0.978 (0.957–0.988), and outperformed haptoglobin and liver function tests. The adjusted risk ratio of apolipoprotein-A1 for survival without transfer to intensive care unit was 5.61 (95%CI 1.02–31.0; P = 0.04).
Conclusion
Apolipoprotein-A1 could be a sentinel of the pandemic in existing routine surveillance of the general population. NCT01927133, CER-2020-14.
Introduction
There is an urgent need to detect people in the general population who are at risk of being admitted to the hospital for Covid-19. Although viral nucleic acid testing and chest computed tomography are standard methods for diagnosing Covid-19 in patients with symptoms, these are time consuming. A review reported that there are only three models for predicting hospital admission in the healthy general population, and these are limited by a high risk of bias, and by using proxy outcomes [1].
In February 2020 we observed in Pitie´-Salpêtrière hospital Paris, France (“APHP-PSL”), that patients hospitalized for Covid-19 had a specific profile of apolipoprotein-A1 decrease and haptoglobin increase. This profile was never observed before in our prospective data on apolipoprotein-A1 from and since the first cohort of alcoholic liver disease in 1982 (S1 File) nor in patients at risk of liver fibrosis followed with FibroTest, which include apolipoprotein-A1 in its components. Therefore, in the large cohorts of patients followed by FibroTest for a risk of liver fibrosis (named serum-cohorts) we aim to compare the daily value of serum apoli-poprotein-A1, of the ongoing year 2020 to previous years “Covid-19 Free”.
Our hypothesis was supported by the literature reporting this profile of apolipoprotein-A1 in patients with viral pneumonia. In 1920, Harold A. Kipp found that a decrease in serum cho-lesterol was a marker of severe pneumonia [2]. One hundred years later, a meta-analysis con-firmed that levels of high-density lipoprotein cholesterol (HDL) and a level below the median of its transporter, apolipoprotein-A1, were associated with a two-fold increase in mortality in patients with severe sepsis (S1 Fig,S1 Table) [3]. Its decrease seems to occur earlier than the increase in haptoglobin, another marker of sepsis, and independently of liver function tests [4,
5]. Recently, hypolipidemia was reported in Covid-19 patients with mild symptoms [6,7]. Fur-thermore, unlike haptoglobin, which is synthesized mainly by the liver, apolipoprotein-A1 is synthesized by both the liver and the intestine [5]. This early decrease in apolipoprotein-A1 with normal liver function test and before the haptoglobin increase suggested an intestinal route of infection [8,9] (S1 File).
Therefore, in the general population, apolipoprotein-A1 might be a sensitive marker of SARS-COV2 infection from apparently healthy carriers, to severe patients hospitalized with Covid-19. To support this hypothesis, we analyze apolipoprotein-A1 in large serum-cohorts and in Covid-19 patients.
(https://eithealth.eu/project/procop/. The projects work directly with healthcare services as part of the consortia, so that the solutions can be built in line with clinical needs and implemented without delay. The EIT Health Partner of PROCOP is Assistance Publique Hoˆpitaux de Paris (APHP; (Leader of the project), a French Public Organization. The following authors are full employees of APHP: MR, MV, SA, VC, MS, DBR, JML, DS, YA, OB, FG, JM, OL, BF, VR, DT and PC. The EIT Health Partner is BioPredictive, a spinoff research company of APHP and Sorbonne University, founded by TP (APHP and Sorbonne University). All the patents invented by TP belong to APHP. The following authors are full employees of BioPredictive: OD, VP; and YN. The following authors contributed to Funding acquisition, and Project administration: JMC, FD, CF. The following authors contributed, to Resources, References review & editing (VP), and OD (Conceptualization; Data curation;
Methodology; Software).
Competing interests: TP has several USPTO
patents related to the performance of Apoa1 in patients with liver disease, including #10,198,552 Method of diagnosis of fibrotic diseases, #7,860,656 Diagnosis method of hepatic steatosis using biochemical markers, 7,856,319, Diagnosis method of alcoholic steato-hepatitis using biochemical markers, #7,225,080 Diagnosis method of inflammatory, fibrotic or cancerous disease using biochemical markers, and # 6,631,330 Diagnosis method of inflammatory, fibrotic or cancerous disease using biochemical markers, and applications pending: #20200011879 Method of diagnosis of drug induced liver injury, 20190265241 Method of diagnosis of non-alcoholic fatty liver diseases, #3 20140329260 Method of diagnosis of fibrotic diseases, and #20090111132 Diagnosis method of hepatic steatosis using biochemical markers. The data underlying the findings described in the manuscript are fully detailed including the confounding factors, without restriction, in the numerous supplementary files. The commercial affiliation does not alter our adherence to PLOS ONE policies on sharing data and materials.
In serum-cohorts, the first primary endpoint was to demonstrate a significant decrease of the mean daily value of apolipoprotein-A1 in the 34 weeks of the pandemic year 2020,vs. those of the year 2019. The second aim was to demonstrate the absence of significant confounding factors explaining such temporal association. Then, the third aim was to assess the dynamic temporal association of apolipoprotein-A1 values with the number of confirmed Covid-19 cases in SA and France.
In patients with Covid-19, the first aim was to evaluate the diagnostic performance of apoli-poprotein-A1. For this purpose, the sensitivity was assessed in the hospitalized patients. The specificity was assessed in a previous prospective study performed in a representative sample of the French general population before the pandemic. Finally, the last aim was to evaluate the prognostic value of apolipoprotein-A1 in the hospitalized patients.
Patients and methods
Ethics
The prospective observational study in Covid-19 patients was approved by CER-Sorbonne University IRB, CER-2020-14, with a signed informed consent. All of the previously published patient analyses from retrospective databases were non-interventional studies, without supple-mentary blood samples, and were exempt from a review of the IRB (NCT01927133). The investigation was performed according to the principles of the Declaration of Helsinki. All authors had access to the study data and reviewed and approved the final manuscript.
Significant decrease of apolipoprotein-A1 in 2020 serum-cohorts
We used three cohorts of serum from subjects at risk of liver fibrosis followed by FibroTest (FibroSure in USA) [10]. These serum-cohorts had three increasing levels of Covid-19 inci-dence in 2020. The large private-laboratories US cohort (“US-cohort”), has a lower risk of 19 than the “(French-cohort”) following patients in academic hospital treating Covid-19 patients and private-laboratories, and a high-risk cohort which included patients at the Pitie´-Salpêtrière hospital Paris, France (“APHP-PSL”), which was a Covid center. The core
temporal analysis compared the first 34 weeks of US consecutive anonymous serum 2020vs.
the serum 2019. Details of serum-cohorts were given inS2 File.
Confounding factors in serum-cohorts
Decrease in apolipoprotein-A1 may be due to direct liver toxicity from SARS-CoV-2 [11], but also to drug-induced liver disease (DILI) caused by medications (S2 Table). We analyzed the kinetics of alpha2-macroglobulin (A2M) a specific marker of liver fibrosis [10], and of hapto-globin, a sensitive biomarker of severe acute phase, as liver function tests, gammaglutamyl transpeptidase (GGT), alanine aminotransferase (ALT) and total bilirubin. In serum from sub-jects followed for non-alcoholic fatty liver disease (NAFLD) the kinetics of total cholesterol), triglycerides, fasting glucose, weight and height were also analyzed.
Temporal association between daily apolipoprotein-A1 and spread of
Covid-19
The number of confirmed Covid-19 cases in France and in the USA was assessed according to
published data from the European Centre for Disease Prevention and Control (https://
Sensitivity and prognostic values in Covid-19 patients
Sensitivity and prognostic values were assessed in a prospective study of Covid-19 patients hospitalized in APHP-PSL. The primary endpoint was the survival without transfer in ICU at 28 days, adjusted on age, gender, haptoglobin, and liver tests.
Specificity in general population: Specificity-cohorts
We previously collected five cohorts, names here “specificity cohorts” which allowed us to ret-rospectively validate the specificity of apolipoprotein-A1 in a large group of subjects without Covid-19 [12–16]. The measurements were all performed on fresh prospectively collected serum and analyzed in the biochemistry unit of the APHP-PSL hospital, with the same meth-ods as the Covid-19 cases. The core control population for specificity assessment was a group of healthy volunteers that was representative of the French population (CPAM: Caisse Pri-maire Assurance Maladie) [16].
Patients with diarrhea
In order to identify a profile of patients with a possible intestinal route of infection, we com-pared the subsets of patients with or without diarrhea.
Biochemical and virological methods
Apolipoprotein-A1, haptoglobin, A2M, GGT, ALT and bilirubin were assessed following Bio-Predictive (Paris, France) analytical recommendations [17]. The virological methods for the diagnosis used to diagnose SARS-CoV2 in respiratory samples, were detailed inS2 File.
Temporal association in Covid-19 patients
The kinetics of apolipoprotein A1 and haptoglobin were assessed prospectively in patients with repeated serum during the hospitalization.
Statistical methods
The first primary endpoint was to demonstrate a significant decrease of the mean daily value of apolipoprotein-A1 in the 34 weeks of the year 2020,vs. those of the year 2019. We defined a significant decrease of apolipoprotein-A1 as below 1.25 g/L, the optimal cutoff defined by the highest Youden index (sensitivity + specificity -1) using the hospitalized Covid-19 patients for sensitivity, and the CPAM population representative of the general population for the specific-ity [16]. The daily proportion of serum below this cutoff defined a significant risk of Covid-19. The mean of apolipoprotein-A1 on all the 2019 serum of the US-cohort was taken as the refer-ence in a large population without Covid-19. This allowed to assess the proportion of low apo-lipoprotein-A1 during the spread of the pandemic, including the peak and the recovery periods. Thanks to the power of the sample size, we simply compared graphically the temporal trends between years for the study. A significant difference of the mean daily levels of apolipo-protein-A1, and the daily proportion of low apolipoprotein-A1 was defined as an absence of overlap of the 95% confidence interval (95%CI) between the curves, during the same 34 weeks periods per year.
The second analysis was to exclude confounding factors. The same graphical method was used. In the large US cohort this method permitted also to describe the trends of apolipopro-tein-A1 after a triple stratification on age, gender and the cause of liver disease.
Table 1. Characteristics of the patients included in US and French serum-cohorts.
Characteristics 2020 2019 P-Value
US-cohort N = 212,297 N = 266,976
Median age [IQR) 54.1 [40.5–63.4] 55.0 [41.6–63.3] <0.001
Age category n (%) <0.001 < 50 year 87,473 (41.2) 102,984 (38.6) 50 to <70 year 102,797 (48.4) 138,026 (51.7) > = 70 year 22,027 (10.4) 25,966 (9.7) Male sex (%) 119,227 (56.2) 148,997 (55.8) <0.001 Apolipoprotein-A1<1.25 g/L (%) 70,212 (33.1) 71,994 (27.0) <0.001
Median laboratory (IQR)
Apolipoprotein-A1 g/L 1.36 [1.18–1.57] 1.41 [1.23–1.62] <0.001
Haptoglobin g/L 1.23 [0.82–1.68] 1.23 [0.82–1.68] 0.54
Alpha-2-macroglobulin g/L 2.15 [1.64–2.92] 2.26 [1.70–3.07] <0.001
GGT IU/L 37 [21–78] 37 [21–79] 0.05
ALT IU/L1 38 [22–69] 38 [22–68] <0.001
Total bilirubin micromol/L 6.84 [5.13–10.26] 6.84 [5.13–10.26] 0.002
Fibrosis stage by FibroTest (%) <0.001
F0 108,925 (51.3) 132,698 (49.7) F1 42,667 (20.1) 53,605 (20.1) F2 15,467 (7.3) 20,289 (7.6) F3 20,847 (9.8) 27,823(10.4) F4 22,886 (10.8) 30,669 (11.5) Non interpretable 1,505 (0.7) 1,892 (0.7)
NAFLD (surveillance by NASH-FibroTest)2 N = 44,049 (20.1) N = 48,201 (18.1) <0.001
Weight Kg 88.5 (74.8–104.8) 88.5 (74.8–104.3) 0.13
Aspartate amino transferase (AST) IU/L 34 (25–52) 34 (25–52) 0.92
Total cholesterol mmol/L 4.53 (3.78.5.33) 4.53 (3.80–5.28) <0.0013
Triglycerides mmol/L 1.57 (1.13–2.23) 1.57 (1.13–2.23) 0.03
Fasting glucose mmol/L 5.72 (5.11–6.89) 5.61 (5.06–6.78) <0.001
French-cohort N = 20,652 N = 28,452
Median age [IQR) 53.8 (41.0–64.1) 52.4 (39.5–63.1) <0.001
Age category n (%) <0.001 < 50 year 8,523 (41.3) 12,668 (44.5) 50 to <70 year 9,223 (44.7) 12,291 (43.2) > = 70 year 2,906 (14.0) 3,493 (12.3) Male sex (%) 11,947 (57.8) 16,356 (57.5) <0.001 Apolipoprotein-A1<1.25 g/L (%) 6,465 (31.3) 7,794 (27.4) <0.001
Median laboratory (IQR)
Apolipoprotein-A1 g/L 1.38 (1.20–1.58) 1.40 (1.23–1.61) <0.001
Haptoglobin g/L 1.18 (0.79–1.62) 1.15 (0.77–1.57) <0.001
Alpha-2-macroglobulin g/L 1.96 (1.52–2.60) 2.01 (1.56–2.69) <0.001
GGT IU/L 37 (21–80) 34 (20–73) <0.001
ALT IU/L 31 (21–51) 31 (21–50) 0.47
Total bilirubin micromol/L 8.7 (6–12) 8.7 (6–12) 0.22
Fibrosis stage by FibroTest (%)
F0 10,650 (51.6) 14,887 (52.3) <0.001
F1 4,592 (22.2) 6,239 (21.9)
F2 1,492 (7.2) 2,045 (7.2)
The third primary endpoint was to assess the temporal association between the spread of Covid-19 and the decrease in apolipoprotein-A1. For this purpose, we compared graphically the daily mean number of confirmed Covid-19 cases and the daily proportion of low apolipo-protein-A1.
The diagnostic performance of biomarkers was assessed using non-parametric AUROCs. The prognostic values were assessed by survival curves, using Kaplan-Meier method, com-pared by Logrank test (cutoff being the median of this context of use) and adjusted by Cox model. The repeated serum assessments were compared by repeated ANOVA and Tukey-Kra-mer multiple-comparison test. R and NCSS-2020 were used as statistical software.
Table 1. (Continued)
Characteristics 2020 2019 P-Value
F3 1,859 (9.1) 2,477 (8.7)
F4 1,886 (9.1) 2,579 (9.1)
Non interpretable 190 (0.8) 201 (0.8)
NAFLD (surveillance by NASH-FibroTest)2 2,904 (14.1) 3,559 (12.5) <0.001
Weight Kg 83 (71–97) 83 (71–96) 0.18
Aspartate amino transferase (AST) IU/L 30 (23–42) 30 (23–41) 0.85
Total cholesterol mmol/L 4.78 (4.00–5.55) 4.76 (4.00–5.62) 0.24
Triglycerides mmol/L 1.38 (1.00–1.96) 1.40 (1.00–2.00) 0.02
Fasting glucose mmol/L 5.74 (5.14–6.96) 5.73 (5.17–6.89) 0.53
APHP-PSL-cohort N = 3,122 N = 3,928
Median age [IQR) 54.3 (41.7–65.0) 53.4 (40.8–62.9) <0.001
Age category n (%) <0.001 < 50 year 1282 (41.1) 1659 (42.2) 50 to <70 year 1334 (42.7 1864 (47.5) > = 70 year 506 (16.2) 405 (10.3) Male sex (%) 1684 (53.9) 1964 (50.0) <0.001 Apolipoprotein-A1<1.25 g/L (%) 1464 (47) 1176 (30)
Median laboratory (IQR)
Apolipoprotein-A1 g/L 1.27 (1.07–1.47) 1.40 (1.21–1.60) <0.001
Haptoglobin g/L 1.34 (0.86–1.99) 1.24 (0.84–1.69) <0.001
Alpha-2-macroglobulin g/L 1.67 (1.34–2.20) 1.78 (1.38–2.32) <0.001
GGT IU/L 34 (21–67) 31 (20–57) <0.001
ALT IU/L 28 (20–43) 27 (19–40) 0.55
Total bilirubin micromol/L 8 (6–11) 8 (5–11) 0.03
Fibrosis stage by FibroTest (%) <0.001
F0 1873 (60.0) 2523 (64.2) F1 615 (19.7) 702 (17.9) F2 185 (5.9) 203 (5.2) F3 207 (6.6) 263 (6.7) F4 202 (6.5) 213 (5.4) Non interpretable 40 (1.3) 24 (0.6)
1Not normal distribution, the means of ALT were in 2020 61.5 IU/L vs 60.4 IU/L in 2019.
2NASH-FibroTest included more components than FibroTest: weight, aspartate aminotransferase, total cholesterol, triglycerides, and fasting glucose. 3Not normal distribution, the means of total cholesterol were in 2020 4.62 mmol/L vs in 2019 4.59 mmol/L. The P-value is 0.0003.
Results
Characteristics of patients included in serum-cohorts
The core temporal analysis compared the first 34 weeks (between January 1stto August 20th,
2020) of consecutive anonymous serum 2020vs. the serum 2019 from the three routinely
fol-lowed cohorts. The number for USA was 212,297 serum in 2020, 266,976 serum in 2019, then for the French cohort 20,652 serum in 2020, 28,452 serum in 2019 and for the APHP-PSL cohort 3,122 serum in 2020, and 3,928 in 2019, described inTable 1. For the US-cohort in 2020, the median age was 54 years (IQR 41–63), 56% men, 80% followed for HCV and 20% for NAFLD, 71% with non-significant fibrosis (stage F0-F1 by FibroTest). During the same 34 weeks period in 2019 these characteristics were similar, 55 (IQR 42–63) years of age, 56% men, 80% HCV and 70% stage F0-F1.
All the serum from 2018 were also analyzed for assessing the temporal variability of the bio-markers vs. 2019, two years without Covid-19, including for USA 407,138 serum in 2019, 383,865 serum in 2018, then for the French cohort 43,963 serum in 2019, 45,067 in 2018, and for the APHP-PSL cohort 6,119 in 2019, and 6,568 in 2018.
Due to the lockdown of populations during the pandemic, both in France and USA the number of the daily number of sera analyzed from January-August 20th, 2020 varied
Fig 1. Quantitative decrease of apolipoprotein-A1 by cohort. Apolipoprotein-A1 decreased (P<0.001) in the three cohorts, starting early in
January 2020 (red line with 95% confidence interval) in the US cohort (lower panel).
significantly compared to from January-August 20th, 2019 in the three cohorts of patients fol-lowed for a risk of liver fibrosis (S2C Fig).
Decrease of apolipoprotein-A1 in serum-cohorts
The reference daily proportion of low (<1.25 g/L) apolipoprotein-A1 assessed in the 2019 US-serum-cohort, was 27.3% (95% CI 27.2–27.5; 111,262 out of 407,138 serum). The mean daily levels of apolipoprotein-A1 decreased in the three serum-cohorts (Fig 1; all P<0.001), during the first 34 weeks of 2020. This was already highly significant in January 2020 in the US-cohort (lower panel), compared to first 34 weeks of 2019 and 2018. The mean daily pro-portion of serum with low apolipoprotein-A1 (<1.25 g/L) was 33.1% (95%CI 32.9–33.3 n = 70,212) on 34 weeks, that is 5.8% highervs. the reference (P<0.001) in the same 34 weeks of 2019.
There was no significant difference between the years 2019 and 2018 for the daily mean by cohort (Fig 1) and only 0.8% difference between the proportion of low apolipoprotein-A1 assessed on the full 52 weeks 27.3% (95%CI 27.2–27.5; 111,262 out of 407,138) in 2019 vs. 26.5% (95%CI 26.3–26.6; 101,591 out of 383,865) in 2018.
In the US cohort 2020, the proportion of low apolipoprotein-A1 was 37.0% on the first peak (April 7th), that is 9.7% greater than the reference proportion, 27.3%, in 2019. The pro-portion of low apolipoprotein-A1 was 40% on the second peak (August 18th), that is 10.7%
Fig 2. Proportion of serum with low apolipoprotein-A1 by cohorts. Low apolipoprotein-A1 was defined as below 1.25 g/L. Details in
Table 2.
greater than the reference proportion, 27.3%, in 2019. In France 2020, the increase reached 12.7% on April 14thand dropped to 0% on June 20th(Fig 2andTable 2).
Confounding factors in serum-cohorts
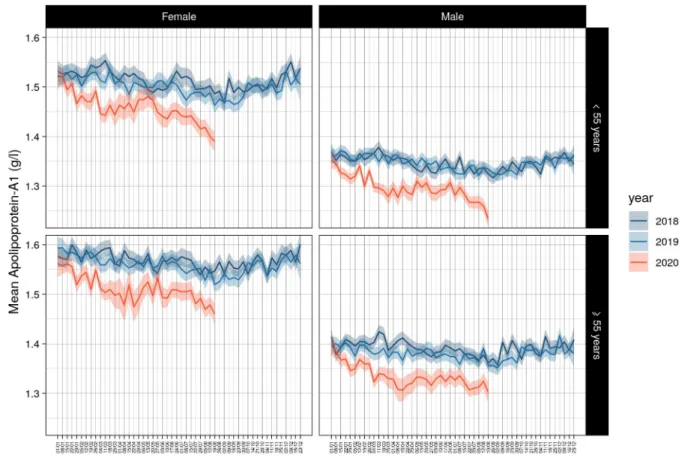
The same significant kinetics in apolipoprotein-A1 levels were observed after stratification of the temporal curves for gender and age in the three cohorts. The US-cohort was the only sam-ple that had the necessary power to compare these two factors together between 2020 and 2019 and 2018, and in the subsets of patients with HCV or NAFLD (S3 Fig). The higher drops were observed in August 2020 for subjects younger than 55 years both for male and female (Fig 3).
Apolipoprotein-A1 decrease was similar during Covid-19 spread versus 2019 and 2018 in the US-cohort (S2 File,S3 Fig). The kinetics of apolipoprotein-A1 were not associated with those of haptoglobin in the US-cohort. As expected, there was a significant haptoglobin increase at the peak of the pandemic in the French cohorts and particularly in the APHP-PSL cohort (Fig 4) (S4 Fig).
For A2M, in the US-cohort, there was a significant lower mean serum value, when com-pared to 2019 and 2018, and detailed inS5 Fig. This significant decrease of A2M was regular since January 2018, persisted after stratification by age and gender, but was no longer signifi-cant in the serum of NAFLD, between 2020 and 2019 years. In HCV the signifisignifi-cant decrease of A2M persisted only between the years 2019 vs 2018 after stratification by age and gender.
The other significant differences were, in the French-cohorts, GGT increased during the pandemic peak and returned to previous years’ value thereafter (S6 Fig), in the US-cohort and a transient increase in ALT in April 2020, (S7 Fig). No changes were observed for total biliru-bin, total cholesterol, triglycerides, fasting glucose, weight or height between cohorts (S8 Fig).
Table 2. Proportion of low apolipoprotein A1 among the three serum-cohorts.
Year Cohort period ApoA1 low Total Proportion % of low apolipoprotein-A1
<1.25g/L 34 weeks mean (95%CI) First Covid-19 peak week
n n crude standardized crude standardized date of first peak
2018 APHP 52w 2,168 6,568 33.0 (31.9–34.2) 6.2 n.a. n.a. n.a.
2019 APHP 52w 1,812 6,119 29.6 (28.5–30.1) 2.3 n.a. n.a. n.a.
2019 APHP 34w 1,176 3,928 29.9 (28.5–31.4) 2.6 n.a. n.a. n.a.
2020 APHP 34w 1,464 3,122 46.9 (45.1–48.6) 19.6 80.0 52.72 April 7th
2018 France 52w 12,691 51,635 28.2 (27.7–28.6) 1.4 n.a. n.a. n.a.
2019 France 52w 12,563 50,082 27.1 (26.5–27.6) 0.3 n.a. n.a. n.a.
2019 France 34w 7,794 28,452 27.4 (26.9–27.9) 0.1 n.a. n.a. n.a.
2020 France 34w 6,465 20,652 31.3 (30.4–31.8) 4.0 40.0 12.73 April 14th
2018 USA 52w 101,591 383,865 26.5 (26.3–26.6) -0.8 n.a. n.a. n.a.
2019 USA 52w1 111,262 407,138 27.3 (27.2–27.5) 0 n.a. n.a. n.a.
2019 USA 34w 71,994 266,976 27.0 (26.8–27.1) -0.3 n.a. n.a. n.a.
2020 USA 34w 70,212 212,297 33.1 (32.9–33.3) 5.8 37.0 9.74 April 7th
n.a.: not applicable. W: weeks. Standardized = (value- 27.3), the reference 2019 USA 52w value. 1Used as the reference population for the baseline mean apolipoprotein value.
2In the APHP-PSL cohort, the proportion of low apolipoprotein-A1 in 2020 was 80.0% on the first peak, that is 52.7% greater than the reference control proportion, 27.3%, in 2019.
3In the French cohort, the proportion of low apolipoprotein-A1 in 2020 was 40.0% on the first peak, that is 12.7% greater than the reference control proportion, 27.3%,
in 2019.
4In the US cohort, the proportion of low apolipoprotein-A1 in 2020 was 37.0% on the first peak, that is 9.7% greater than the reference proportion, 27.3%, in 2019.
Temporal associations between apolipoprotein-A1 and spread of Covid-19
in serum-cohorts
The daily mean number of confirmed Covid-19 cases paralleled the daily proportion of low apolipoprotein-A1, about 10 days after. In USA, the first ten Covid-cases were declared
mid-Fig 3. Decrease of apolipoprotein-A1 by gender and age in US cohort. The same significant kinetics were observed, P<0.001 between 2020
and previous years.
https://doi.org/10.1371/journal.pone.0242306.g003
Fig 4. Absence of haptoglobin increase in the first 34 weeks of 2020 in the US cohort. Only the French cohorts at
January 2020, when the proportion of low apolipoprotein-A1 had already increased by several percent. A plateau around 34% of low apolipoprotein-A1 was reached on March 21st that is two weeks before the plateau of confirmed Covid-19 daily cases around 40,000 reached on April 7th (Fig 5,Table 2).
In France, the first ten Covid-cases were declared first week of March 2020, when the pro-portion of low apolipoprotein-A1 started to increase by several percent (Fig 2). The first peak of cases (n = 7,000) was reached mid-April, as well as the first peak of low apolipoprotein-A1 (40.0%) on April 14th(Fig 2). Details are given inS2A Fig.
Characteristics of Covid-19 patients included in the sensitivity and
prognostic assessment of apolipoprotein-A1 performances
A total of 136 consecutive patients with severe Covid-19, but who did not require ICU were included. Their characteristics were similar to those published in such severity profiles (Table 3,S3 File).
Specificity in general population: Specificity-cohorts
The characteristics of patients included in the five specificity-cohorts are presented inTable 4, the median value of apolipoprotein at inclusion inFig 6andTable 5and for haptoglobin inFig 7andTable 6.
The area under the characteristics curve (AUROC;95%CI) in 136 Covid-19 cases and 7,481 core controls was 0.979 (0.959–0.989), which outperformed haptoglobin and liver function tests (Fig 8andTable 7). Apolipoprotein-A1 at a cutoff of 1.25 g/L, had the best Youden index (86.7%) with a sensitivity of 90.6% (84.2–95.1) and a specificity of 96.1% (95.7–96.6) for the diagnosis of Covid-19.
Primary diagnostic endpoint. 136 Covid-19 cases and 7,481 healthy volunteers’ controls. Apolipoprotein-A1 at the 1.25 g/L cutoff, had a sensitivity of 90.6% (95%CI 84.2–95.1) and a specificity of 96.1% (95.7–96.6) for the diagnostic of Covid-19.
Fig 5. Number of confirmed Covid-19 cases per day and proportion of low (<1.25g/L) apolipoprotein-A1 in the US cohort during the first 34 weeks of 2020. The red graph is the number of confirmed cases per day in logarithmic scale. The black line is the daily mean
proportion of low apolipoprotein-A1 (<1.25g/L; blue line;95%CI in grey).
Table 3. Characteristics of Covid-19 patients of the prospective study. Characteristics COVID-19 diagnostic
PCR positive PCR negative Adjudicated P value Total
Number n (%) 117 (100%) 19 (100%) 136
Median age (IQR) year 72 (57–82) 65.1 (49–74) 0.15 72 (59–83)
Age category 0.16 <50 year 14 (12.0) 5 (26.4) 19 (14.0) 50 to <70 year 37 (31.6) 7 (36.8) 44 (32.3) > = 70 year 66 (56.4) 7 (36.8) 73 (53.7) Male sex 66 (56.4) 12 (63.2) 0.58 78 (57.4) Geographic origin 0.53 Caucasian 67 (57.3) 14 (73.7) 81 (59.6) Subsaharan 17 (14.5) 1 (5.3) 18 (13.2)
North African, Middle East 20 (17.1) 2 (10.5) 22 (16.9)
Asian 13 (11.1) 2 (10.5) 15 (11.0)
Oxygen-support category 0.75
Invasive oxygen support 0 0 0 (0–0)
Noninvasive oxygen support 82 (70.1) 14 (73.7) 96 (70.6)
None 35 (29.9) 5 (26.3) 40 (29.4) Coexisting conditions Hypertension 65 (55.6) 9 (47.4) 0.51 74 (54.4) Diabetes 32 (27.4) 3 (15.8) 0.29 35 (25.7) Hyperlipidemia 32 (27.4) 7 (36.8) 0.40 39 (28.7) Liver disease 11 (9.4) 4 (21.1) 0.13 15 (11.03) Pulmonary disease 13 (11.6) 1 (5.6) 0.44 14 (10.8)
Severe disease associated 64 (55.2) 11(57.9) 0.82 75 (55.6)
Tobacco (ongoing or stopped) 35 (29.9) 8 (42.1.3) 0.29 43 (31.6)
Alcohol consumption 15 (12.9) 5 (26.3) 0.13 20 (14.8) Initial presentation Anosmia (13 missing) 12 (11.1) 3 (20.0) 0.32 15 (12.2) Ageusia (13 missing) 16 (14.8) 3 (20.0) 0.60 19 (15.5) Headache (13 missing) 10 (9.3) 4 (26.7) 0.05 14 (11.4) Dyspnea (12 missing) 59 (54.1) 8 (53.3) 0.95 67 (54.0) Wheezing (12 missing) 3 (2.75) 0 (0.00) 0.52 3 (2.42)
Cough without spitting (12 missing) 47 (43.1) 6 (40.0) 0.82 53 (42.7)
Cough with spitting (12 missing) 18 (16.5) 2 (13.3) 0.75 20 (16.1)
Fatigue 61 (56.5) 8 (53.3) 0.82 69 (59.1)
Time clinic-inclusion (days) 8 (5–13.8) 11 (9–16.5) 0.13 9 (5–14)
Followup (days) 38 (27–53) 28 (26–36) 0.05 32 (27–49)
BMI (Kg/m2) 25 (23–29) 24 (22–28) 0.56 25 (23–28)
Apolipoprotein < = 1.25g/L 104 (88.9) 19 (100) 0.13 123 (90.4)
Median laboratory (IQR)
Apolipoprotein-A1 g/liter 0.85 (0.73–1.06) 0.74 (0.61–0.87) 0.06 0.84 (0.70–1.03)
Haptoglobin g/liter 3.16 (2.20–4.19) 3.18 (1.59–3.86) 0.59 3.16 (2.22–4.08)
Alpha-2 macroglobulin g/liter 1.49 (1.24–2.06) 1.46 (1.12–2.01) 0.41 1.49 (1.22–2.05)
GGT IU per liter 47 (28–114) 58 (32–102) 0.27 49 (30–114)
ALT IU per liter 29 (20–47) 40 (15–57) 0.80 31 (20–51)
Total bilirubin micromol/L 7 (6–8) 9 (8–13) 0.01 8 (5–12)
Platelets 106per ml 211 (162–278) 279 (194–330) 0.06 221 (164–287)
For a prevalence of 1.8% (136/7617;1.5–2.1) of Covid-19 cases, the positive predictive value was 30.0% (25.6–34.7) and the negative predictive value was 99.8% (99.7–99.9).
The adjusted predictive values according to prevalence predicted in the French population [16], were detailed inS2 File. The specificity-sensitivity including blood donors were detailed inS9A Fig, including patients with rheumatological disease inS9B Fig, and including all the integrated six databases inS9C Fig.
During the study period, in the same department 43 patients without suspected Covid-19 were excluded (S3 Table). These patients were admitted for mixed severe diseases during the pandemic, and therefore could not be used to assess the specificity of apolipoprotein-A1 in the context of use of an early detection test in the general population.
Table 3. (Continued)
Characteristics COVID-19 diagnostic
PCR positive PCR negative Adjudicated P value Total
Creatinineμmol per liter 78 (62–103) 78 (70–120) 0.97 78 (63–103)
Fasting glucose 6 (5.4–8.0) 6.6 (5.2–7.9) 0.38 6.1 (5.4–7.9)
Albumin g/L (18 missing) 31(27–33) 29 (27–39) 0.89 30 (27–33)
Procalcitonin (17 missing) 0.13 (0.08–0.27) 0.14 (0.09–0.23) 0.98 0.13 (0.09–0.27)
C-reactive protein (13 missing) 56 (20.3–95.6) 101 (15.4–252.9) 0.21 59 (20.3–102.3)
InterLeukin-6 (38 missing) 31 (13.5–55.2) 29 (8.05–119) 0.96 31 (12.3–55.5) CPK (18 missing) 101 (51.5–243.3) 47.5 (37.5–127) 0.05 94 (45.8–233) AST (11 missing) 44 (30–60) 34 (25–42) 0.04 41 (30–59) LDH (16 missing) 347 (278–419) 353 (289–440) 0.68 347 (278–420) D-dimer (24 missing) 1050 (550–2030) 1570 (1140–3980) 0.09 1125 (570–2158) Troponin (14 missing) 16.4 (9.85–34.63) 17.2 (9.56–36.5) 0.99 16.4 (9.85–34.63)
Prothrombin time (16 missing) 92 (83–100) 82 (39–89) 0.005 90 (81–100)
White cells
Neutrophil missing (14 missing) 4185 (2773–6145) 5945 (3963–7550) 0.05 4420 (2928–6200)
Eosinophil (12 missing) 0 (0–30) 10 (0–150) 0.14 0.05 (0–30)
Lymphocyte (14 missing) 965 (670–1235) 1150 (798–1700) 0.25 975 (685–1295)
Hemoglobin g/L (12 missing) 12 (11.2–13.6) 12 (10.5–14.7) 0.64 12 (11.1–13.8)
Treatment at risk of DILI
Paracetamol oral (2–4 g/day) 43 (36.8) 5 (26.3) 0.38 48 (35.3)
Antibiotics 91 (77.8) 15 (78.9) 0.91 106 (77.9) None 26 (22.2) 4 (21.1) 30 (22.1) Without clavulinate 49 (41.9) 5 (26.3) 54 (39.7) Whit clavulinate 68 (58.1) 14 (73.7) 82 (60.3) Steroids 12 (10.3) 1 (5.3) 0.49 13 (9.56) Hydroxy chloroquine 47 (40.1) 6 (31.6) 0.48 53 (39.0)
Total deaths at 4 weeks 14 (12.0) 2 (10.5) 0.86 16 (11.8)
No transfer to intensive care unit 98 (83.8) 18 (94.7) 0.21 116 (85.3)
No death 88 (75.3) 17 (89.5) 105 (77.2)
Death 10 (8.5) 1 (5.2) 11 (8.1)
Transfer to intensive care 19 (16.2) 1 (5.2) 20 (14.7)
No death 15 (12.8) 0 (0) 15 (11.0)
Death 4 (3.4) 1 (5.2) 5 (3.7)
Patients with diarrhea
The prevalence of diarrhea on initial presentation was 29 out of 131 cases (22.1%;95%CI 15.4– 30.2). In this subset, the only significant difference was a lower median number of polynuclear leucocytes (S4 Table,S2 File).
Prognostic values of apolipoprotein-A1 in Covid-19 patients
The prognostic value of apolipoprotein-A1 at inclusion for predicting the primary outcome was significant, risk-ratio (RR;95%CI) = 5.61 (1.02–31.0; P = 0.04), adjusted on age (1.04;1.01– 1.07; P = 0.04), GGT (2.88;1.01–8.19; P = 0.04). The 71 patients with apolipoprotein-A1 value> = 0.84 g/L, the median value at inclusion, had a significant higher survival without ICU (93.0%;87.0–98.9) than the 65 patients with lower value (75.8%; 65.1–86.5; P = 0.02) (Fig 9).
Kinetics of apolipoprotein-A1 and haptoglobin in Covid-19 patients
Repeated assessments of 256 sera among 136 patients showed the low level of apolipoprotein-A1 at baseline, and thereafter the significant increase already at 10 days in patients who sur-vived without ICU (Fig 10), as well as in the 16 patients who survived after their transfer to ICU (Fig 11). Similarly, the mean haptoglobin decreased also significantly in these survivors (Figs12and13).Discussion
Our study shows that apolipoprotein-A1 displayed a highly significant decrease in 2020 vs pre-vious years, and a highly significant negative daily time-related association with the number of Covid-19 cases. Apolipoprotein-A1 decrease had a high sensitivity in prospective hospitalized
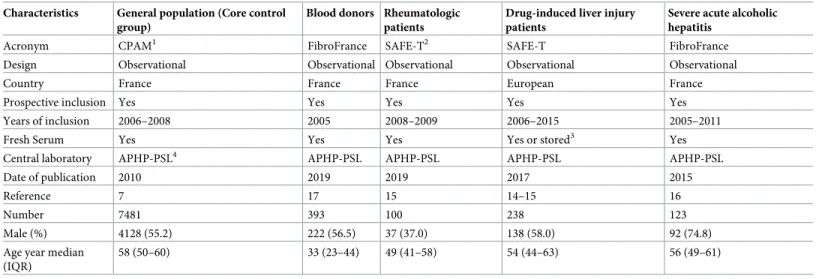
Table 4. Baseline demographic and clinical characteristics of the 8,335 non-Covid-19 patients included for to test specificity in five “specificity cohorts” control groups.
Characteristics General population (Core control group)
Blood donors Rheumatologic patients
Drug-induced liver injury patients
Severe acute alcoholic hepatitis
Acronym CPAM1 FibroFrance SAFE-T2 SAFE-T FibroFrance
Design Observational Observational Observational Observational Observational
Country France France France European France
Prospective inclusion Yes Yes Yes Yes Yes
Years of inclusion 2006–2008 2005 2008–2009 2006–2015 2005–2011
Fresh Serum Yes Yes Yes Yes or stored3 Yes
Central laboratory APHP-PSL4 APHP-PSL APHP-PSL APHP-PSL APHP-PSL
Date of publication 2010 2019 2019 2017 2015
Reference 7 17 15 14–15 16
Number 7481 393 100 238 123
Male (%) 4128 (55.2) 222 (56.5) 37 (37.0) 138 (58.0) 92 (74.8)
Age year median (IQR)
58 (50–60) 33 (23–44) 49 (41–58) 54 (44–63) 56 (49–61)
1CPAM: Caisse Primaire Assurance Maladie.
2SAFET: Safer and Faster Evidence-Based Translation Consortium.
3Among 238 patients, tests were analyzed on fresh serum for 177 samples, and were assessed, were analyzed on frozen samples stored at minus 80 degree Celsius for less than 2 years for 61 samples.
4
APHP-PSL: Assistance Publique Hopitaux de Paris Pitie´-Salpêtrière.
patients, with a high specificity in retrospective controls, and an independent prognostic value for the survival without transfer to ICU. These results have certain strengths and limitations (Table 8).
Decrease of apolipoprotein-A1 in serum-cohorts
The decrease in apolipoprotein-A1 during the peak of the pandemic in April was not so sur-prising, as very low levels of HDL-cholesterol were already known in severe pneumonia since 1920 (S1 Table) [2]. More intriguing was the very early decrease observed since January 2020
Fig 6. Apolipoprotein A1 median with IQR between the 6 populations. CPAM: general population assessing specificity of
apolipoprotein-A1 in the sentinel context of use. Three populations were used for assessing higher risk of false positive: severe acute alcoholic hepatitis (ASH), drug induced liver disease (DILI), and rheumatologic disease (RHE). The blood donors population (BD) was at lower risk of false positive.
in the USA when the number of Covid-19 cases was unknown. The first known Covid-19 patient was detected on 27/12/2019 and 19/01/2020 in France and the USA, respectively (S3 File). The larger sample size of the US surveillance population, compared to the French, allowed detection of a significant 1% increase in the proportion of subjects possibly infected using the 1.25 g/L cutoff in January (Fig 2), without any inflammatory signal as assessed by haptoglobin. We hypothesized that the SARS-CoV2 virus influenced the liver or intestinal syn-thesis of apolipoprotein-A1, in asymptomatic patients or in those with unusual mild
symptoms.
Indeed, there was a highly significant decrease in ApoA1 parallel (2 weeks before) to the confirmed Covid-19 cases. This decrease started few weeks before the incidence of confirmed cases, suggesting that apolipoprotein-A1 detected infected cases. Furthermore, the liver func-tion biomarkers as well as the haptoglobin did not change so early.
Confounding factors in serum-cohorts
The decrease in apolipoprotein-A1 in 2020vs. previous years, as well as the time-related associ-ation of apolipoprotein-A1 in 2020 and Covid-19 might be due to numerous confounding fac-tors. We acknowledge that consecutive sera were analyzed anonymously and therefore there was an unknown percentage of duplicated subjects with repeated sample over time. Since the database is anonymous, we don’t know how frequently individuals were measured, as well as the average sample per person in a year. However, the routine of surveillance is FibroTest between 12 months to 4 years according to the initial stages. This reduced the risk of repeated samples from the same person. In the context of the pandemic we used cohorts of subjects requiring surveillance of liver fibrosis biomarkers which represent at least 30% of the general adult population in the USA and in France. In these cohorts 70% of the subjects had no or minimal fibrosis. The decrease in apolipoprotein-A1 in 2020 compared to 2019, and 2018 can-not be explained by bias due to gender, age, the cause of liver disease (Table 1,S3 File), or the severity of liver diseases (S4 File). Despite the significant differences in several characteristics,
none was associated with the decrease of apoplipoprotein-A1 in 2020vs. 2019. The changes
were observed both in HCV and NAFLD, after stratification on age and gender (S3 File). The prevalence of severe cases cannot explain the significant decrease in apolipoprotein-A1 already observed in January 2020. GGT a very sensitive liver biomarkers did not change during the first 3 months (S6 Fig). Finally, in these severe liver diseases, haptoglobin should also be signif-icantly decreased, which was not the case (Fig 4).
Table 5. Apolipoprotein-A1 median with IQR between the 6 populations.
Population Count Median ApoA1 g/L Dunnets’ test differences (P<0.05) CPAM: social security general population1 7,481 1.67 ASH, DILI, Covid, RHE, BD
BD: blood donors2 393 1.59 ASH, DILI, Covid, CPAM
RHE: rheumatology patients2 100 1.58 ASH, DILI, Covid, CPAM
Covid-193 136 0.84 ASH, DILI, RHE, CPAM, BD
DILI: drug induced liver disease2 238 0.49 ASH, Covid, RHE, CPAM, BD
ASH: severe acute alcoholic hepatitis2 123 0.31 DILI, Covid, RHE, CPAM, BD
Total 8,471 1.64 Not applicable
1
Core population for assessing the specificity (1-% false positive) of apolipoprotein-A1 (ApoA1).
2
Other population for assessing the specificity (1-% false positive) of apolipoprotein-A1 (ApoA1).
3
Core population for assessing the sensitivity of apolipoprotein-A1 (ApoA1).
In the US-cohort the proportion of serum with NAFLD was increased by 2% in 2020 (20.0%) vs 2019 (18.1%Table 1). However, after stratification for age and gender, no signifi-cant changes were observed for all other biomarkers (S8 Fig). ALT was the only biomarker of the liver tests which increased significantly at the 13thweek of 2020, above the usual mean value observed in 2019 (S7 Fig). This increase in ALT was not associated with any other changes (S8 Fig). We have no clear explanation. We hypothesize that another confounding fac-tor could be a non-severe DILI, including oral acetaminophen or hydroxychloroquine misuse during the pandemic. Such factor could explain an increase in ALT, without increase in hapto-globin, in subjects with mild symptoms.
The absence of haptoglobin change (Fig 4) associated with the linear apolipoprotein-A1 decrease (Fig 1), has never been described before. It was known that in patients with severe
Fig 7. Haptoglobin median with IQR between the 6 populations.
fibrosis these two proteins decrease [10]. It was also known that in severe pneumonia the haptoglobin increase was associated to the apolipoprotein-A1 decrease (S1 Table), as we observed in the cohorts with high prevalence of severe Covid-19. The 34 weeks followup per-mitted to see the return to normal values of haptoglobin in these cohorts, associated with the decrease of severe Covid-19 cases admissions (Fig 4). Furthermore, the recovering patients followed by repeated serum in the prospective study, had both a significant increase of apoli-poprotein-A1 (Figs10and11) and a significant decrease in haptoglobin 10 days after inclu-sion (Figs12and13).
Temporal associations between apolipoprotein-A1 and spread of Covid-19
in serum-cohorts
Our results (Table 2, standardized proportion of low apolipoprotein-A1) suggest that the spread of the pandemic in the US-cohort would be around 5.8%, and 4.0% in the
Table 6. Haptoglobin median with IQR between the 6 populations.
Population Count Median Hapto g/L Dunnets’ test differences (P<0.05) CPAM: social security general population1 7,481 1.10 ASH, DILI, Covid, RHE, BD
BD: blood donors2 393 0.90 ASH, DILI, Covid, RHE, CPAM
RHE: rheumatology patients2 100 1.27 ASH, DILI, Covid, BD, CPAM
Covid-193 136 3.17 ASH, DILI, RHE, CPAM, BD
DILI: drug induced liver disease2 238 0.37 ASH, Covid, RHE, CPAM, BD
ASH: severe acute alcoholic hepatitis2 123 0.12 DILI, Covid, RHE, CPAM, BD
Total 8,471 1.08 Not applicable
1
Core population for assessing the specificity (1-% false positive) of apolipoprotein-A1 (ApoA1).
2
Other population for assessing the specificity (1-% false positive) of apolipoprotein-A1 (ApoA1).
3
Core population for assessing the sensitivity of apolipoprotein-A1 (ApoA1).
https://doi.org/10.1371/journal.pone.0242306.t006
Fig 8. Area under the ROC curves (AUROC) of each FibroTest components.
French-cohort. In France, this estimate does not differ from the recent French model that pre-dicted a rate of infection between 2.8% to 7.2% in the general population [18].
This temporal association of low apolipoprotein-A1 with the number of confirmed cases, persisted in the two different pandemic changes. In France, after the national lockdown the proportion of low apolipoprotein-A1 returned to the cohort usual 2018–2019 values in June together with the dramatic regression of confirmed cases, still maintained in July. In the US,
Table 7. Area under the ROC curves (AUROC) of each FibroTest components.
Criterion Count AUROC Standard Error P-Value vs ApoA1 Lower 95%CI Upper 95%CI
ApoA1 negative 7617 0.979 0.007 NA 0.959 0.989 Haptoglobin 7617 0.938 0.014 0.007 0.903 0.961 GGT 7617 0.540 0.029 <0.001 0.481 0.595 A2M 7617 0.759 0.021 <0.001 0.715 0.796 Bilirubin negative 7617 0.712 0.028 <0.001 0.654 0.762 ALT 7617 0.637 0.028 <0.001 0.579 0.688 AGE 7617 0.760 0.028 <0.001 0.700 0.810 https://doi.org/10.1371/journal.pone.0242306.t007
Fig 9. Survival without transfer to intensive care unit (ICU). The 71 patients with apolipoprotein-A1 value > = 0.84 g/L, the median
value at inclusion, had a significant higher survival without ICU (93.0%;87.0–98.9) than the 65 patients with lower value (75.8%;65.1–86.5; P = 0.02).
the apolipoprotein A1 and confirmed cases had the same kinetics with the dramatic increase in April and a plateau in June, still ongoing in August 2020 (Fig 5).
Sensitivity of apolipoprotein-A1 in Covid-19 patients
There is a high risk of overestimating both the sensitivity and specificity of a test in Covid-19 when the participants enrolled in the studies might not be representative of targeted popula-tions [1]. It was difficult to confirm the sensitivity for asymptomatic infection, due to the absence of validations of SARS-CoV2-antibodies. To validate the sensitivity of apolipoprotein-A1, a large number of asymptomatic “apparently healthy” subjects who are positive for
Fig 10. Serum apolipoprotein-A1 prospective 256 repeated measurements in 104 patients with Covid-19, who survived without transfer to intensive care unit. The median range interval between the first and the last serum was 11 days (IQR 8–16). Significant
differences between ranks P<0.01 by Tukey-Kramer multiple-comparison test between first serum (0.92 g/L) vs third (0.98 g/L) and fourth sera (1.05).
SARS-CoV-2 viral nucleic acid testing is needed. Our patients included with Covid-19 symp-toms had a median of 70 years of age and were severe enough to justify admission to hospital, but none of them required mechanical ventilation at admission, 86% survived, only 14.7% were transferred to the intensive care unit, and 11.8% died (Table 3). The sensitivity in the pro-spective part of our study was similar in the 19 patients who were negative for viral nucleic acid testing (94.7%) to that in positive patients (89.9%). Thus, a simple measurement of apoli-poprotein-A1 could be useful for clinicians due to the high percentage of false negatives in available viral nucleic acid testing [19]. Apolipoprotein-A1 or HDL-cholesterol are already being assessed in many large ongoing studies in patients with chronic diseases, which could rapidly validate our results.
Specificity in general population: Specificity-cohorts
Our previous cohorts of patients with severe liver diseases allowed us to identify the major risks of a significant decrease in apolipoprotein-A1 (false positives), mainly due to severe hepatic insufficiency and severe fibrosis. An impact of malnutrition on apolipoprotein-A1 val-ues, was excluded as no significant changes in weight were observed. The controls not-exposed to SARS-Cov2 in the general population (CPAM) was prospective, but with possible limita-tions as not being contemporaneous (Table 8).
Prognostic values of apolipoprotein-A1 in Covid-19 patients
The univariate prognostic value of apolipoprotein-A1 was confirmed (Fig 9) but to our knowl-edge, it was the first time that its prognostic value persisted after adjustment by age, a marker
Fig 11. Serum apolipoprotein-A1 prospective 30 repeated measurements in 16 patients with Covid-19, who were transferred to intensive care unit and survived. The median interval between the four serum was 11 days (IQR 8–16).
Significant differences between ranks P<0.01 by Tukey-Kramer multiple-comparison test between first sera (0.75 g/L) vs third (0.98 g/L) and fourth sera (1.25 g/L).
of acute inflammation (haptoglobin), a sensitive marker of liver injury (GGT), and a marker of liver fibrosis (A2M).
Temporal association in Covid-19 patients
Among patients with recovery, there was a significant increase of apolipoprotein-A1 10 days after admission. Therefore, apolipoprotein-A1 measurement could help for the decision to transfer to ICU independently of other prognostic factors such as age and haptoglobin.
Furthermore, this kinetics of apolipoprotein-A1, a decrease during the hospitalization and an increase to usual reference values during recovery of Covid-19 cases is a strong argument
Fig 12. Serum haptoglobin prospective 256 repeated measurements in 104 patients with Covid-19, who survived without transfer to intensive care unit. The median range interval between the first and the last serum was 11 days (IQR 8–16). Significant difference between
ranks P<0.01 by Tukey-Kramer multiple-comparison test between first sera (3.13 g/L) vs fourth sera (2.50 g/L.
for a causal interpretation of the temporal association observed also prospectively in the French cohort. The ongoing followup in the US cohort could permit to validate this normaliza-tion of apolipoprotein-A1.
Similarly, the mean haptoglobin decreased also significantly in these
survivors
Mechanisms of the early decrease in apolipoprotein-A1 before recognition of the pan-demic. We never observed such profile of biomarkers in our experience since 2001 with more than three million of FibroTest assessed in liver diseases (S1 File) [10,12–17].
Although several mechanisms explaining the decrease in apolipoprotein-A1 in late severe Covid-19 pneumonia are known (S1 Table), the reason for the early decrease before the acute phase, when haptoglobin remained normal is unclear. In patients with severe pneumonia, apo-lipoprotein-A1 decrease was associated with acute inflammation and the “cytokine storm” with an increase in IL6 and acute phase proteins such as CRP and haptoglobin. This dissocia-tion suggests that different mechanisms play a role in the early influence of the SARS-CoV2 virus on the synthesis of apolipoprotein-A1, and the intestine could be more involved than the liver.
The SARS-CoV2 virus could impact several pathways leading to a decrease in the intestinal synthesis and absorption of apolipoprotein-A1 in the small intestine resulting in the decrease in serum [3–9]. These mechanisms are discussed inS1 File. The first could be the inhibition of lysophosphatidylcholine-acyltransferase-3 activity. There is evidence of direct SARS-CoV2 infection of the endothelial cell and diffuse endothelial inflammation in the intestine [7–9]. SARS-CoV2 uses angiotensin-converting enzyme-2 receptor (ACE-2) expressed on
Fig 13. Serum haptoglobin 30 repeated measurements in 16 patients with Covid-19, who survived among those transferred to intensive care unit. The median range interval between the first and the last serum was 11 days (IQR
8–16). Significant differences between ranks P<0.01 by Tukey-Kramer multiple-comparison test between first sera (3.13 g/L) vs third sera (2.53 g/L).
endothelial cells, to infect the host, widely expressed in the lung, intestine and liver [9,20]. The second mechanism could be an impact of the virus through the intestinal mucus [21]. Apolipo-protein-A1 is released as a free apolipoprotein from the apical side of enterocytes into the lumen in the fasting state. Apolipoprotein-A1 had faster turnover in mucus, which could be a target for SARS-CoV2 [7,8,21].
Conclusion
Despite the limitations of this study, these results suggest that apolipoprotein-A1 could be a component of multi-analyte Covid-19 population markers, but also diagnostic tests in individ-ual patients at risk, and prognostic tests in individindivid-ual Covid-19 patients. This ubiquitary pro-tein seems useful in less symptomatic carriers of SARS-CoV2 as very early biomarker but also in patients with severe Covid-19 patients as an independent prognostic marker. It could also
Table 8. Summary of the characteristics, interest and limitations of core populations.
Characteristics 2020 US possibly exposed to SARS-Cov2 Controls not exposed to SARS-Cov2 Covid-19 patients
Acronym US serum-cohort CPAM ProCop EIT health
Number N = 212,297 N = 7,481 N = 136
Context of use Liver fibrosis surveillance General French population 45 years of age and older
Design Serum consecutive database Prospective study published in 2010 Prospective contemporaneous study Test assessment Fresh serum US laboratories Fresh serum Centralized reference
APHP-PSL laboratory
Fresh serum Centralized reference APHP-PSL laboratory
Statistical interest Large ongoing surveillance Specificity of test, lowest risk of bias than severe controls
Sensitivity and prognostic values of test, before ICU
Limitations Not representative of US population, no SARS-Cov2 direct marker
Not contemporaneous Small sample size but no asymptomatic carrier
Median age (IQR) 54.1 (40.5–63.4) 58 (50–60)) 72 (59–83)
Age category n (%) < 50 year 87,473 (41.2) 1,864 (24.9) 19 (14.0) 50 to <70 year 102,797 (48.4) 5,159 (69.0) 44 (32.3) > = 70 year 22,027 (10.4) 458 (6.1) 73 (53.7) Male sex (%) 119,227 (56.2) 4,128 (55.2) 78 (57.4) Apolipoprotein-A1<1.25g/L (%) 70,212 (33.1;32.9–33.3) 263 (3.5;3.1–4.0) 123 (90.4;84.2–94.8) Median laboratory (IQR)
Apolipoprotein-A1 g/L 1.36 (1.18–1.57) 1.67 (1.49–1.87) 0.84 (0.70–1.03)
Haptoglobin g/L 1.23 (0.82–1.68) 1.10 (0.81–1.42) 3.16 (2.22–4.08)
Alpha-2-macroglobulin g/L 2.15 (1.64–2.92) 1.46 (1.24–1.74) 1.49 (1.22–2.05)
GGT IU/L 37 (21–78) 24 (17–38) 49 (30–114)
ALT IU/L 38 (22–69) 23 (18–32) 31 (20–51)
Total bilirubin micromol/L 6.84 (5.13–10.26) 10 (9–14) 8 (5–12)
Fibrosis stage by FibroTest (%) F0 < = 0.27 108,925(51.3;51.1–51.5) 6521 (87.2;86.4–87.9) 66 (48.5;39.9–57.2) F1 < = 0.48 42,667 (20.1;19.9–20.3) 810 (10.8;10.1–11.6) 36 (26.5;19.0-.34.7) F2 < = 0.58 15,467 (7.3;7.2–7.4) 78 (1.0;0.8–1.3) 15 (11.0;6.3–17.5) F3 < = 0.68 20,847 (9.8;9.7–9.9) 48 (0.6;0.5–0.8) 13 (9.6;5.2–15.8) F4 < = 0.74 22,886 (10.8;10.6–10.9) 24 (0.3;0.2–0.5) 6 (4.4;1.6–9.4) Non interpretable 1,505 (0.7;0.7–0.7) 0 (0.0) 0 (0.0) Missing 0 (0.0) 0 (0.0) 0 (0.0) https://doi.org/10.1371/journal.pone.0242306.t008
help to manage patients with a clinical suspicion of Covid-19 and a negative virological test. These results must be validated in independent cohorts, ideally with virologic and efficiency endpoints. The role of SARS-CoV2 in the possible “asymptomatic” decrease in apoliprotein-A1 could be related to intestinal infection without or before overt pulmonary disease. Finally, one hundred years after surrogate sentinel HDL-cholesterol for pneumonia [2], apolipopro-tein-A1 for the second time in a century, could be “one of the early warning systems that alert the world to potential outbreaks” [22].
Supporting information
S1 File. Mechanisms of the early decrease in apolipoprotein-A1 before recognition of the pandemic, liver or intestine.
(DOCX) S2 File. Methods. (DOCX) S3 File. Results. (DOCX) S4 File. Discussion. (DOCX)
S1 Table. Review of the articles validating the prognostic value of apolipoprotein-A1, hap-toglobin, and HDL-cholesterol for overall mortality, in severe sepsis and liver diseases. (DOCX)
S2 Table. Comorbidity with liver disease and liver dysfunction in patients with Covid-19. (DOCX)
S3 Table. Baseline demographic and clinical characteristics of the 43 patients pre-included during the same period, who were not considered to have Covid-19 by consensus, and not included in the prospective observational study.
(DOCX)
S4 Table. Baseline demographic and clinical characteristics of the patients Covid-19 included in the prospective observational study, according to initial diarrhea. (DOCX)
S1 Fig. Prognostic value of HDL cholesterol, a surrogate of apolipoprotein-A1. A. Prognos-tic value of HDL cholesterol, a surrogate of apolipoprotein-A1 (meta-analysis from Liu 2020). B. Prognostic value of HDL cholesterol, a surrogate of apolipoprotein-A1 (from Cirstea 2017). (DOCX)
S2 Fig. Daily number of confirmed Covid-19 cases between January 1stto August 20th, 2020. A. Number of confirmed covid-19 cases in France. B. Number of confirmed covid-19 cases in USA. C. Variability in the daily number of sera analyzed from January-August 20th 2020 (red bars and line with 95% confidence interval) compared to from January-August 20th 2019 (blue) in the APHP-PSL hospital, (upper panel), in the French cohort (upper panel) and in the US cohort (lower panel). The variability is expressed as the processing of tests (ratio between daily numbers) in 2020 vs 2019.
(DOCX)
S3 Fig. Serum apolipoprotein ApoA1 variability. A. Serum apolipoprotein ApoA1 variability during covid-19 spread versus the same days in 2019–2018 in the APHP-PSL hospital, French
and US cohorts, by gender. B. Serum apolipoprotein ApoA1 variability during covid-19 spread versus the same days in 2019–2018 in the APHP-PSL hospital, French and US cohorts, by age. C. Serum apolipoprotein ApoA1 variability during covid-19 spread versus the same days in 2019–18 in the US cohort, by age and gender, in patients with chronic hepatitis C. D. Serum apolipoprotein ApoA1 variability during covid-19 spread versus the same days in 2019–18 in the US cohort, by age and gender, in patients with non-alcoholic fatty liver disease (NAFLD). (DOCX)
S4 Fig. Serum haptoglobin variability. A. Serum haptoglobin variability during covid-19 spread versus the same days in 2019–2018 in the US cohort, by age<55 years versus > = 55 years and gender. B. Serum haptoglobin variability during covid-19 spread versus the same days in 2019–2018 in the US cohort, in NAFLD, by gender and by age <55 years versus > = 55 years. C. Serum haptoglobin variability during covid-19 spread versus the same days in 2019– 2018 in the US cohort, in HCV, by gender and by age <55 years versus > = 55 years.
(DOCX)
S5 Fig. Serum alpha-2 macroglobulin variability. A. Serum alpha-2 macroglobulin variability during covid-19 spread versus 2019 same days in APHP-PSL hospital, French cohort and US cohort. B. Serum alpha-2 macroglobulin variability during covid-19 spread versus the same days in 2019 in the US cohort, by gender and by age <55 years versus > = 55 years. C. Serum alpha-2 macroglobulin variability during covid-19 spread versus the same days in 2019 in the US cohort, by gender and by age <55 years versus > = 55 years. In NAFLD serum only. D. Serum alpha-2 macroglobulin variability during covid-19 spread versus the same days in 2019 in the US cohort, by gender and by age <55 years versus > = 55 years. In HCV serum only. (DOCX)
S6 Fig. Serum GGT variability. A. Serum GGT variability during covid-19 spread versus the same days in 2019 in the APHP-PSL hospital, French and US cohorts. B. Serum GGT variabil-ity during covid-19 spread versus the same days in 2019 in the US cohort, by gender, and age <55 years versus > = 55 years.
(DOCX)
S7 Fig. Serum ALT variability. A. Serum ALT variability during covid-19 spread versus the same days in 2019 in the APHP-PSL hospital, French and US cohorts. B. Serum ALT variabil-ity during covid-19 spread versus the same days in 2019 in the US cohort, by gender and age. (DOCX)
S8 Fig. Components without significant changes. A. Serum total bilirubin variability during covid-19 spread versus the same days in 2019 in the APHP-PSL hospital, French and US cohorts. B. Serum total cholesterol variability during covid-19 spread versus the same days in 2019 in the APHP-PSL hospital, French and US cohorts. C. Serum total triglycerides variability during covid-19 spread versus the same days in 2019 in the APHP-PSL hospital, French and US cohorts. D. Serum fasting glucose variability during covid-19 spread versus the same days in 2019 in the APHP-PSL hospital, French and US cohorts. E. Height variability during covid-19 spread versus the same days in 20covid-19 in the APHP-PSL hospital, French and US cohorts. F. Weight variability during covid-19 spread versus the same days in 2019 in the APHP-PSL hos-pital, French and US cohorts.
(DOCX)
S9 Fig. Sensitivity analysis of ROC curves. A. Diagnostic performance of apolipoprotein-A1 for the diagnosis of covid-19 in 136 covid-19 cases and 393 healthy blood donors, preva-lence = 26%. B. Diagnostic performance of apolipoprotein-A1 for the diagnosis of covid-19 in
136 covid-19 cases and 100 patients with rheumatological diseases, prevalence = 58%. C. Diag-nostic performance of apolipoprotein-A1 for the diagnosis of covid-19 in 136 covid-19 cases and 8,335controls (Integrated database, prevalence 1.6%).
(DOCX)
Author Contributions
Conceptualization: Thierry Poynard, Olivier Deckmyn, Patrice Cacoub.
Data curation: Thierry Poynard, Olivier Deckmyn, Marika Rudler, Valentina Peta, Yen Ngo, Mathieu Vautier, Sepideh Akhavan, Vincent Calvez, Fabienne Drane, Mehdi Sakka, Domi-nique Bonnefont-Rousselot, Jean Marc Lacorte, David Saadoun, Yves Allenbach, Frederi-que Gandjbakhch, Julien Mayaux, Olivier Lucidarme, Bruno Fautrel, Patrice Cacoub. Formal analysis: Thierry Poynard, Olivier Deckmyn, Valentina Peta, Yen Ngo, Sepideh
Akha-van, Mehdi Sakka, Olivier Benveniste, Olivier Lucidarme, Patrice Cacoub. Funding acquisition: Thierry Poynard, Clemence Franc, Patrice Cacoub.
Investigation: Thierry Poynard, Marika Rudler, Valentina Peta, Yen Ngo, Mathieu Vautier, Sepideh Akhavan, Vincent Calvez, Clemence Franc, Fabienne Drane, Mehdi Sakka, Domi-nique Bonnefont-Rousselot, David Saadoun, Yves Allenbach, Olivier Benveniste, Frederi-que Gandjbakhch, Julien Mayaux, Olivier Lucidarme, Bruno Fautrel, Vlad Ratziu, Dominique Thabut, Patrice Cacoub.
Methodology: Thierry Poynard, Olivier Deckmyn, Clemence Franc.
Project administration: Thierry Poynard, Jean Marie Castille, Fabienne Drane, Dominique Bonnefont-Rousselot, Jean Marc Lacorte, Bruno Fautrel, Chantal Housset, Dominique Tha-but, Patrice Cacoub.
Resources: Thierry Poynard, Olivier Deckmyn, Mathieu Vautier, Sepideh Akhavan, Mehdi Sakka, David Saadoun, Yves Allenbach, Olivier Benveniste, Frederique Gandjbakhch, Julien Mayaux, Vlad Ratziu, Chantal Housset, Dominique Thabut, Patrice Cacoub.
Software: Thierry Poynard, Olivier Deckmyn.
Supervision: Thierry Poynard, Jean Marie Castille, Jean Marc Lacorte, Vlad Ratziu, Chantal Housset, Dominique Thabut, Patrice Cacoub.
Validation: Thierry Poynard, Olivier Deckmyn, Marika Rudler, Mathieu Vautier, Sepideh Akhavan, Chantal Housset, Dominique Thabut, Patrice Cacoub.
Visualization: Thierry Poynard, Olivier Deckmyn, Jean Marie Castille, Patrice Cacoub. Writing – original draft: Thierry Poynard, Olivier Deckmyn, Patrice Cacoub.
Writing – review & editing: Thierry Poynard, Olivier Deckmyn, Valentina Peta, Clemence Franc, Chantal Housset, Patrice Cacoub.
References
1. Wynants L, Van Calster B, Collins G, Riley RD, Heinze G, Schuit E, et al. Prediction models for diagno-sis and prognodiagno-sis of Covid-19 infection: systematic review and critical appraisal. BMJ. 2020; 369: m1328.https://doi.org/10.1136/bmj.m1328PMID:32265220
2. Kipp HA. Variation in the cholesterol content of the serum in pneumonia. J Biol Chem. 1920; 44:215– 237.