HAL Id: hal-03185690
https://hal.inrae.fr/hal-03185690
Submitted on 16 Jun 2021
HAL is a multi-disciplinary open access
archive for the deposit and dissemination of
sci-entific research documents, whether they are
pub-lished or not. The documents may come from
teaching and research institutions in France or
abroad, or from public or private research centers.
L’archive ouverte pluridisciplinaire HAL, est
destinée au dépôt et à la diffusion de documents
scientifiques de niveau recherche, publiés ou non,
émanant des établissements d’enseignement et de
recherche français ou étrangers, des laboratoires
publics ou privés.
Mitochondrial metabolism supports resistance to IDH
mutant inhibitors in acute myeloid leukemia
Lucille Stuani, Marie Sabatier, Estelle Saland, Guillaume Cognet, Nathalie
Poupin, Claudie Bosc, Florence Castelli, Lara Gales, Evgenia Turtoi, Camille
Montersino, et al.
To cite this version:
Lucille Stuani, Marie Sabatier, Estelle Saland, Guillaume Cognet, Nathalie Poupin, et al..
Mitochon-drial metabolism supports resistance to IDH mutant inhibitors in acute myeloid leukemia. Journal
of Experimental Medicine, Rockefeller University Press, 2021, 218 (5), �10.1084/jem.20200924�.
�hal-03185690�
ARTICLE
Mitochondrial metabolism supports resistance to
IDH mutant inhibitors in acute myeloid leukemia
Lucille Stuani1,2,3, Marie Sabatier1,2,3, Estelle Saland1,2,3, Guillaume Cognet1,2,3, Nathalie Poupin4, Claudie Bosc1,2,3, Florence A. Castelli5,
Lara Gales6,7, Evgenia Turtoi8,9, Camille Montersino10, Thomas Farge1,2,3, Emeline Boet1,2,3, Nicolas Broin1,2,3, Cl´ement Larrue1,2,3,
Natalia Baran11, Madi Y. Ciss´e8, Marc Conti12,13, Sylvain Loric12, Tony Kaoma14, Alexis Hucteau1,2,3, Aliki Zavoriti1,2,3,
Ambrine Sahal1,2,3, Pierre-Luc Mouchel1,2,3,15, Mathilde Gotanègre1,2,3, C´edric Cassan16, Laurent Fernando4, Feng Wang11,
Mohsen Hosseini1,2,3, Emeline Chu-Van5, Laurent Le Cam8, Martin Carroll17, Mary A. Selak17, Norbert Vey10, R´emy Castellano10,
François Fenaille5, Andrei Turtoi8, Guillaume Cazals18, Pierre Bories19, Yves Gibon16, Brandon Nicolay20, S´ebastien Ronseaux20,
Joseph R. Marszalek11, Koichi Takahashi11, Courtney D. DiNardo11, Marina Konopleva11, V´era Pancaldi1,21, Yves Collette10,
Floriant Bellvert6,7, Fabien Jourdan4,7, Laetitia K. Linares8, Christian R´echer1,2,3,15, Jean-Charles Portais6,7,22, and Jean-Emmanuel Sarry1,2,3,23
Mutations in IDH induce epigenetic and transcriptional reprogramming, differentiation bias, and susceptibility to
mitochondrial inhibitors in cancer cells. Here, we first show that cell lines, PDXs, and patients with acute myeloid leukemia
(AML) harboring an IDH mutation displayed an enhanced mitochondrial oxidative metabolism. Along with an increase in TCA
cycle intermediates, this AML-specific metabolic behavior mechanistically occurred through the increase in electron transport
chain complex I activity, mitochondrial respiration, and methylation-driven CEBP
α-induced fatty acid β-oxidation of IDH1 mutant
cells. While IDH1 mutant inhibitor reduced 2-HG oncometabolite and CEBP
α methylation, it failed to reverse FAO and OxPHOS.
These mitochondrial activities were maintained through the inhibition of Akt and enhanced activation of peroxisome
proliferator-activated receptor-
γ coactivator-1 PGC1α upon IDH1 mutant inhibitor. Accordingly, OxPHOS inhibitors improved
anti-AML efficacy of IDH mutant inhibitors in vivo. This work provides a scientific rationale for combinatory
mitochondrial-targeted therapies to treat IDH mutant AML patients, especially those unresponsive to or relapsing from IDH mutant inhibitors.
Introduction
Changes in intermediary and energy metabolism provide the flexibility for cancer cells to adapt their metabolism to meet energetic and biosynthetic requirements for proliferation (Boroughs and DeBerardinis, 2015; Vander Heiden and DeBerardinis, 2017). Manipulating glycolysis, glutaminolysis,
fatty acid β-oxidation (FAO), or oxidative phosphorylation (OxPHOS) markedly reduces cell growth in vitro and in vivo and sensitizes acute myeloid leukemia (AML) cells to drugs (Samudio et al., 2010;ˇSkrti´c et al., 2011;Scotland et al., 2013;
Matre et al., 2016;Farge et al., 2017;Sharon et al., 2019). The
...
1Centre de Recherches en Canc´erologie de Toulouse, Universit´e de Toulouse, Institut National de la Sant´e et de la Recherch´e M´edicale, Centre National de la Recherche
Scientifique, Toulouse, France; 2LabEx Toucan, Toulouse, France; 3Equipe Labellis´ee Ligue Nationale Contre le Cancer 2018, Toulouse, France; 4UMR1331 Toxalim,
Universit´e de Toulouse, Institut National de la Recherche pour l’Agriculture, l’Alimentation et l’Environnement, Ecole Nationale V´et´erinaire de Toulouse, INP-Purpan, Universit´e Paul Sabatier, Toulouse, France; 5CEA/DSV/iBiTec-S/SPI, Laboratoire d’Etude du M´etabolisme des M´edicaments, MetaboHUB-Paris, Gif-sur-Yvette, France; 6Toulouse Biotechnology Institute, Universit´e de Toulouse, Centre National de la Recherche Scientifique, Institut National de la Recherche Agronomique, Institut National
des sciences appliqu´ees, Toulouse, France; 7MetaToul-MetaboHUB, National Infrastructure of Metabolomics and Fluxomics, Toulouse, France; 8Institut de Recherche en
Canc´erologie de Montpellier, Institut National de la Sant´e et de la Recherch´e M´edicale, Universit´e de Montpellier, Institut R´egional du Cancer Montpellier, Montpellier, France; 9Montpellier Alliance for Metabolomics and Metabolism Analysis, Platform for Translational Oncometabolomics, Biocampus, Centre National de la Recherche
Scientifique, Institut National de la Sant´e et de la Recherch´e M´edicale, Universit´e de Montpellier, Montpellier, France; 10Aix-Marseille University, Institut National de la
Sant´e et de la Recherch´e M´edicale, Centre National de la Recherche Scientifique, Institut Paoli-Calmettes, Centre de Recherches en Canc´erologie de Marseille, Marseille, France; 11Departments of Leukemia and Genomic Medicine, The University of Texas, MD Anderson Cancer Center, Houston, TX; 12Institut National de la Sant´e et de la
Recherch´e M´edicale U938, Hˆopital St Antoine, Paris, France; 13Integracell, Longjumeau, France; 14Proteome and Genome Research Unit, Department of Oncology,
Luxembourg Institute of Health, Strassen, Luxembourg; 15Service d’H´ematologie, Institut Universitaire du Cancer de Toulouse-Oncopole, CHU de Toulouse, Toulouse,
France; 16UMR1332 Biologie du Fruit et Pathologie, Plateforme M´etabolome Bordeaux, Institut National de la Recherche Agronomique, Universit´e de Bordeaux, Villenave
d’Ornon, France; 17Division of Hematology and Oncology, Department of Medicine, University of Pennsylvania, Philadelphia, PA; 18Laboratoire de Mesures Physiques,
Universit´e de Montpellier, Montpellier, France; 19R´eseau R´egional de Canc´erologie Onco-Occitanie, Toulouse, France; 20Agios Pharmaceuticals, Cambridge, MA; 21Barcelona Supercomputing Center, Barcelona, Spain; 22STROMALab, Universit´e de Toulouse, Institut National de la Sant´e et de la Recherch´e M´edicale U1031, EFS,
INP-ENVT, UPS, Toulouse, France; 23Centre Hospitalier Universitaire de Toulouse, Toulouse, France.
Correspondence to Lucille Stuani:lucille.stuani@inserm.fr; Jean-Emmanuel Sarry:jean-emmanuel.sarry@inserm.fr.
© 2021 Stuani et al. This article is distributed under the terms of an Attribution–Noncommercial–Share Alike–No Mirror Sites license for the first six months after the publication date (seehttp://www.rupress.org/terms/). After six months it is available under a Creative Commons License (Attribution–Noncommercial–Share Alike 4.0 International license, as described athttps://creativecommons.org/licenses/by-nc-sa/4.0/).
importance of the metabolic reprogramming in this disease is further illustrated by recurrent mutations in the genes of two crucial metabolic enzymes, isocitrate dehydrogenases (IDH) 1 and 2, present in >15% of AML patients. Most of these mu-tations are at arginine (R) residues at codon 132 for IDH1 (IDH1 R132) and at 140 and 172 for IDH2 (IDH2 R140 and IDH2 R172;
Mardis et al., 2009;Marcucci et al., 2010;Papaemmanuil et al., 2016).
The impact of IDH mutation and the related accumulation of the oncometabolite (R)-2-hydroxyglutarate (2-HG) have been well documented in leukemic transformation and AML biology (Figueroa et al., 2010;Sasaki et al., 2012;Losman et al., 2013;Kats et al., 2014;Inoue et al., 2016;Elkashef et al., 2017;Jiang et al., 2017;Turcan et al., 2018). As IDH mutations are early events in oncogenesis and are systematically conserved at relapse ( Corces-Zimmerman and Majeti, 2014; Shlush et al., 2014; Ok et al., 2019), IDH1/2 mutated enzymes represent attractive therapeu-tic targets, and small molecules specifically inhibiting the mu-tated forms of these enzymes have been developed (Rohle et al., 2013;Wang et al., 2013;Okoye-Okafor et al., 2015;Yen et al., 2017;Stein et al., 2017;DiNardo et al., 2018;Pollyea et al., 2019;
Stein et al., 2019;Chaturvedi et al., 2020). Both IDH2m and
IDH1minhibitors promote differentiation and reduce DNA and
histone methylation levels as well as significantly decrease 2-HG concentration (Rohle et al., 2013;Yen et al., 2017;Stein et al., 2017). Overall response rates for ivosidenib (IDH1 mutant in-hibitor; IDH1mi) and enasidenib (IDH2m
i) are highly encouraging
with up to 30% or 40% in monotherapy in phase 1/2 clinical trials for newly diagnosed or relapsed/refractory AML patients, respectively (Stein et al., 2017;DiNardo et al., 2018;Pollyea et al., 2019;Roboz et al., 2020). These results led to the US Food and Drug Administration approvals of enasidenib in August 2017 and ivosidenib in July 2018 for relapsed or refractory adult AML patients with IDH mutation. However, several mechanisms of resistance to these targeted therapies have already been iden-tified (Amatangelo et al., 2017;DiNardo et al., 2018,2015;Stein et al., 2017;Pollyea et al., 2019;Choe et al., 2020). Many non-responders also displayed a significant decrease in the amount of 2-HG, suggesting that alternative mechanisms may compensate for 2-HG to drive tumor progression (DiNardo et al., 2015;Stein et al., 2017;Amatangelo et al., 2017;Stein et al., 2019;Harding et al., 2018;Wang et al., 2020Preprint). Notably, clonal hetero-geneity, second-site mutation, or multiple pathways involved in signaling, especially RAS signaling, have recently been shown to be responsible for relapse in patients treated with IDHmi
(DiNardo et al., 2018;Intlekofer et al., 2018;Quek et al., 2018;
Harding et al., 2018;Choe et al., 2020;Wang et al., 2020 Pre-print). These observations suggest that targeting IDH mutant (IDHm) activity is not sufficient to achieve a durable clinical
response in most patients and that new combinatory approaches need to be designed.
Given the crucial roles of WT IDH1/2 in cell metabolism (e.g., Krebs cycle, OxPHOS, cytosolic and mitochondrial redox, and anabolism including lipid biosynthesis) and in human disease, a better understanding of the contribution of oncogenic IDH mutations to metabolism and metabolic homeostasis is expected to lead to new therapeutic strategies. Several studies have
demonstrated that IDHm cancer cells exhibit some metabolic
specificities, in particular related to redox homeostasis through nicotinamide adenine dinucleotide (phosphate) NAD(P)+
avail-ability (Tateishi et al., 2015;Hollinshead et al., 2018; Gelman et al., 2018;Mugoni et al., 2019). However, none of these stud-ies have definitively shown how metabolic changes elicited by IDH mutations modulate cell proliferation and drug resistance or impact therapeutic response in AML. In particular, the role of metabolism in resistance to IDHmi has not yet been
compre-hensively studied in AML. Although existing literature in the field described several vulnerabilities to mitochondrial in-hibitors in IDH1/2 mutant cells from solid tumors and AML (Grassian et al., 2014;Izquierdo-Garcia et al., 2014;Cuy`as et al., 2015;Matre et al., 2016;Chan et al., 2015;Baccelli et al., 2019), no studies have demonstrated why IDHmcells are more sensitive to
mitochondrial inhibitors in AML. We therefore hypothesized that mitochondrial OxPHOS plays a crucial role in IDHmbiology
and in the response of AML patients with IDH mutation to IDHmi.
In the present study, we performed multi-omics and func-tional approaches using two engineered AML cell lines (HL60 and MOLM14), 10 patient-derived xenografts (PDXs) models from two clinical sites (Toulouse University Hospital [TUH] and University of Pennsylvania [UPENN]), and 111 patient samples from three clinical sites (TUH, Institut Paoli-Calmettes [IPC], and MD Anderson Cancer Center [MDACC]) to test this hy-pothesis and to expressly understand the mitochondrial re-programming induced by IDH1 mutation and its role in the response to IDHmi. We uncovered that mitochondrial oxidative
metabolism is enhanced in IDHmcells in vitro and in vivo. This
AML-specific metabolic behavior mechanistically occurred through the increase in methylation-driven CEBPα-induced FAO of IDH1mcells. Furthermore, IDH1mi that reduced 2-HG
onco-metabolite and CEBPα methylation failed to reverse FAO and OxPHOS. This was due to the enhanced activation of peroxisome proliferator-activated receptor-γ coactivator-1 (PGC1α) upon IDH1mi. Accordingly, OxPHOS inhibitors improved anti-AML
efficacy of IDHmi in vivo.
Results
A higher susceptibility of IDH1mAML cells to mitochondrial
inhibitors is due to their enhanced OxPHOS activity
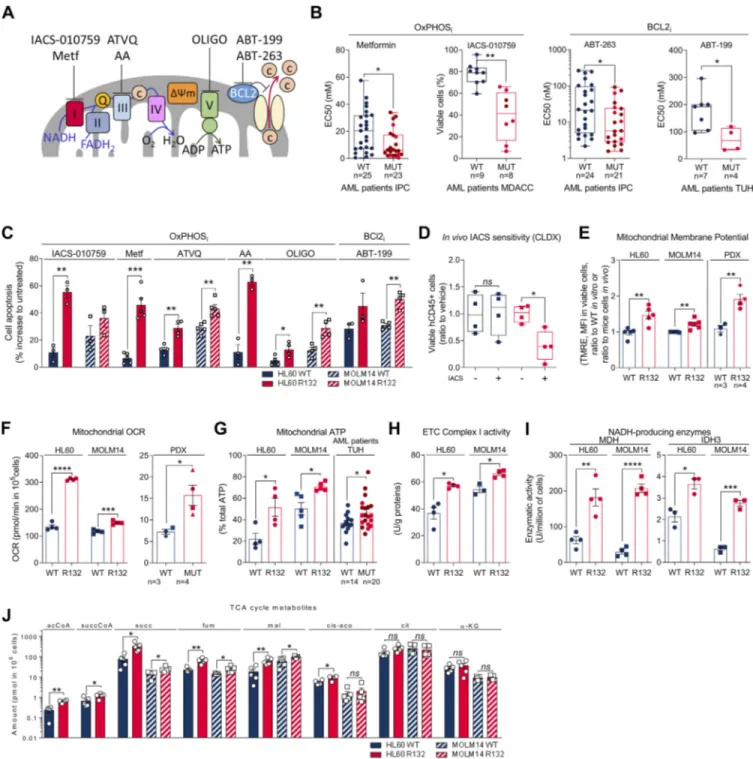
First, we confirmed a higher sensitivity of IDH1/2 mutant cells from primary AML patient samples (WT, n = 41; MUT, n = 36; TUH, IPC, MDACC; Table S1) and two genetically diverse cell lines (Fig. S1, A–C) to mitochondrial inhibitors, including in-hibitors of electron transport chain (ETC) complex I (IACS-010759;
Molina et al., 2018; metformin), ETC complex III (antimycin A [AA]; atovaquone [ATVQ]), ETC complex V (oligomycin), and BCL2 (ABT-199, ABT-263; Fig. 1, A–C; andFig. S1 D). We also showed this result in vivo in NOD/LtSz-SCID/IL-2Rγchainnull (NSG)–immunodeficient mice xenografted with IDH1 WT and R132 mutant MOLM14 cells and then treated with IACS-010759 for 2 wk at 1.5 mg/kg/d (Fig. S1 E). Of note, this ETC complex I inhibitor induced an increased level of lactate in the serum of both IDH1 WT and R132 xenografted mice, confirming the
Figure 1. IDH1mcells exhibit a higher sensitivity to OxPHOSi and BCL2i due to their enhanced mitochondrial capabilities and OxPHOS activity in
AML. (A) Schematic representation of the ETC and BCL2 with OXPHOSi and BCL2i used in this study. Metf, metformin. (B) Plots of effective half-maximal concentration (EC50) values from ATP viability assays of metformin and ABT-263 after 48 h, from Annexin V–positive cell assays of ABT-199 after 24 h and percentage of viable cells after 72 h of IACS-010759 in primary samples with WT or mutant (MUT) IDH1 (red circles) or IDH2 (burgundy circles). See also Table S1 for patient information. (C) Apoptosis induction following IACS-010759 (100 nM during 48 h for HL60 and during 6 d for MOLM14;n = 3), 48 h metformin (10 mM;n = 5), AA (10 µM; n = 3), ATVQ (20 µM for HL60; n = 4 and 40 µM for MOLM14; n = 5), oligomycin (OLIGO; 2 µM; n = 4), and ABT-199 (200 nM; n = 3 for HL60 andn = 4 for MOLM14) in HL60 and MOLM14 IDH1 WT or R132H. (D) Total number of human viable AML cells expressing CD45 in vehicle compared with IACS-treated MOLM14 IDH1 WT and R132 mice in bone marrow and spleen (n = 5/group). (E) Assessment of MMP using TMRE assay in HL60 and MOLM14 IDH1 WT or R132H measured in vitro (n = 5, independent experiments) and in vivo in PDXs (three patients IDH1 WT and four patients IDH1 MUT). See also Table S1 for patient information. (F) Mitochondrial OCR of HL60 and MOLM14 IDH1 WT or R132H measured in vitro (n = 4, independent experiments) and ex vivo in PDXs after cell sorting (three patients IDH1 WT and four patients IDH1 MUT). See also Table S1 for patient information. Each point is the mean of three technical replicates. (G) Mitochondrial ATP in HL60 (n = 4) and MOLM14 (n = 5) IDH1 WT and R132H and in patients with IDH WT (n = 14) or MUT IDH1 (red circles) or IDH2 (burgundy circles;n = 21). See also Table S1 for patient information. Each point is the mean of three technical replicates. (H) Mitochondrial ETC complex I activity in HL60 and MOLM14 IDH1 WT and R132H (n ≥ 4). (I) NADH-producing enzyme activities of MDH (n = 4) and IDH3 (n = 3) in HL60 and MOLM14 IDH1 WT and R132H. (J) Acetyl-CoA (acCoA), succinyl-CoA (succCoA), succinate (succ), fumarate (fum), malate (mal), cis-aconitate (cis-aco), citrate (cit), andα-KG amounts measured over 24-h culture in HL60 and MOLM14 IDH1 WT and R132H (n ≥ 4). Each point is the mean of two technical replicates. For
systemic biological activity of this type of inhibitor (e.g., meta-bolic shift toward glycolysis with lactic acidosis or Pasteur effect;
Fig. S1 E). However, only mice engrafted with IDH1 R132H cells showed a significant reduction in the total cell tumor burden following IACS treatment in vivo (Fig. 1 D).
To better understand why IDH1mcells have a higher
sensi-tivity to mitochondrial inhibition, we extensively analyzed several biochemical, enzymatic, and functional features relative to mitochondrial metabolism in IDHmversus WT AML cells from
two genetically diverse AML cell lines in vitro, 10 PDXs in vivo (Fig. S1 F), and 33 primary AML samples ex vivo. Mitochondrial membrane potential (MMP), basal- and ATP-linked oxygen consumption rate (OCR), and ATP content were all significantly enhanced in IDHmAML cells in vitro and in vivo (Fig. 1, E–G; and Fig. S1, G–I). Hence, since extracellular acidification rate (ECAR), mainly associated with lactate production rate through glycol-ysis, remained unaffected (Fig. S1 J), the cellular energetic bal-ance was also significantly increased in IDH1mAML cells (Fig. S1 K). Importantly, ETC complex I (and not other ETC com-plexes) activity, NADH-producing enzyme activity of tricar-boxylic acid cycle (TCA) enzymes such as malate dehydrogenase (MDH2) and IDH3, and concentrations of Krebs cycle inter-mediates (except citrate andα-KG) were also enhanced in IDH1m
(Fig. 1, H–J; andFig. S1, L–N), indicating an increase in mito-chondrial NADH availability, mitomito-chondrial activities, and Ox-PHOS dependency, specifically in IDH1mAML cells. Interestingly,
this was not due to an increase in mitochondrial biogenesis as shown by unaffected mitochondrial mass, citrate synthase activity, protein expression of ETC complexes, or ratio be-tween mitochondrial and nucleic DNA (Fig. S1, O–R). Of note, another HL60 clone expressing less IDH1 R132 mutation and producing less 2-HG (Boutzen et al., 2016;Fig. S1 A; clone 5) recapitulated this higher mitochondrial inhibitor sensitivity and enhanced OxPHOS phenotype to a lower extent (Fig. S1). This reinforces the link between IDH1 mutation and increased mitochondrial capabilities.
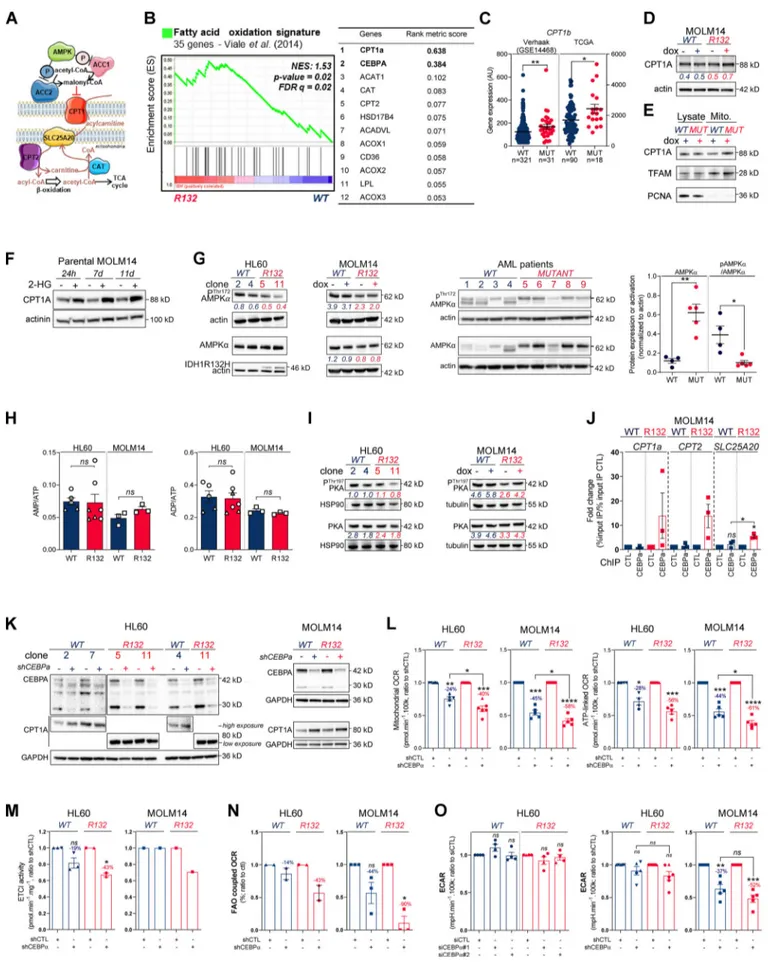
Methylation- and CEBPα-dependent mitochondrial FAO is increased in IDH1mcells
To further understand how mitochondrial reprogramming is induced by IDH1 mutation, we next performed a computational analysis of the metabolic network of IDH1mcells based on
hu-man genome scale metabolic network reconstruction Recon2 (7,440 metabolic reactions;Thiele et al., 2013). To reconstruct active leukemic metabolic networks of IDH1 WT and mutant AML cells at a global level, we integrated transcriptomic data and proliferation rates and applied metabolic constraints (Jerby et al., 2010;Poupin et al., 2018;Fig. 2 A). This analysis identified a significant enrichment of active reactions in various carbon metabolic pathways (N-glycan synthesis, fructose and mannose metabolism, and dicarboxylate metabolism;Fig. 2 A) in IDH1m
cells. This further uncovered a major change in FAO in these cells (Fig. 2, A and B), especially CPT1a, CPT2, and SLC25A20, which mediate the transport of acyl-carnitines of different length from the cytosol to the mitochondrial matrix to initiate the process of FAO (Fig. S2 A). Accordingly, FAO rate was significantly higher in IDH1mAML cells using14C-palmitate assay (Fig. 2 C).
Furthermore, we performed a gene set enrichment analysis (GSEA) with a curated FAO gene signature (Viale et al., 2014) and found that this signature was enriched in IDH1mAML cells
(Fig. S2 B). The most highly expressed gene in IDH1mcells was
CPT1a, the key component of initiating FA shuttling into mito-chondria. Consistent with this, CPT1a and its isoform CPT1b mRNA levels were also significantly up-regulated in two inde-pendent AML cohorts (Fig. 2 DandFig. S2 C). Moreover, GSEA analysis of the transcriptomes of AML patients with IDH WT, IDH1, or IDH1/2 mutation revealed higher enrichment of FA metabolism and OxPHOS gene signatures in CPT1aHIGHpatients
with IDH mutations compared to IDH WT in two independent cohorts (Fig. 2 E). Furthermore, CPT1A protein was significantly increased in total cell lysates and in mitochondria isolated from IDH1mcells and in IDH1mprimary samples compared with IDH1
WT cells (Fig. 2, F and G; andFig. S2, D and E). Finally, parental HL60 and MOLM14 cell lines as well as HL60 engineered IDH1 WT clones treated with exogenous 2-HG displayed increased levels of CPT1A protein and CPT1a gene expression (Fig. 2 Hand
Fig. S2 F). This strengthens the observation that CPT1a plays a crucial role in FA metabolism and OxPHOS, specifically in 2-HG–producing IDHmAML cells.
The regulation of FAO is complex and involves many dif-ferent signaling pathways and allosteric regulation (Fig. S2 A). We next examined AMP kinase (AMPK), a master regulator of energy and metabolic homeostasis. Surprisingly, whereas the AMPK protein level was increased in IDH1mcell lines and
pa-tients, its activation by phosphorylation was decreased (Fig. S2 G). Furthermore, we did not observe an increase in the AMP/ATP ratio in mutants compared with WT (Fig. S2 H), suggesting that AMP, the primary allosteric activator of AMPK, does not directly activate AMPK in these cells. No increase in ADP/ATP ratio was detected, also suggesting that neither AMP nor ADP enhanced the canonical phosphorylation of AMPK Thr172 via LKB1 (Shackelford and Shaw, 2009) in IDH1mAML
cells (Fig. S2 G). These data showed that AMPK was not activated directly by AMP or via phosphorylation in mutant cells, indi-cating that the changes seen in FAO reflect an AMPK-independent mechanism. Similarly, the protein kinase A (PKA) pathway, another known energy-sensing pathway able to reg-ulate FAO (Lim et al., 2013;Gerhart-Hines et al., 2011), did not appear to be differentially activated and thus is not involved in the observed FAO dysregulation (Fig. S2 I).
We previously demonstrated that IDH1 mutation and its 2-HG product dysregulate CEBPα (Boutzen et al., 2016), a
each panel, HL60 IDH1 WT is represented in blue by circles (clone 4), whereas R132H is represented in red by circles (clone 11). Results with other clones are described inFig. S1. MOLM14 is represented by squares, blue for IDH1 WT and red for IDH1 R132H (both induced by doxycycline). Error bars indicate mean ± SEM of at least three independent experiments. Groups were compared with unpaired two-tailedt test with Welch’s correction. *, P < 0.05; **, P < 0.01; ***, P < 0.001; ****, P < 0.0001.
Figure 2. Methylation- and CEBPα-dependent mitochondrial FAO is increased in IDH1mcells. (A) Comparison of the predicted activity of reactions in the
metabolic network of HL60 IDH1 WT versus R132H cells. Predictions of reaction activity or inactivity were made using the Recon2 metabolic network re-construction and transcriptomic data from HL60 IDH1 WT and R132H. Pathway enrichment was performed on the set of reactions identified as specifically active (red) or specifically inactive (blue) in R132H cells. Corrected P values were obtained by performing a hypergeometric test followed by a Bonferroni correction. (B) Visualization of modulated reactions within the FAO pathway of the Recon2 metabolic network. Reactions predicted to be specifically active (red) or inactive (blue) in R132H using the computational modeling approach were mapped using the MetExplore web server (Chazalviel et al., 2018). (C)14C
palmitate oxidation by HL60 IDH1 WT clone 4 (circle;n = 4) and 2 (triangle; n = 2) and R132H clone 11 (circle; n = 4) and 5 (triangle; n = 2) to assessFAO rate. Each point is the mean of two technical replicates. (D)CPT1a gene expression across AML patient samples from BeatAML (Tyner et al., 2018) and GSE14468 (Verhaak cohort) datasets in function of their IDH1 status. Groups were compared using unpaired nonparametric Mann-Whitney test (*, P < 0.05). (E) Normalized ESs following GSEA analysis of patients with high or low expression of CPT1a (median as the reference) in IDH WT, IDH1m, or IDH1+2 mutant
well-known transcriptional regulator of several genes in-volved not only in myeloid differentiation but also in glucose and lipid metabolism in adipocytes. Moreover, CEBPα was the second-most highly expressed gene of the FAO gene signature in IDH1mcells (Fig. S2 B). Thus, we performed quantitative
chro-matin immunoprecipitation (qChIP) assays to assess CEBPα binding to promoters of genes encoding FA transporters. We observed that the recruitment of endogenous CEBPα to pro-moters of CPT1a, CPT2, and SLC25A20 increased specifically in IDH1mcells (Fig. 2 I and Fig. S2 J). CEBPα silencing with two
different siRNAs or a constitutive shRNA led to a reduction of ETC complex I enzyme activity, mitochondrial basal OCR, mi-tochondrial ATP turnover, and FAO-coupled OCR slightly in IDH1 WT and to a significantly greater extent in IDH1m AML cells
(Fig. 2, J–M; and Fig. S2, K–N), while ECAR remained similar between IDH1 WT and R132H cells (Fig. S2 O). Together, these results indicate that IDH1mAML cells display a gene signature
specific for FA shuttling and a high FAO activity in a CPT1a- and CEBPα-dependent manner driven by 2-HG production that supports mitochondrial activity.
IDHmi reverse 2-HG production but maintain high OxPHOS
phenotype and mitochondrial metabolism
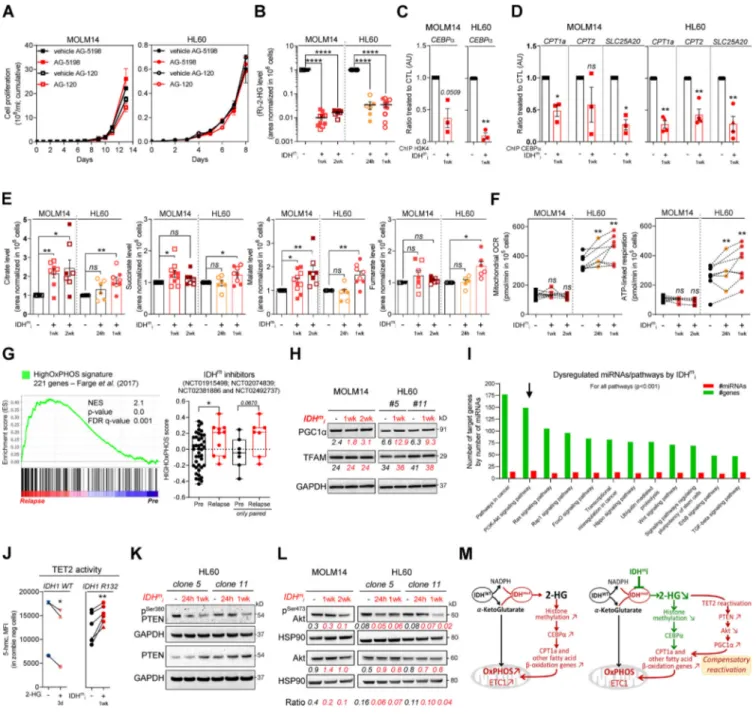
As IDHm cells exhibited higher mitochondrial activity than
WT cells, we investigated the impact of IDHmi (US Food and Drug
Administration–approved ivosidenib AG-120 or its preclinical version AGI-5198 for IDH1 and enasidenib AG-221 for IDH2) on FAO and OxPHOS. First, if we did not observe any change in cell proliferation rates following IDHmi (Fig. 3 A), the level of 2-HG was
significantly reduced as early as 24 h after the beginning of the treatment (Fig. 3 B). Moreover, IDHmi reversed occupancy of the
H3K4me3-activating locus in the CEBPα promoter (Fig. 3 C) that we previously showed was significantly increased in IDH1-R132H mutant HL60 and MOLM14 cells (Boutzen et al., 2016). IDHmi also
prevented the recruitment of endogenous CEBPα to promoter of CPT1a, CPT2, and SLC25A20 (Fig. 3 D). However, neither the cor-responding protein amounts (including in one IDHmAML patient
before enasidenib treatment and at relapse) nor the FAO rate were impacted following treatment with IDH1mi (Fig. S3, A–C).
As FAO is one of the major biochemical pathways that sup-port mitochondrial function and OxPHOS, especially in AML
(Samudio et al., 2010;Farge et al., 2017), we then assessed sev-eral mitochondrial activities upon IDHmi treatment. IDHmi
maintained ETC complex activities or protein amounts (Fig. S3, D and E), MMP, and mitochondrial mass (Fig. S3, F and G). In-terestingly, the amounts of mitochondrial TCA cycle inter-mediates, OCR, and ATP-linked OCR were maintained in MOLM14 IDHmand even increased in HL60 IDHmupon IDHmi
(Fig. 3, E and F). Of particular interest, GSEA of transcriptomic data (Gene Expression Omnibus [GEO] accession no. GSE153348) from four clinical trials conducted in MDACC (NCT01915498, enasidenib for IDH2m patients; NCT02074839, ivosidenib for
IDH1mpatients; NCT02381886, IDH305 for IDH1mpatients; and
NCT02492737, AG-881 for IDH1 or IDH2mpatients;Wang et al., 2020Preprint) showed an enrichment in gene signature asso-ciated with high OxPHOS function (Farge et al., 2017) in 10 pa-tients at relapse compared with 41 papa-tients before IDHmi
treatment (including seven paired specimens;Fig. 3 G). Collec-tively, these results underpin the role of OxPHOS phenotype in the nongenetic mechanism of adaptive resistance to IDHmi.
Since IDHmi reversed 2-HG production and CEBPα-related
FAO features but maintained OxPHOS phenotype, we next sought to identify the compensation that might explain this regulatory shift from CEBPα-dependent CPT1a-driven FAO to allosteric and/or posttranscriptional mechanisms less dependent on transcriptional effects of CEBPα. We analyzed PGC1α, which is a master regulator of mitochondrial biogenesis, OxPHOS, and FA biosynthesis and degradation (Wu et al., 1999;Bhalla et al., 2011). PGC1α protein amount was increased following IDHmi
treatment while mitochondrial transcription factor A (TFAM) remained unaffected (Fig. 3 H). TFAM plays a crucial role in maintaining structure and copy number of mitochondrial DNA (mtDNA) and is therefore critical for efficient transcription of mtDNA genes, including 13 OxPHOS proteins (Virbasius and Scarpulla, 1994; Parisi and Clayton, 1991). PGC1α is dynami-cally regulated by various signaling pathways, transcriptional activators, and posttranslational modifications such as phos-phorylation, deacetylation, acetylation, and methylation.
To gain better insight into PGC1α regulation by IDH1mi, we
first performed transcriptomic analysis of IDH1 R132H HL60 and MOLM14 cells following treatment with IDH1mi. Interestingly,
we found that several microRNAs (miRNAs) and their target
across AML transcriptomes from two independent cohorts, BeatAML and Verhaak (GSE14468). (F) Total lysates of HL60 IDH1 WT and R132H (representative of three independent experiments) and total lysates of primary samples IDH1 WT or MUT were immunoblotted with the indicated antibodies. See also Table S1 for patient information. (G) Total lysates (Lysate) and lysates of purified mitochondria (Mito.) of HL60 IDH1 WT and R132H were immunoblotted with the indicated antibodies (representative of two independent experiments). (H) Total lysates of parental HL60 and HL60 IDH1 WT clones 2 and 7 treated with exogenous 2-HG (100 µM) during 24 h, 7 d, and 11 d were immunoblotted with the indicated antibodies (left panel; representative of two independent ex-periments).CPT1a gene expression in HL60 IDH1 WT clones 2, 4, and 7 treated with exogenous 2-HG (100 µM) during 2 d (Boutzen et al., 2016). (I) qChIP experiments showing the relative recruitment of CEBPα on CPT1a, CPT2, and SLC25A20 locus in mutant IDH1 R132H versus IDH1 WT HL60, as indicated. Results are represented as the relative ratio between the mean value of IP chromatin (calculated as a percentage of the input) with the indicated antibodies and the one obtained with a control irrelevant antibody. HL60 IDH1 WT is represented in blue by circles (clone 4;n = 4) and triangles (clone 2; n = 2), whereas R132H is represented in red by circles (clone 11;n = 4) and triangles (clone 5; n = 2). (J) Total lysates of HL60 IDH1 WT and R132H transfected with siRNA control or targeting CEBPα were immunoblotted to confirm the knockdown and to measure CPT1a protein expression. This confirmation was performed for each siRNA experiment (n = 4). (K) Mitochondrial ETC complex I activity in HL60 IDH1 WT and R132H transfected with siRNA control or targeting CEBPα (n = 4, independent experiments). (L) Mitochondrial OCR and ATP-linked OCR of HL60 IDH1 WT or R132H transfected with siRNA control or targetingCEBPα (n = 4, independent experiments). Each point is the mean of three technical replicates. (M) FAO-coupled OCR of HL60 IDH1 WT or R132H transfected with siRNA control or targetingCEBPα (n ≥ 3, independent experiments). Each point is the mean of three technical replicates. For each panel except D as indicated, groups were compared with unpaired two-tailedt test with Welch’s correction. *, P < 0.05; **, P < 0.01; ****, P < 0.0001. Error bars indicate mean ± SEM. AU, arbitrary units; NES, normalized ES.
Figure 3. IDHmi reverse 2-HG production but do not necessarily decrease high OxPHOS phenotype and mitochondrial metabolism. (A) Cumulative cell
proliferation through time in MOLM14 and HL60 IDH1 R132H treated with vehicle (DMF) or AG-5198 (2 µM) and vehicle (DMSO) or AG-120 (2 µM;n = 4, independent experiments). (B) 2-HG levels normalized to IS measured over 24-h culture in MOLM14 and HL60 IDH1 R132H following 24-h, 1-wk, or 2-wk treatment with AG-5198 (2 µM, plain symbols) or AG-120 (2 µM, empty symbols;n ≥ 3, independent experiments). (C) qChIP experiments showing the relative recruitment of histone H3 trimethylation at lysine 4 (H3K4me3) onCEBPα promoter in MOLM14 and HL60 IDH1 R132H following 1-wk treatment with AG-5198 (2 µM). Results are represented as the relative ratio between the mean value of IP chromatin (calculated as a percentage of the input) with CEBPα antibody and the one obtained with a control irrelevant antibody, normalized to the untreated condition (n = 3, independent experiments). (D) qChIP experiments showing the relative recruitment of CEBPα on CPT1a, CPT2, and SLC25A20 locus in MOLM14 and HL60 IDH1 R132H following 1-wk treatment with AG-5198 (2 µM). Results are represented as the relative ratio between the mean value of IP chromatin (calculated as a percentage of the input) with the indicated antibodies and the one obtained with a control irrelevant antibody, normalized to the untreated condition. HL60 IDH1 R132H is represented by circles (clone 11;n = 3) and triangles (clone 5;n = 1). (E) Citrate, succinate, malate, and fumarate levels normalized to IS measured over 24-h culture in MOLM14 and HL60 IDH1 R132H following 24-h, 1-wk, or 2-wk treatment with AG-5198 (2 µM, plain symbols) or AG-120 (2 µM, empty symbols;n ≥ 3, independent experiments). (F) Mito-chondrial OCR and ATP-linked OCR of MOLM14 and HL60 IDH1 R132H in vehicle (DMF) and after 24-h, 1-wk, or 2-wk treatment with AG-5198 (2 µM;n ≥ 3, independent experiments). (G) GSEA of HighOxPHOS signature (identified byFarge et al., 2017) performed using transcriptomes of patients harboring an IDH mutation included in clinical trials for IDHmi and published (GSE153348) with associated score. (H) Total lysates of MOLM14 and HL60 IDH1 R132H following
1-wk or 2-wk treatment with AG-5198 (2 µM) were immunoblotted with the indicated antibodies relative to mitochondrial regulation. Immunoblot repre-sentative of three independent experiments. (I) Bioinformatics analysis of differentially expressed miRNAs following AG-5198 (2 µM) treatment of HL60 and MOLM14 IDH1mcells for 1 wk. The graph is showing the top KEGG pathways of biological function of the targets of all differentially expressed miRNAs between
untreated and treated cells. This enrichment pathways analysis utilizes the union of targeted genes by the selected miRNAs before the statistical calculation.
signaling pathways were dysregulated by the treatment (Fig. 3 I). Using the DIANA miRPath v.3.0 tool (Vlachos et al., 2012), PI3K-Akt, FoxO, and RAS signaling pathways were enriched and targeted by more than half of miRNAs (11–16 miRNAs) in all of the 16 modulated miRNAs (Table S2). Furthermore, several studies have shown that IDHmcells inhibit TET2 activity in a
2-HG–dependent manner and that loss of TET2 results in reduced PTEN expression and a subsequent hyperactivation of the Akt pathway (Figueroa et al., 2010;Xu et al., 2011;Palam et al., 2018). Accordingly, we found that exogenous 2-HG inhibited TET2 activity in IDH1 WT cells (Fig. 3 J). By contrast, IDHmi reversed
TET2 inhibition, increased total PTEN expression, and decreased inhibitory phosphorylation at Ser380 of PTEN in IDH1m cells
(Fig. 3, J and K). Of note, a prominent repressive phosphoryla-tion at the serine 570 of PGC1α is mediated by PI3K-Akt (Puigserver et al., 2003;Li et al., 2007). PGC1α
immunoprecip-itation (IP) confirmed that PGC1α level was increased after treatment with IDHmi. We further observed that serine
phos-phorylation profiling of PGC1α IP was decreased after IDHmi
treatment, reinforcing the idea that IDHmi decreased the
in-hibitory phosphorylation of PGC1α and maintained OxPHOS metabolism (Fig. S3 H). Moreover, we found that Akt phos-phorylation was decreased upon IDHmi treatment (Fig. 3 L),
resulting in reduced activation of this pathway. Thus, to strengthen the mechanistic link between Akt and PGC1α phos-phorylation, we forced the activation of Akt through short mTOR inhibition with rapamycin after IDHmi (Fig. S3 I) and
performed PGC1α IP (Fig. S3 J). Consistently, IDHmi led to a
decrease in serine-phosphorylation of PGC1α, and rapamycin reversed this effect only after IDH1mi. Importantly, rapamycin
decreased mitochondrial OCR and ATP turnover more signifi-cantly after IDH1mi, supporting that Akt pathway is a key
reg-ulator of PGC1α and OxPHOS activities after IDH1mi (Fig. S3 K).
By contrast, IDHmi treatment did not lead to the activation of
PGC1α via enhanced phosphorylation of PKA, another putative energetic sensor (Fig. S3 L). Altogether, these results showed that, while reducing 2-HG and CEBPα activity, IDHmi restored
TET2 activity and PTEN expression leading to Akt inhibition and reduced PGC1α phosphorylation that favors a transcriptional dependency shift of FAO from CEBPa toward PGC1a to maintain FAO and OxPHOS phenotypes (Fig. 3 M).
Treatment with OxPHOS inhibitors enhances antileukemic effects of IDHmi in vivo
OxPHOS activation upon IDHmi treatment reinforces the
valid-ity of specifically treating these patients with a combination of IDHm and OxPHOS inhibitors. We first assessed this
combination in vitro and in methylcellulose assays using our engineered cell lines and primary samples. We found that IDH1 R132H cell lines pretreated with IDH1mi were significantly
more sensitive to ETC complex I inhibitor metformin in vitro (Fig. S4 A). Furthermore, ETC complex I inhibitor IACS-010759 and ETC complex III inhibitor ATVQ decreased colony-forming ability at a greater and significant extent after IDH1mi
com-pared with nontreated mutant cells (Fig. S4 B). Interestingly, while IDH1mi led to a marked increase in differentiation in both
primary samples harboring the IDH1 mutation as expected (Fig. S4 C), and therefore to more colony-forming units, IACS-010759 and ATVQ treatments significantly decreased the number of colonies only after IDH1mi (Fig. 4 A).
We thus evaluated different single- or duplet-therapeutic approaches in vivo with IDH1mi AG-120 (150 mg/kg, twice
ev-ery day, 3 wk) and ETC complex I inhibitor IACS-010759 (6 mg/kg, every other day, 3 wk) in four IDH1 R132 PDX models (PDXs #325, #1065, #6312, and #TUH110;Fig. 4 BandFig. S4 D). We measured AG-120 concentration in the serum of the mice of the corresponding groups (Fig. 4 C). Total cell tumor burden was significantly reduced in the duplet therapy compared with ve-hicle and single therapies (Fig. 4 DandFig. S4 E). Additionally, spleen size was lower, and we observed an indicative color change in AML cell suspension from bone marrow in mice treated with the duplet therapy (Fig. S4 F). As observed in AML primary cells after IDHmi (Okoye-Okafor et al., 2015;Yen et al., 2017;Chaturvedi et al., 2017), expression of the myeloid differ-entiation marker CD15 was significantly increased by AG-120 monotherapy (Fig. 4 EandFig. S5 A). Addition of IACS-010759 further enhanced CD15 expression (Fig. 4 EandFig. S5 A). In-terestingly, mitochondrial ATP content and respiratory capaci-ties were maintained or even increased after AG-120 alone in vivo, confirming the results obtained in vitro (Fig. S5, B and C). Adding IACS reversed these enhanced OxPHOS capabilities in the duplet therapy in vivo in two PDXs (Fig. S5, B and C). Analysis of mice serum metabolomes showed that aspartate level was significantly reduced in all treated groups, in partic-ular in the ones with IACS, while lactate level was enhanced with IACS treatment, including in the duplet therapy (Fig. 4 F; andFig. S5, D and E). The ETC has been shown to be important in aspartate production required for pyrimidine synthesis and cell proliferation (Birsoy et al., 2015;Sullivan et al., 2015).
Increase in lactate production is a prominent feature of the Pasteur effect (e.g., increased glycolysis in response to the in-hibition of mitochondrial ATP production). Hence, measuring aspartate and lactate levels in patient serum could help monitor the efficacy of their response to IDHmplus OxPHOS inhibitors.
For all these analyses, a P value threshold <0.001 was used. The arrow highlights the pathway of interest in this study (PI3K/Akt). (J) Intensities of 5-OH-methylcytosine staining (median) in HL60 IDH1 WT (circle for clone 4,n = 1; up triangle for clone 2, n = 1; and down triangle for clone 7, n = 1) treated with exogenous 2-HG (100 µM) during 3 d and in HL60 IDH1 R132H (circle for clone 11,n = 5; and triangle for clone 5, n = 1) treated 1 wk with AG-120 (2 µM). (K) Total lysates of HL60 IDH1 R132H following 24-h or 1-wk treatment with AG-120 (2 µM) were immunoblotted with the indicated antibodies. (L) Total lysates of MOLM14 and HL60 IDH1 R132H following 24-h, 1-wk, or 2-wk treatment with AG-5198 (2 µM) were immunoblotted with the indicated antibodies relative to signaling proteins and were quantified. Ratio of phosphorylated to total form of Akt was measured to assess the activation of the pathway. (M) Schematic diagram of metabolic reprogramming induced by IDH1 mutation in AML cells and its impact on OxPHOS status through FAO regulation at the steady state and upon treatment with IDHmi. For each panel, groups were compared with unpaired two-tailedt test with Welch’s correction. *, P < 0.05; **, P <
0.01; ***, P < 0.001; ****, P < 0.0001. Error bars indicate mean ± SEM. AU, arbitrary units; CTL, control; FDR, false discovery rate; NES, normalized ES.
Of note, the duplet therapy did not display higher global (Fig. S5, F and G) and normal murine hematological (Fig. S5 H) toxicities compared with single agents. Collectively, these results not only confirmed that IDHmi does not reverse metabolic and
mito-chondrial features of IDHmAML cells in vivo but also showed
that combining this drug with an ETC complex I inhibitor in-creased drug efficacy in PDX models of AML. Overall, the animal studies demonstrate that the combination of IDHmi and OxPHOS
inhibitor is more efficient than single-agent therapies and en-hances killing of AML cells.
Discussion
Through the production of (R)-2-HG, IDH mutations directly impact histone/DNA methylation and gene expression (Figueroa et al., 2010;Turcan et al., 2018;Guilhamon et al., 2013;Flavahan et al., 2016), cell proliferation, and differentiation bias (Losman et al., 2013;Kats et al., 2014;Boutzen et al., 2016;Lu et al., 2012). Furthermore, several studies have investigated the mitochon-drial phenotype associated with IDHm cells in diverse solid
cancers, and various results were reported, suggesting that ox-idative metabolism driven by IDH mutation largely depends on
the model studied. Notably, it was observed that IDH1 mutation conferred a higher sensitivity to metformin in a transformed mammary epithelial cell line (Cuy`as et al., 2015), resulted in increased oxidative TCA metabolism under hypoxia in HCT116 colon cancer cells (Grassian et al., 2014), and led to enhanced expression of genes involved in mitochondrial structure and function in cholangiocarcinoma (Farshidfar et al., 2017). How-ever, IDH1mglioma cells had reduced ATP content and
respira-tion due to inhibirespira-tion of ATP synthase or hypersuccinylarespira-tion by 2-HG (Fu et al., 2015; Li et al., 2015) and increased NADH-coupled proline biosynthesis, resulting in a‘‘metabolic bypass’’ of ETC complex I (Hollinshead et al., 2018). Although these studies have advanced our understanding of the effect of IDH mutation on mitochondria, mitochondrial metabolism, and phenotype of IDHmcells have remained incomplete, especially in
AML. In the current study, we first showed that IDH1mAML
cells displayed a higher OxPHOS phenotype than WT cells without changes in mitochondrial biogenesis. Interestingly, growing evidence highlights that OxPHOS also is a crucial pro-cess in other AML subgroups, such as FLT3-ITD or EVI1 mutant, through different mechanisms and pathways. The metabolic dependency of FLT3-ITD AML cells for glutamine metabolism
Figure 4. Treatment with an OxPHOS inhibitor enhances antileukemic effects of IDHmi in vivo. (A) Number of colony-forming units following
meth-ylcellulose assays in two primary samples after a 17-d (AML6) and a 27-d incubation (AML5) with the indicated treatments. The numbers of colonies with≥20 cells were counted manually under the microscope. See also Table S1 for patient information. (B) Experimental scheme detailing administration time of IACS-010759 and AG-120 by gavages in PDX models of AML. See also Table S1 for patient information. (C) AG-120 concentration in mice sera of PDXs 325 and 1065. (D) Total number of human viable AML cells expressing CD45 and CD33 in mono or duplet therapies compared with vehicle IDH1 R132 PDXs 325, 1065, 6312, and TUH110 in bone marrow and spleen. Fold change (FC) between the mean of each group and the mean of vehicle was calculated. (E) Intensity of CD15 staining (median) in bone marrow in mono and duplet therapies compared with vehicle-treated IDH1 R132 PDXs 325, 1065, 6312, and TUH110. (F) Aspartate and lactate levels normalized to control group in mice sera of IDH1 R132 PDXs 325 and 1065. For C–F, groups were compared with vehicle (no bracket) or other groups (corresponding brackets) with unpaired two-tailedt test with Welch’s correction. *, P < 0.05; **, P < 0.01; ***, P < 0.001; ****, P < 0.0001. Error bars indicate mean ± SEM. ctl, control.
supports mitochondrial and redox functions (Gallipoli et al., 2018; Alvarez-Calderon et al., 2015; Gregory et al., 2018). In EVI1 mutant AML cells, mitochondrial function was specifically driven by the creatine kinase pathway (Fenouille et al., 2017). Altogether, our findings confirm a marked ETC complex I de-pendency of AML cells (Scotland et al., 2013;Farge et al., 2017;
Molina et al., 2018;Baccelli et al., 2019) and uncover the crucial role of OxPHOS in the AML subgroup with IDH mutations. Ac-cordingly, IDHmAML cells exhibited enhanced vulnerabilities to
various small molecules targeting mitochondrial OxPHOS, such as inhibitors of ETC complexes I, III, and V. As described in the literature (Chan et al., 2015; Konopleva et al., 2016;Bisaillon et al., 2020), we also observed that IDHmAML cells were more
sensitive to other types of mitochondrial inhibitor, such as ABT-199.
Consistent with the OxPHOS hyperactivation, we further demonstrated that FAO and CPT1a expression were increased in IDH1mAML cells in a CEBPα-dependent manner. Interestingly,
treatment of IDH WT AML cells with 2-HG also increased CPT1a expression. However, while IDHmi systematically abrogated
2-HG production, it maintained or even increased mitochondrial activities (including TCA cycle, OxPHOS capacities) in IDHm
AML cell lines and primary patients in vitro and in vivo. Tran-scriptomic data of AML patient cells harboring IDH mutations obtained from clinical trials for the assessment of IDHmi
(NCT01915498, NCT02074839, NCT02381886, and NCT02492737) showed a significant increase in OxPHOS gene signature at relapse. This implies that the maintenance of mitochondrial activities could be a major nongenetic mechanism of adaptive resistance to this targeted therapy. Mechanistically, we showed that IDHmi restored TET2 activity and PTEN expression,
in-duced the inactivation of Akt, and preserved PGC1α, resulting in the maintenance of FAO and OxPHOS phenotypes. This suggests that PGC1α expression and Akt phosphorylation might be useful readouts to monitor the response of IDHmi by flow
cytometry in clinics (Scharping et al., 2016). Interestingly, the RAS/MAPK signaling pathway might be activated in non-responding AML patients or at relapse (Amatangelo et al., 2017;
Wang et al., 2020 Preprint; Choe et al., 2020). On the other hand, several studies have shown that mitochondrial metabo-lism is enhanced in RAS-driven cancers and myeloproliferative neoplasm (Viale et al., 2014;Kong et al., 2019). Of note, N-RAS mutant HL60 cells with IDH1 mutation were more OxPHOS inducible upon treatment with IDHmi than RAS WT MOLM14
cells with IDH1 mutation in our study. The RAS signaling pathway was also targeted by the majority of the miRNAs dysregulated by IDHmi. These observations may link genetic
alterations that drive primary therapeutic resistance, RAS signaling, and OxPHOS metabolism, especially in the context of Akt inactivation.
While the small-molecule IDHmi enasidenib (IDH2) and
ivo-sidenib (IDH1) elicit partial responses or complete remission in AML patients,∼60% of patients are nonresponders (Stein et al., 2017;DiNardo et al., 2018;Pollyea et al., 2019;Roboz et al., 2020). In these clinical settings, several resistance mechanisms have been reported, such as the emergence of second-site IDH2 mu-tations preventing the binding of the inhibitor (Intlekofer et al.,
2018;Choe et al., 2020) or IDH isoform switch from cytosolic IDH1 mutation to mitochondrial IDH2 mutation (Harding et al., 2018;Choe et al., 2020;Wang et al., 2020Preprint). Therefore, the development of new combinatory therapies with IDHmi is
required. Considering the increased OxPHOS features of IDHm
AML cells following treatment with IDHmi, we evaluated the
antileukemic activity of combining OxPHOS inhibitor (such as IACS-010759) with IDH1mi. Although IACS as single agent had
limited antileukemic activity, its association with AG-120 im-paired mitochondrial activities, enhanced differentiation, and increased the antileukemic efficacy in PDX models of AML, which may represent a beneficial alternative for AML patients unresponsive to IDHmi.
There are several limitations to our studies that should be taken into consideration. First, the potential toxicity in humans of the duplet combination of a mitochondrial inhibitor with IDHmi should be carefully considered throughout future clinical
development. Second, the experimental design protocol for the animal experiments could be challenged. Indeed, we decided to directly treat the mice with both AG-120 and OxPHOS inhibitors for 3 wk, while different therapeutic designs could be consid-ered, such as induction therapy with AG-120 and IACS, then maintenance with 120 monotherapy or treatment with AG-120, and then consolidation with IACS. Third, differences in the localization of the two enzymes (cytosolic and mitochondrial), in their capabilities to form dimers with the WT counterpart, or in the amount of 2-HG produced could have pronounced effects on the metabolic reprogramming or the mechanisms of response induced by IDHmi. Lastly, Wang et al. very recently found that
AML stemness might be a major driver of primary resistance to IDHmi (Wang et al., 2020Preprint). Thus, a better understanding
of the effects of the combination of OxPHOS inhibitor and IDHmi
on leukemic stem cells would help move this duplet therapy into the clinic.
Finally, our study supports the merit of future clinical trials testing the combination of IDHmi and mitochondrial inhibitors
with cytarabine, azacitidine, venetoclax, or RAS/MAPK inhibitors. Because this proposed therapeutic strategy could overcome dif-ferent newly identified mechanisms of resistance to IDHmi, this
would be especially relevant as alternative therapeutic approaches for the treatment of those patients who are unresponsive to or are relapsing from IDHmi.
Materials and methods
Primary AML samples
Primary AML patient specimens are from four clinical sites (UPENN, Philadelphia, PA; MDACC at University of Texas, Houston; TUH, Toulouse, France; and IPC, Marseille, France).
For TUH, frozen samples of bone marrow or peripheral blood were obtained from patients diagnosed with AML after signed informed consent in accordance with the Declaration of Helsinki and stored at the HIMIP (H´emopathies malignes de l’Inserm en Midi-Pyr´en´ees) collection (BB-0033-00060). According to French law, the HIMIP biobank collection has been declared to the Ministry of Higher Education and Research (DC 2008–307, collection 1 for HIMIP) and a transfer agreement (AC 2008–129)
obtained after approbation by the Comit´e de Protection des Personnes Sud-Ouest et Outremer II (ethical committee). Clin-ical and biologClin-ical annotations of the samples have been declared to the CNIL (Comit´e National Informatique et Libert´es; i.e., Data processing and Liberties National Committee). For the IPC clinical site, ex vivo drug sensitivity was performed on previ-ously frozen (HEMATO-BIO-IPC 2013–015 clinical trial, NCT02320656) or fresh (CEGAL-IPC-2014-012, NCT02619071 clinical trial) mononuclear cell samples from 49 AML patients after informed consent (Table S1). Both trials have been ap-proved by a properly constituted institutional review board (Comit´e de Protection des Personnes) and by the French Na-tional Security Agency of Medicine and Health Products. The samples are subjected to next-generation sequencing to screen for mutations within a selected panel of∼150 actionable genes in AML (i.e., known to be of prognostic value and/or drug-gable). For UPENN, AML samples were obtained from patients diagnosed with AML in accordance with US Common Rules at the Stem Cell and Xenograft Core Facility at the UPENN School of Medicine and with informed consent in accordance with institutional guidelines. Peripheral blood or bone marrow samples were frozen in FCS with 10% DMSO and stored in liquid nitrogen. The percentage of blasts was determined by flow cytometry and morphological characteristics before purification.
Patient TUHIM86 (Fig. 3) relapsed following bone marrow allograft and “3+7” in June 2018, when we collected a blood sample corresponding to the sample before IDHmi. Then,
fol-lowing a temporary authorization for use, the patient was treated with two cycles of Vidaza and five cycles of enasidenib until remission. After two more cycles of enasidenib, the patient relapsed in February 2019, when we collected a blood sample corresponding to the sample after IDHmi.
Mice and mouse xenograft model
Animals were used in accordance with a protocol reviewed and approved by the Institutional Animal Care and Use Committee of R´egion Midi-Pyr´en´ees (France). NSG mice were produced at the Genotoul Anexplo platform at Toulouse, France, using breeders obtained from Charles River Laboratories. Mice were housed in sterile conditions using high-efficiency particulate arrestance filtered microisolators and fed with irradiated food and sterile water.
Mice (6–9 wk old) were sublethally treated with busulfan (20 mg/kg for MOLM14 and 30 mg/kg for PDXs) 24 h before injection of leukemic cells. Leukemia samples were thawed at room temperature, washed twice in PBS, and suspended in Hank’s Balanced Salt Solution at a final concentration of 0.2–10 × 106 cells for PDXs and 2 × 10⁶ for cell line–derived xenograft
(CLDX) per 200 µl of Hank’s Balanced Salt Solution per mouse for tail vein injection. Transplanted mice were treated with antibiotic (Baytril) for the duration of the experiment for PDXs. Daily monitoring of mice for symptoms of disease (ruffled coat, hunched back, weakness, and reduced mobility) determined the time of killing for injected animals with signs of distress. If no signs of distress were seen, mice were initially analyzed for engraftment 8 wk after injection except where otherwise noted.
Mice were randomly assigned to the different treatment arms based on the blast counts in blood determined 3–8 d before the beginning of the treatment. The randomization was based on the number of mice with validated engraftment (higher than 20 blasts/µl of blood), sex, and body weight. The duration of treatment was determined before starting each experiment unless the animals died before the end of treatment or were euthanized for ethical reasons. During the treatments, total body weight was monitored every 2 d.
In vivo mice treatment CLDX
All mice were treated with doxycycline (200 µg/ml) and sucrose (10 µg/ml) supplemented to the drinking water on the third day after cell injection until the sacrifice of the mice to induce IDH1 WT or IDH1 R132 expression.
For IACS-10759 treatment, IACS-10759 was solubilized in water containing 0.5% methylcellulose before administration to mice. NSG mice were treated daily by gavage of 1.5 mg/kg IACS-10759 (according to weight loss of mice) from day 3 after cell injection for 14 d. For control, NSG mice were treated by daily gavage of vehicle. IACS-10759 was kindly provided by J.R. Marszalek. Mice were monitored for toxicity and were provided nutritional supplements as needed.
In vivo mice treatment PDXs
8–18 wk (PDXs) after AML cell transplantation and when mice were engrafted (tested by flow cytometry on peripheral blood or bone marrow aspirates), NSG mice were treated as described below:
For IACS-10759 treatment, IACS-10759 was solubilized in water containing 0.5% methylcellulose before administration to mice. NSG mice were treated three times a week by gavage of 6 mg/kg IACS-10759 (according to weight loss of mice) for 21 d. For control, NSG mice were treated by daily gavage of vehicle. IACS-10759 was kindly provided by J.R. Marszalek.
For AG-120 treatment, AG-120 (ivosidenib; AGIOS Pharma-ceuticals) was solubilized in water containing 0.5% methylcel-lulose and 0.2% Tween 80 before administration to mice. NSG mice were treated twice a day by gavage of 150 mg/kg AG-120 for 21 d. For control, NSG mice were treated twice a day by gavage of vehicle.
Mice were monitored for toxicity and provided nutritional supplements as needed.
Assessment of leukemic engraftment
NSG mice were humanely killed in accordance with European ethics protocols. Bone marrow (mixed from tibias and femurs) and spleen were dissected and flushed in Hank’s Balanced Salt Solution with 1% FBS. Mononuclear cells from bone marrow and spleen were labeled with mCD45.1-PerCP-Cy5.5 (560580), hCD45-APC (555485) and hCD44-PECy7 (560533) or hCD33-PE (555450; all antibodies from BD Biosciences), and Annexin V-V500 (561501) to determine the fraction of viable human blasts (AnnxV-hCD45+mCD45.1−hCD44+ or
AnnxV-hCD45+mCD45.1−hCD33+ cells) using flow cytometry. All
anti-bodies used for cytometry were used at concentrations between 1/50 and 1/200 depending on specificity and cell density.
Analyses were performed on a CytoFLEX flow cytometer with CytExpert software (Beckman Coulter) and FlowJo 10.2 (Tree Star). The number of AML cells/µl peripheral blood and number of AML cells in total cell tumor burden (in bone marrow and spleen) were determined by using CountBright beads (In-vitrogen) using described manufacturer protocol.
Statistical analyses
Statistical analyses were conducted using Prism software v8.0 (GraphPad Software). For in vitro and in vivo studies, statistical significance was determined by the two-tailed unpaired Stu-dent’s t test with Welch’s correction. For transcriptomic analysis of cohorts, statistical significance was determined by the non-parametric Mann-Whitney test. A P value <0.05 was considered statistically significant. For all figures, ns, not significant; *, P < 0.05; **, P < 0.01; ***, P < 0.001; ****, P < 0.0001. Unless otherwise indicated, all data represent the mean ± SEM from at least three independent experiments. Box-and-whisker plots display all the individual data points as well as the corresponding median. For in vitro metabolomic analysis, Seahorse, and ATP assays, each biological replicate repre-sents the mean of at least two technical replicates.
Cell culture
Unless otherwise specified, all AML cell lines were cultured in minimum essential medium-α (MEMα, 22561–021; Gibco) sup-plemented with 10% FBS (Invitrogen) in the presence of 100 U/ml of penicillin and 100 µg/ml of streptomycin (1% penicillin/ streptomycin [P/S]) and were incubated at 37°C with 5% CO2.
The cultured cells were diluted every 2 to 3 d and maintained in an exponential growth phase. Clones from the HL60 cell line expressing either IDH1 WT (#2, #4, and #7) or IDH1 R132H (#3, #5, and #11) were previously generated by our team and are GFP positive (Boutzen et al., 2016). MOLM14 was obtained from M. Carroll in 2011 and engineered to express IDH1 WT or R132H as described below. These cell lines have been routinely tested for mycoplasma contamination in the laboratory.
1-Octyl ester of (R)-2-HG was synthesized at the Organic Synthesis Core (Memorial Sloan Kettering Cancer Center, New York, NY) as previously described (Boutzen et al., 2016) and dissolved in DMSO (maximum [max], 1/1,000 final dilution). Octylalcohol (Sigma-Aldrich) solution in DMSO at the same concentration of (R)-2-HG was used as a control solution to ensure that only the effect of (R)-2-HG–free acid on the cells was observed. AGI-5198 (EMD Millipore) was dissolved in dime-thylfuran (max, 1/1,000 final dilution). AG-120 (MedChem) was dissolved in DMSO (max, 1/1,000 final dilution).
Generation of MOLM14 cells with IDH1 mutation by retroviral transduction
At day 0, 4 × 106293T cells were plated in DMEM+10% FBS and
1% P/S. At day 1, medium was removed from 293T cells, the cells were washed once with PBS, and 7.5 ml OPTIMEM+10% FBS (without P/S) was added. DNA mix for transfection was pre-pared as follows: for each 10-cm plate, (i) Solution A: 230 µl OPTIMEM (without FBS and P/S) + 20 µl lipofectamine 2000, incubated 5 min at room temperature; (ii) Solution B: 250 µl OPTIMEM + 6 µg DNA of interest + 4 µg p8.91 + 2 µg pVSVG
(envelope vector), mixed gently. Solution A was added to solu-tion B (lipofectamine on DNA) without mixing (no bubbles), and the mix was incubated 15 min at room temperature, then added on 293T cells dropwise. After 3–6 h of incubation at 37°C, the supernatant was removed, and 10 ml DMEM+10% FBS+P/S was added. At day 3, after 48-h culture, the lentiviral supernatants were filtered (0.45 µm) and then used straightaway or stored at −80°C. For lentiviral infection by spinoculation, 2 × 10⁶ AML
cells were incubated with 2 ml lentiviral supernatant in a 6-well plate. Polybrene at 8 µg/ml was added in each well, then the plate was centrifuged 60 min, 800 g, 37°C. After 4–6 h, the su-pernatant was removed; cells were washed once with PBS, then diluted in classical culture media. 3 d after lentiviral infection, the cells were selected with hygromycin B (300 µg/ml) for generation of MOLM14 IDH WT or R132H.
Plasmid references
For IDH1 WT (doxycycline inducible), pSLIK-IDH1-FLAG (Addgene Plasmid #66802) was used. For IDH1 R132H (doxy-cycline inducible), pSLIK-IDH1-R132H-FLAG (Addgene Plasmid #66803) was used. To induce IDH1 WT or R132H expression, cells were treated every 2 d with 0.5 µg/ml doxycycline. Generation of HL60 and MOLM14 IDH1 WT and R132H knockdown for CEBPα with shRNA and siRNA
HL60 and MOLM14 IDH1 WT and R132H constitutive shCTL and shCEBPα were obtained by retroviral transduction as described for the generation of MOLM14 cells with IDH1 mutation (59>39): shRNA control, purchased from Sigma-Aldrich (SHC002 MIS-SION pLKO.1-puro Non-mammalian shRNA control; 59-CCGGCA ACAAGATGAAGAGCACCAACTC-39); shRNA CEBPA, purchased from Sigma-Aldrich (SHCLNG-NM_004364, TRCN0000007306; 59-CCGGGCACGAGACGTCCATCGACATCTCGAGATGTCGATGGA CGTCTCGTGCTTTTT-39).
The transfection of siRNA into HL60 cells was performed using the Neon transfection system (Life Technologies) accord-ing to the manufacturer’s recommendations (1400V, 30 s, 1 pulse). After transfection, cells were seeded at 1 × 10⁶cells/ml
for 24 h in culture media. 1.4 µM of siRNA was used per con-dition for 15 million cells. RNA interference-mediated gene knockdown was achieved using prevalidated Sigma-Aldrich siRNAs (59>39) for CEBPα#1 (59-CGGACUUGGUGCGUCUAAG-39), and CEBPα#2 (59-GCAACUCUAGUAUUUAGGA-(59-CGGACUUGGUGCGUCUAAG-39), and Control (59-UAGCAAUGACGAAUGCGUA-39).
Chemograms
The drug screening library included 78 substances consisting of conventional chemotherapeutics and a broad range of targeted oncology compounds. Each drug was plated on 96-well plates at four concentrations covering a 1,000-fold concentration range. 10–20,000 patient-derived mononuclear cells were seeded per well in 96-well plates and incubated in the presence of com-pounds in a humidified environment at 37°C and 5% CO2. After
48 h of treatment, cell viability was measured using the CellTiter-Glo luminescent assay (Promega), and the data were normalized to negative control wells (dimethyl sulfoxide only). Effective half-maximal concentration values were deduced
from dose–response curves obtained using GraphPad Prism 6 software (GraphPad Software, Inc.). In this study, only data obtained for metformin and ABT-263 are displayed.
FACS-based cell sorting
Human AML cells from AML-xenografted mice were stained with AnnexinV-V500 and the following fluorescent conjugated antibodies: hCD45-APCH7 (641399) and hCD33-PE (555450; all antibodies from BD Biosciences) by MoFlo Astrios (Beckman Coulter) and FACSMelody (BD Biosciences).
Measurement of oxygen consumption in AML cultured cells in vitro or PDXs ex vivo
Measurement of oxygen consumption was performed using Seahorse Assay All XF assays with the XFe24 Analyzer (Seahorse Bioscience). The day before the assay, the sensor cartridge was placed into the calibration buffer medium (1 ml) supplied by Seahorse Biosciences to hydrate overnight. Seahorse XFe24 plate wells were coated with 50 µl of Cell-Tak (Cat #354240; Corning) solution at a concentration of 22.4 µg/ml and kept at 4°C over-night. Then, Cell-Tak–coated Seahorse plate wells were rinsed with distillated water (700 µl), and AML cells were plated at a density of 2 × 10⁵cells per well (in vitro experiments) or 4 × 10⁵
cells per well (in vivo experiments after cell sorting) in 50 µl XF base minimal DMEM media containing 5.6 mM glucose, 1 mM pyruvate, and 2 mM glutamine (Seahorse media). The plate was spanned at 80 g for 5 min, and then 450 µl of Seahorse media was added into each well carefully. After 1-h incubation at 37°C in CO2-free atmosphere, basal OCR (as a respiration indicator)
and ECAR (as a glycolysis indicator) were measured using the XFe24 analyzer with Seahorse Cell Mito Stress Assay–recommended parameters.
The ATP-linked respiration rate was determined by the dif-ference between the starting OCR and the OCR after adding oligomycin (first injection; 1-µM final concentration). The Spare Respiratory Capacity was calculated as the difference between maximum respiration obtained after adding carbonyl cyanide 4-(trifluoromethoxy)phenylhydrazone (FCCP; second injection; 2-µM final concentration) and basal OCR. The mitochondrial respiration rate was determined by the difference between the starting OCR and the OCR after adding AA/rotenone mixture (third injection; 1 µM for each drug).
ATP analysis
ATP was measured using the Promego Cell Titer Glo kit (G9242) and corresponding manufacturer’s protocol. In summary, fol-lowing treatment, 24,000 cells (cell lines) or 40,000 cells (pri-mary samples) were resuspended in 80 µl and distributed in a 96-well plate. Cells were then treated in replicates of three with 20 µl control (PBS) or with sodium iodoacetate (IA; final con-centration 100 µM) both alone and in combination with oligo-mycin (OA; final concentration 1.6 µM) + AA (final concentration 100 µM). Following 1-h incubation at 37°C with 5% CO2, 100 µl of
Cell Titer Glo reaction mix was added to each well for a final volume of 200 µl. Plates were then analyzed for luminescence with the microplate reader CLARIOstar (BMG Labtech). Total ATP was calculated as the difference between PBS and IA +
(OA+AA) conditions. Mitochondrial ATP was calculated as the percentage of total ATP corresponding to the difference between IA and IA + (OA+AA).
Enzymatic activity measurements
MDH and IDH enzymatic activities were measured as previously described (Gibon et al., 2004). Protocols were optimized for AML cell lines in order to determine the right amount of cells for each assay.
NAD-MDH
The activity of MDH was measured using a continuous assay, in which 2,000 extracted cells were mixed with 100 µl of 100 mM Tricine/KOH, pH 8, 0.1 mM EDTA, 0.05% Triton 100%, NADH 1.2 mM, and oxaloacetate 0 (blanks) or 1.125 mM (substrate saturation). Absorbance was measured at 340 nm and at 37°C until rates were stabilized.
NAD-IDH
The activity of IDH was measured using a continuous assay, in which 8,000 extracted cells were mixed in 100 µl of 100 mM Tricine/KOH, pH 8, 8 mM MgCl2, 0.05% Triton 100%, NAD+3
mM, and isocitrate 0 (blanks) or 3 mM (substrate saturation). Absorbance was measured at 340 nm and at 37°C until rates were stabilized.
Respiratory chain enzyme activities were measured on a Roche Diagnostics/Hitachi Modular P analyzer based on meth-ods described previously (Kramer and Nowak, 1988;Kr¨ahenbühl et al., 1996) and adapted to match apparatus requirements. The activities of all the complexes in each sample were normalized by the amount of protein to allow sample comparison.
Complex I activity
Briefly, reduced nicotinamide adenine dinucleotide phosphate– ubiquinone reductase activity (complex I) was measured by following the disappearance of nicotinamide adenine dinucleo-tide phosphate using rotenone as a specific inhibitor to ensure the specificity of the assay.
Complex II activity
Complex II activity, succinate-ubiquinone reductase, was as-sayed through the reduction of 2,6-dichlorophenolindophenol, a final electron acceptor, after the addition of succinate.
Complex III activity
The activity of complex III, ubiquinone–cytochrome c reductase, was determined by assaying the rate of reduction of cytochrome c.
Complex IV activity
The cytochrome c oxidase (complex IV) activity was based on the same assay as for complex III using potassium cyanide to inhibit the activity of this enzyme.
Complex V activity
Complex V activity was measured according to a method cou-pling ADP production to NADH disappearance through the