HAL Id: halshs-02216951
https://halshs.archives-ouvertes.fr/halshs-02216951
Submitted on 31 Jul 2019
HAL is a multi-disciplinary open access archive for the deposit and dissemination of sci-entific research documents, whether they are pub-lished or not. The documents may come from teaching and research institutions in France or abroad, or from public or private research centers.
L’archive ouverte pluridisciplinaire HAL, est destinée au dépôt et à la diffusion de documents scientifiques de niveau recherche, publiés ou non, émanant des établissements d’enseignement et de recherche français ou étrangers, des laboratoires publics ou privés.
VOCABULARY RICHNESS
Dominique Labbé, Pierre Hubert
To cite this version:
Dominique Labbé, Pierre Hubert. VOCABULARY RICHNESS. ALLC-ACH, Université de Paris iV, Apr 1994, Paris, France. �halshs-02216951�
Paris, 19-23 avril 1994.
V
OCABULARY
R
ICHNESS
Dominique LABBE
Institut d'études politiques de Grenoble BP 45 38.402 Saint Martin d'Hères CédexPierre HUBERT
Ecole des Mines de Paris35 rue Saint Honoré 77.305 FONTAINEBLEAU
Abstract
We propose a model to analyse the vocabulary of a corpus. This vocabulary is divided into two groups. First, the author uses the same general words whatever the circumstances. Second, several specialised vocabularies are used in only one part of the corpus. General words may appear everywhere in the text: their increase with the corpus' size can be estimated with Muller's formula. On the contrary, specialised vocabularies grow proportionally according to the corpus' size. We calculate the relative importance of the two vocabularies. This calculus gives an estimation of the lexical 'specialisation' in the text.
The 'vocabulary partition model' is easy to compute and it works well. It has been applied to several corpora to locate stylistic or thematic changes and to measure the vocabulary richness with three indicators : diversity, specialisation, oddness.
Résumé
La "richesse du vocabulaire" est analysée grâce à deux indicateurs : la diversité, la spécialisation. Le "modèle de partition du vocabulaire" permet de mesurer ces deux dimensions. La première est estimée à l’aide de la formule de Muller. L’accroissement tendanciel des vocabulaires spécialisés est proportionnel à la longueur du corpus. La communication présente une application de ces calculs aux discours du général de Gaulle (1958-1969).
2
Vocabulary richness is often used in quantitative stylistics. It measures the number V of different words in the N tokens used in a text (we use the terminology and symbols proposed by Charles Muller, 1977). One researches the ideal "norm" and unique indicator, valid in any cases whatever length or nature of analysed texts, but none of these formulas appears satisfactory. So one now compares directly some texts — when their lengths are similar — or by shortening them to the size of the most little one. (Muller, 1977 et 1979b ; Bernet, 1988).
Firstly, this paper shows how the analyse must take into account the "specialisation" of the vocabulary. Then, we propose a division of the "vocabulary richness" according to three notions (diversity, originality and vocabulary growth ).
Vocabulary Spécialisation
Muller propose to calculate V' — number of different words expected in an excerpt of N' types, with N'<N — by this way : the V words, in the whole text, are graded in order of frequency in n classes of frequency. Define Vi as the number of words which have the i frequency, V' is approximated by this formula :
(1) V'(u) = V -
i=1 i=n
Vi.Qi(u) with Qi(u) = (1 - u)i and u = N'
N This "Muller formula" has two limits :
Fn < N' < (N-Fn) in which Fn is the highest frequency in the text.
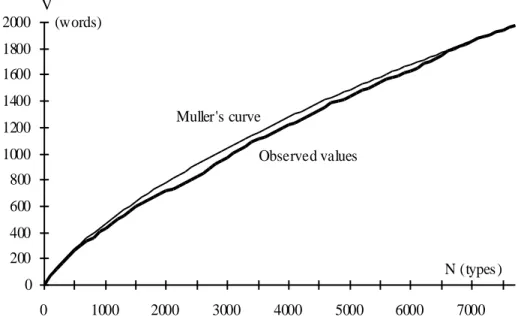
Between these limits, one can calculate numerous values and, with these values, draw a theoritical curve of "vocabulary growth" (Muller, 1979a and Hubert-Labbé, 1988a). In the figure 1, one can see the observed and calculated values on the press conference text by Général de Gaulle on January the 31th of 1964.
In this experiment, the calculated values are always under the observed values : it is a very usual characteristic which Muller noted and explained by "vocabulary specialisation" in parts of texts. According to Muller, the highest this specialisation is, the greatest is the difference between calculated and observed values (Muller, 1977, p. 142-144). In consequence, the vocabulary specialisation can be measured by the difference between the real curve of vocabulary growth and the Muller's curve. Define p this specialisation, the figure 2 presents shapes of vocabulary growth.
Fig. 1. Observed and Calculated Values on a Press Conference by Général de Gaulle (using Muller's Formula).
0 200 400 600 800 1000 1200 1400 1600 1800 2000 0 1000 2000 3000 4000 5000 6000 7000 Muller's curve Observed values N (types ) (words) V
Fig. 2. Theoritical Shapes of Vocabulary Growth (P = Vocabulary Specialisation). V
N P=1
P=0
Nearly all the possible values are included in the figure 2 shaded area. In case of no specialisation, the observed curve coincides with the Muller's one (formula 1). On the contrary, if p is equal to one, all the words are specialised and V' is then a linear function of N' :
V'p=1(u) = u .V
Between these two extreme cases, the mathematical expectation of the number of different words, in an excerpt of N' words, is :
(2) V' (u) = p.u.V + q
[
V -
i=1 i=n
Vi Qi (u)
]
with q = 1 - pThe coefficients p and q measure the relative size of two parts of text vocabulary : the first one contains the p.V specialised words ; the second part contains the q.V words
4
whose probability of appearing at some stage in the text is constant. For this reason, we propose to name p "coefficient of vocabulary partition" (Hubert-Labbé, 1988b). In the formula (2), the first term estimates the weight of the specialized vocabulary and the second, the general vocabulary (with Muller's formula).
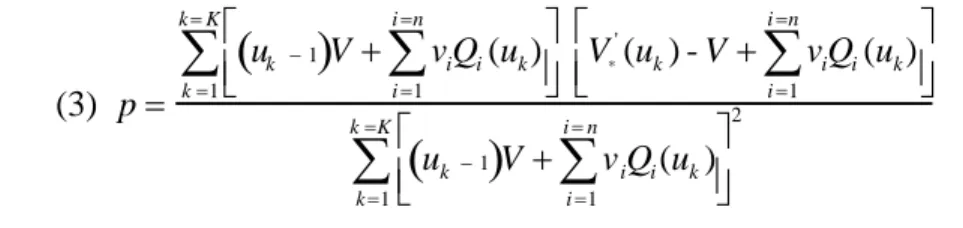
Practically, coefficient p is calculated this way : the text is divided in a certain number of excerpts and, at each caesura, the differents words are counted since the beginning of the text. The lenghts of these excerpts are not necessarily equal and the caesura can be placed everywhere. For K excerpts, the value of p is that which minimises the sum of the quadratic deviations between the observed values — V'*(uk) — and the calculated values (V' (uk) ). We obtain :
(3) p uk 1
V viQi(uk) i 1 i n
V* ' (uk) - V viQi(uk) i 1 i n
k 1 k K
uk 1
V viQi(uk) i 1 i n
2 k 1 k K
Formula (2) and (3) are easy to compute. Of course, the accuracy of results is influenced by number and quality of observations. It appears that no less than ten values of V'*(uk) are necessary, evenly distributed in the texts or corpus. Given this cautious, numerous experiments proved that p is actually independant of size and number of excerpts. The figure 3 presents our findings on the same text by General de Gaulle : theoritical curve now coincides well with observed growth of vocabulary.
Fig. 3. Observed and Calculated Values on a Press Conference by Général de Gaulle (using the Coefficient of Vocabulary Partition)
0 200 400 600 800 1000 1200 1400 1600 1800 2000 0 1000 2000 3000 4000 5000 6000 7000 V (words) N (types) — theoritical values — observed values
With this formula, one can compare, without error, the "vocabulary richness" of several texts by shortening them to the size of the little one, following the way proposed by Muller. At the end of this presentation, a table gives results of this comparison between press conferences by President de Gaulle (between 1958 and 1969). Two values of V' are calculated with N' = 5299 types (size of the shortest conference). The first one is obtained with "Muller's formula" (1) and the second with "partition formula"
(2) : Muller's formula can deeply overestimate the vocabulary richness of the longest text when his vocabulary has a high specialization (which is the case of conferences holded on January 1964 and October 1966).
Specialization, Diversity, Originality and Vocabulary Growth
Since "vocabulary richness" is a complex phenomenon, we propose to divide this concept into four simple notions : diversity, specialization, originality et vocabulary growth.
1. The vocabulary specialization is calculated with p (partition coefficient). It underlines the author's ability to adapt his vocabulary to the themes or, on the contrary, his propensity to use the same words whatever the subject is. Practically, we never met texts in which specialization overcomes 0.45. Above 0.3, the specialization is high (it can also be interpreted as heterogeneousness…) ; between 0.29 and 0.15, the specialization is average ; under 0.15, it is low. The values near or equal to zero are not unusual. Sometimes, in short texts, some observed values can go above the Muller's curve, indicating a kind of "hyper-generality".
At the end of this presentation, a table shows the values of the partition coefficients in the General de Gaulle press conferences. Usually, when he prepared his speeches, de Gaulle used a low specialized vocabulary. On the contrary, during the December 1965 campaign for presidential election, he had to improvise three T.V. interviews : specialization was high : 0.34 in average. In other terms, the "generality" of his speaches was a deliberate characteristic.
2. The vocabulary diversity indicates the author's propensity to diversify his words — or to avoid repetition. The indicator of vocabulary diversity is the number of words in the (N-1) excerpts of N' types which can be divided in a text. The indicator of diversity is calculated from formula (2), selecting one value of N' in order to compare texts or excerpts of different sizes (we choose 1.000 types).
Using "natural" caesuras, as chapter or plays, we can study the text structure which is not taken into account by the Muller's method. For example, the press conferencies of Général de Gaulle have around 411-481 words for 1.000 types (see Table in annexe). These values caracterize well-written texts (in improvised interviews of December 1965, the indicator is less than 400). In other words, General de Gaulle wrote his press conferencies and learnt them by heart ! It is interesting to see that highest diversity is reached in critical times (declaration about "autodétermination" of Algeria in autumn 1959, presidential election of 1965, iniatives after March 1967 parliamentary election or after May 1968).
A low diversity shows a poor preparation or a pedagogic intention (by underlining the main points). On the other side, a high diversity shows the intention to avoid monotony or a polemic will. But, this intention of diversity can cause a low specialization ; so, a combination of high diversity and good specialization reveals a very well prepared text : it is the case of conference held on September 1965 which is also the longest (General de Gaulle prepared his second candidature for presidency)…
6
3. The vocabulary originality measures the difference between vocabulary of an excerpt and the one of the whole text. For this calculation, one can use the vocabulary specificities (Lafon, 1984). But specific words densities are partly dependent of excerpts' sizes so that it is not possible to compare texts of different sizes. We propose a less sophisticated way by using "proper vocabulary" (i.e. words used only in a single excerpt). The more numerous is this proper vocabulary, the most original is the text. Like specialised vocabulary, proper vocabulary is dependent of excerpt size. Define VP the number of proper words found in the K excerpts in the text and VP'*(uk), the number of proper words observed in k excerpt which size is N' types. The mathematical expectation of the proper vocabulary in this excerpt is :
VP'(uk) = VP.u and indicator of originality : VP'VP'(uk) *(uk)
When this indicator is equal to one, the originality is average ; above, the excerpt is out of line with the others ; under, the author used common materials. The proper vocabulary of each excerpt is always interesting. For example, in General de Gaulle's case, there are numerous names, indicating application of the same outlines to new events, other peoples or countries…
As for the partition coefficient, accuracy of computation depends on the number and quality of observations. For example, no less than ten values are necessary to compute mathematical expectation.
4. Vocabulary growth and location of thematic caesura. The partition model also allows estimation, in any point of a text, of the theoritical number of different words used since the beginning (under the steady flow hypothesis). The incremental growth in a part of the text is the ratio of the observed number of different words to the theoritical value calculated with (2). Thematic caesuras are located at the points where unusual flows of new words occur. On the contrary, when this flow is under expected values, a theme is ending or author's inspiration weakens or, for a politician, he appropriates with difficulty his vocabulary to a new situation. This model has been applied to speaches of President Mitterrand (Labbé, 1990a) and General de Gaulle (Labbé, 1993).
In conclusion, the different formulas we presented there are easy to compute and the results can be very accurate. Other researches will be necessary to appreciate interest and limits of our model. In any case, these calculus set up the problem of textual data quality : if this quality is poor, the accuracy of calculus is useless. Unfortunatly, for French language, there are many standards for text encoding and these standards have a heavy influence on results (see Ménard, 1983 and Salem, 1993).
Table. Press conferences by Général de Gaulle
("Saint-Cloud" standards for text encoding : Lafon, 1985 ; Labbé, 1988a) Conferences N (types) V (words) V'(Muller)
(5299 words) V'(pa) (5299 words) P (speciali-sation) Diversity (1000 words) Originality Nov. 10th 1959 6311 1566 1413 1413 0,00 474 0,92 Sept. 5th 1960 6808 1580 1355 1352 0,02 433 0,83 Apr. 11th 1961 6597 1599 1391 1377 0,13 418 0,89 Sept. 5th 1961 5299 1423 1423 1423 0,02 411 0,89 May 15th 1962 5946 1434 1335 1330 0,08 419 0,81 Jan. 14th 1963 6906 1687 1429 1421 0,06 443 0,84 Jul. 29th 1963 6682 1743 1504 1504 0,00 470 1,13 Jan. 31th 1964 7686 1974 1548 1504 0,23 420 1,16 Sept. 23th 1964 5886 1633 1528 1522 0,09 459 1,10 Feb. 4th 1965 6543 1814 1564 1564 0,00 448 1,19 Sept. 9th 1965 7958 2023 1583 1561 0,16 480 1,04 Feb. 21th 1966 6148 1655 1506 1496 0,13 448 1,10 Oct. 28th 1966 7446 1865 1498 1456 0,24 412 1,05 May 16th 1967 6514 1786 1562 1559 0,03 475 1,04 Nov. 27th 1967 7895 2028 1562 1537 0,13 446 1,37 Sept. 9th 1968 6027 1639 1514 1514 0,00 481 1,11
8 REFERENCES
Bernet, Ch. (1988), "Faits lexicaux. Richesse du vocabulaire. Résultats" in D. Labbé, Ph. Thoiron and D. Serant, Etudes sur la richesse et la structure lexicales, Paris-Genève, Slatkine-Champion, p 1-12.
Hubert P. and Labbé D. (1988a), "Note sur l'approximation de la loi hypergéométrique par la formule de Muller", in D. Labbé, Ph. Thoiron and D. Serant, Etudes sur la richesse et la structure lexicales, Paris-Genève, Slatkine-Champion, p 77-91.
Hubert, P. and Labbé, D. (1988b), "Un modèle de partition du vocabulaire", in D. Labbé, Ph. Thoiron and D. Serant, Etudes sur la richesse et la structure lexicales, Paris-Genève, Slatkine-Champion, p 93-114.
Labbé, D. (1990a), Normes de dépouillement et procédures d'analyse des textes politiques, Grenoble, CERAT.
Labbé, D. (1990b), Le vocabulaire de François Mitterrand, Paris, Presses de la FNSP. Labbé, D. (1993), Un modèle d'analyse du vocabulaire, Communication aux secondes
journées d'analyse de données textuelles, Montpellier, octobre 1993.
Lafon, P. (1984), Dépouillement et statistiques en lexicométrie, Paris-Genève, Slatkine-Champion.
Lafon, P., Lefevre, J. et al. (1985), Le Machinal (Principes d'enregistrement informatique des textes), Paris, Klincksieck.
Ménard, N. (1983), Mesure de la richesse lexicale, Genève-Paris, Slatkine-Champion. Muller, Ch. (1977), Principes et méthodes de statistique lexicale, Paris, Hachette.
Muller, Ch. (1979a), "Calcul des probabilités et calcul d'un vocabulaire" in Langue française et linguistique quantitative, Genève-Paris, Slatkine-Champion, p 167-176. Muller, Ch. (1979b), "Sur la mesure de la richesse lexicale. Théorie et expériences" in
Langue française et linguistique quantitative, Paris-Genève, Slatkine-Champion, p 281-307.
Muller, Ch. (1985), "Les classes de fréquence" in Langue française, linguistique quantitative, informatique, Genève-Paris, Slatkine-Champion, p 53-58.
Salem A. (1993), Méthodes de la statistique textuelle, Thèse de doctorat d'Etat, Paris, Université Paris III, 3 tomes.