HAL Id: hal-00482112
https://hal.archives-ouvertes.fr/hal-00482112
Submitted on 8 May 2010
HAL is a multi-disciplinary open access
archive for the deposit and dissemination of
sci-entific research documents, whether they are
pub-lished or not. The documents may come from
teaching and research institutions in France or
abroad, or from public or private research centers.
L’archive ouverte pluridisciplinaire HAL, est
destinée au dépôt et à la diffusion de documents
scientifiques de niveau recherche, publiés ou non,
émanant des établissements d’enseignement et de
recherche français ou étrangers, des laboratoires
publics ou privés.
Distributed under a Creative Commons Attribution - ShareAlike| 4.0 International
License
Polystyrene grafting from silica nanoparticles via
Nitroxide-Mediated-Polymerization (NMP): synthesis
and SANS analysis with contrast variation method,
Chloé Chevigny, Didier Gigmes, Denis Bertin, Jacques Jestin, François Boué
To cite this version:
Chloé Chevigny, Didier Gigmes, Denis Bertin, Jacques Jestin, François Boué. Polystyrene grafting
from silica nanoparticles via Nitroxide-Mediated-Polymerization (NMP): synthesis and SANS analysis
with contrast variation method,. Soft Matter, Royal Society of Chemistry, 2009, 5 (19), pp.3741-3753.
�10.1039/b906754j�. �hal-00482112�
Polystyrene grafting from silica nanoparticles via
Nitroxide-Mediated-Polymerization (NMP): synthesis and SANS analysis with contrast
variation method
Chloé Chevigny,
aDidier Gigmes ,
bDenis Bertin,
bJacques Jestin,
a*and François Boué
a5
Received (in XXX, XXX) 1st January 2007, Accepted 1st January 2007 First published on the web 1st January 2007
DOI: 10.1039/b000000x
We present a new convenient and efficient “grafting from” method to obtain well defined polystyrene (PS) silica nanoparticles. The method, based on Nitroxide-Mediated Polymerization
10
(NMP), consists to bind covalently the alkoxyamine, which acts as initiator controller agent, at the silica nanoparticles surface in two steps. The first step is a reaction between the aminopropylsilane and the silica particles in order to functionalize the particles surface with amino group. In a second step, the initiating-controlling alkoxyamine moiety is introduced via an over grafting reaction between the amino group and the N-hydroxysuccinimide based MAMA-SG1 activated ester. To
15
simplify both their chemical transformation and the polymerization step, the native silica particles, initially dispersed in water, have been transferred in an organic solvent, the dimethylacetamide, which is also a good solvent for the polystyrene. The synthesis parameters have been optimized for grafting density, conversion rates, and synthesis reproducibility while keeping the colloidal stability and to avoid any aggregation of silica particles induced by the inter -particles interaction
20
evolution during the synthesis. After synthesis, the final grafted objects have been purified and the non-grafted polymer chains formed in the solvent have been washed out by ultra filtration. Then the particles have been studied using Small angle Neutron Scattering (SANS) coupled to neutron contrast variation method. To optimize the contrast conditions, both hydrogenated and deuterated monomers have been used for the synthesis. A refined fitting analysis based on the comparison on
25
two models, a basic core-shell and the Gaussian Pedersen model, enables us to fit nicely the experimental data for both the hydrogenated and deuterated grafted case. Differences are seen between grafting of normal or deuterated chains which can be due to monomer reactivity or to neutron contrast effect variations. The synthesis and the characterization method established in this work constitute a robust and reproducible way to design well defined grafted polymer
30
nanoparticles. These objects will be incorporated in polymer matri ces in a further step to create Nanocomposites for polymer reinforcement.
Introduction
Creating model nano-composites composed of nano-fillers introduced in a polymer matrix is a step towards the
35
understanding of mechanical reinforcement of polymers, by studying the relation between the filler structure and the obtained mechanical properties1. Two different contributions to reinforcement are often distinguished: (i) the interaction of the matrix polymer chains with the surface of the
40
nanoparticles, (ii) the filler spatial diserpsion in the matrix.
a Laboratoire Léon Brillouin, CEA Saclay 91191 Gif sur Yvette Cedex
France
b Laboratoire Chimie Provence, UMR 6264, CNRS et Universités
d’Aix-45
Marseille 1,2 et 3, Site de St Jérôme, Av. Esc. Normandie-Niemen case 542, 13393 Marseille Cedex 20, France
* corresponding autor : [email protected]
The main dominant point which will permit to understand and
50
describe such mechanisms is the control of the dispersion state of the filler in the polymer matrix. Such control could be based on an external trigger by a simple control of the film processing conditions2, of the electrostatic repulsion3 or with a magnetic field4 but also using an internal way based on
55
advanced chemistry and particularly grafting techniques of polymer chains on the surface of the particles. The grafting can be performed “onto”5
or “from” the surface of the particles using preferably various controlled polymerization techniques6 as ATRP (Atom Transfer Radical
60
Polymerization)7-15, NMP (Nitroxide Mediated Polymerization)16-25 or RAFT (Reversible Addition Fragmentation chain Transfer)26-27. Synthesis of particles with chains grafted covalently at their surface should enable to control, depending on the structure of the grafted chains layer,
65
these two contributions (i) and (ii), and therefore to determine their dispersion. The synthetic method selected (polymerization techniques, degree of control, reproducibility)
depends on the nature of the polymer, the polymerization medium (bulk, aqueous or organic solution) and the quantities of grafted particles needed for further applications. In our team, we were interested in both starting from a colloidal suspension of well dispersed nanoparticles in an organic
5
solvent and maintain the stability and the good dispersion in the sol during grafting. Hence we would be able to start from individual nano-objects to introduce them in a polymer matrix: this final aim will be reported in a subsequent paper. In order to reach this goal, we were needing a reliable
10
chemical synthesis route, with high conversion and good reproducibility to produce in large quantity, from an original silica sol, grafted nano-beads quite well defined from the beginning, and still well dispersed in the final sol after grafting. Moreover controlled polymerization is crucial to
15
have a well defined corona in term of architecture, composition and distribution (to study later its effect on the mechanical properties). The complete and accurate characterization of the sol and of the objects after the synthesis will be then performed by means of Small Angle
20
Neutron Scattering (SANS). This technique gives a deep characterization of the dispersion and of the structure of each object. Indeed thank to the annihilation of the signal either of the core or of the corona, it is possible to observe the spatial distribution of the other component. Moreover, it would be
25
interesting to synthesize the corona out not only of normal polystyrene (h-PS), but also of deuterated polystyrene (d-PS); this would be useful when studying the dispersion of the grafted particles in a polymer matrix, as planned in the further work.
30
The first part of the paper is devoted to the description of the grafting-from method we developed to prepare the polystyrene silica nanoparticles. Among the different grafting-from controlled radical polymerization techniques already reported, we have chosen a process based on the NMP. Even
35
if RAFT, ATRP or NMP systems have all proven their efficiency to elaborate polymer silica nanoparticles, compared to the RAFT and ATRP techniques, NMP is a mono-component system that is undoubtedly an advantage for such application. Indeed, during the synthesis, maintaining the
40
stabilization of the colloidal suspension is a major concern. In this context we do believe that the use of a multiple component initiating system (e.g metal halide and ligand for ATRP, or conventional initiator in addition of the RAFT moiety attached to the silica nanoparticles) increases the
45
source of possible aggregation phenomena by disturbing the particle interactions. Moreover, regarding the reinforcement applications unlike in NMP in the case of ATRP the polymer grafted silica nanoparticles have to be purified to get rid of the metal complexes prior to the nanocomposite formulation step.
50
The interest of our approach is related to its simplicity, versatility and robustness. Indeed, while different strategies have been proposed to attach an alkoxyamine onto a silica particle, there is still a need for efficient and convenient initiator grafted procedure. Our approach consists to bind
55
covalently the alkoxyamine, which acts as initiator controller
agent, in two steps onto the silica nanoparticles surface. The first step is a reaction between the aminopropylsilane and the silica particles in order to functionalize the particle surface with amino group. In a second step the initiating-controlling
60
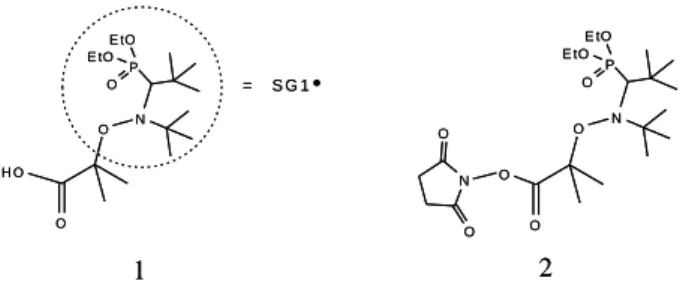
alkoxyamine moiety is introduced via an overgrafting reaction between the amino group and the N-hydroxysuccinimide based MAMA-SG1 (MAMA-NHS) activated ester previously prepared in a straightforward manner from the commercially available MAMA-SG1 (blocbuilder) (figure 1)28. We have
65
chosen the overgrafting method because the latter has been already used for the functionalization of silica wafers or silica particles and was found to give better results in terms of control and degree of grafting compared to other methods. We use an alkoxyamine bearing a tertiary stabilized alkyl moiety
70
as initiating species, which gives a much better control of the polymerization reaction compare to the secondary alkyl stabilized one usaually employed29.
75 O O H O N P O E tO E tO S G 1 = O O O N P O E tO E tO N O O 1 2 O O H O N P O E tO E tO S G 1 = O O O N P O E tO E tO N O O 1 2
Fig. 1 Initiator MAMA-SG1 (BlocBuilder), molecule 1, and activated
ester MAMA-NHS, molecule 2.
The second part of the paper then describes the detailed characterization of the grafted nanoparticles successfully
80
previously prepared, with a high degree of confidence, using SANS combined with variable contrast30 between the two components (the silica core and the grafted polymer corona) of the grafted particles. Indeed, adding to the sol the same organic solvent but in its deuterated form, we can vary the
85
deuterated fraction in order to observe either the silica or the polymer. If we annihilate the contrast between the solvent and the grafted chains, we can observe the shape and size distribution of the cores, and the spatial distribution of their centres of mass, and show how close they can be from the
90
ones for the initial particles. Observations of the core after synthesis have been reported by several other groups31, 20. But in this paper, we also annihilate the contrast between solvent and cores, enabling us to observe the polymer shell around the cores if grafting has been successful. This method has been
95
used many times in dispersions of various hybrid objects, including centro-symmetric ones like surfactants or copolymers micelles32. But in our knowledge it has been used only a few times for grafted nanoparticles. First some qualitative observations, which followed the grafted polymer
100
growth during synthesis, were reported8-9. For a more quantitative and accurate description of the objects, we need to use a geometrical model representing our grafted objects. We discuss here which is the most convenient. A first attempt
was reported using a core-shell model7, while we also use here the Pedersen model33-34 first developed for copolymer micelles. In this paper we have used in particular a new type of silica nanoparticles with a convenient size and a narrow enough size distribution; combined with the fact that the
5
stability is well kept after synthesis, this enables a more thorough fitting. The whole process is achieved for corona synthesized either out of normal polystyrene or out of deuterated polystyrene.
10
Experimental
MaterialAminopropyltriethoxysilane (APTES, stored under nitrogen), N-hydroxysuccinimide, Dicyclohexylcarbodiimide, Styrene and the solvent dimethylacetamide (DMAc) were
15
used as received from Aldrich. MAMA-SG1 (BlocBuilder) was kindly provided by Arkema and used as received. Deuterated styrene was purchased from Eurisotop and used as received.
We use silica Ludox TM-40, purchased from Aldrich. It is a
20
colloidal suspension of mono-disperse silica beads in water; they are transferred in DMAc by evaporation. The Ludox are first dissolved in a large volume of water, and the same volume of DMAc is added. The resulting solution is then heated to 100°C, under agitation, to evaporate water and
25
concentrate the suspension; we stop when silica concentration is 5 % in weight, which also correspond to complete evaporation of water. The final suspension of Ludox silica in DMAc is characterized by Small-Angle Neutron Scattering (SANS) to check the dispersion (see results).
30
Synthesis
Silanization of colloidal silica nanoparticles in DMAc
In a typical run, the silica dispersion (100 g of 5wt% SiO2
in DMAc) is added to a 250 mL round-bottom flask with a
35
magnetic stir bar. Aminopropyltriethoxysilane (APTES) (395 mg, 1.79 mmol, which corresponds to about 1 molecule/nm2) and methanol (6.6 mL) are added and the reaction mixture is left reacting for 24 hours at room temperature. The reaction mixture is then filtered under nitrogen pressure using a
40
Millipore Ultra-filtration apparatus with a 30 000 Dalton pores diameter filter (regenerated cellulose) purchased from Millipore, to purify the solution from unreacted silanes. The solution is filtered four times. Each time, 100 mL of the obtained solution is diluted with 200 mL of DMAc and
45
concentrated to the initial volume.
Over-grafting of the initiator
50
MAMA-NHS previously prepared according to27 (268 mg,
0.56 mmol) is added to the silanized silica solution (100 g of 5wt% SiO2 in DMAc). The reaction takes place during two
hours, under nitrogen bubbling and at 0°C, to avoid the dissociation of the initiator. The solution of initiator -grafted
55
particles is then filtered (same procedure as describe before) at 0°C. Thermo-gravimetric analyses were used to determine the yield of grafting and reaction and therefore the amount of initiator.
60
Polymerization from the surface of the nanoparticles
Model polymerizations in solution, in exactly the same conditions, but without silica beads, were first performed to check the feasibility and the good control of the polymerization. The solution of initiator-grafted silica
65
particles is diluted to 1.1wt%, and 150g are added to a 500 mL three-neck flask. Styrene (50g) is added dropwise to the solution within the first hour, in order to avoid gelling, under constant stirring. Free initiator (BlocBuilder, 339 mg, 0.89 mmol) is added to the solution to ensure a better control of the
70
polymerization. The reaction mixture is then deoxygenated by nitrogen bubbling for 30 min. The flask is then put in an oil bath at 120°C to launch the polymerization. The reaction takes place for 6 hours, under nitrogen pressure. Kinetic samples are taken via sterile syringes and used to determine
75 conversion by gravimetry. S i N H2 O O O O S i N H 2 O S i O S i N H2 N H2 O O + O N O O O O Si N H O S i O S i O O O + S G1 S G1 O H O H O H H O H O H O O H O H O S i N H2 O S i O S i N H2 N H2 O O S iO2 S iO2 S iO2 S iO 2 with MeOH Ambient temperature, 24h 0°C, 2h A m A m A m A m A m A m A m A m A m A m A m n n n S iO2 S iO2
+
120°C, 6h, N2 With sacrificial initiator: O O H SG1+
free Polystyrene [a] [b] [c] S i N H2 O O O O S i N H 2 O S i O S i N H2 N H2 O O + O N O O O O Si N H O S i O S i O O O + S G1 S G1 O H O H O H H O H O H O O H O H O S i N H2 O S i O S i N H2 N H2 O O S iO2 S iO2 S iO2 S iO 2 with MeOH Ambient temperature, 24h 0°C, 2h A m A m A m A m A m A m A m A m A m A m A m n n n S iO2 S iO2+
120°C, 6h, N2 With sacrificial initiator: O O H SG1+
free Polystyrene S i N H2 O O O O S i N H 2 O S i O S i N H2 N H2 O O + O N O O O O Si N H O S i O S i O O O + S G1 S G1 O H O H O H H O H O H O O H O H O S i N H2 O S i O S i N H2 N H2 O O S iO2 S iO2 S iO2 S iO 2 with MeOH Ambient temperature, 24h 0°C, 2h S i N H2 O O O O S i N H 2 O S i O S i N H2 N H2 O O + O N O O O O Si N H O S i O S i O O O + S G1 S G1 O H O H O H H O H O H O O H O H O S i N H2 O S i O S i N H2 N H2 O O S iO2 S iO2 S iO2 S iO 2 with MeOH Ambient temperature, 24h 0°C, 2h A m A m A m A m A m A m A m A m A m A m A m n n n S iO2 S iO2+
120°C, 6h, N2 With sacrificial initiator: O O H SG1+
free Polystyrene A m A m A m A m A m A m A m A m A m A m A m n n n S iO2 S iO2+
120°C, 6h, N2 With sacrificial initiator: O O H SG1 A m A m A m A m A m A m A m A m A m A m A m n n n S iO2 S iO2+
A m A m A m A m A m A m A m A m A m A m A m n n n S iO2 S iO2+
120°C, 6h, N2 With sacrificial initiator: O O H SG1+
free Polystyrene [a] [b] [c]Fig. 2 Scheme of the three steps of grafting: the silanization [a], the
over-80
grafting of the initiator [b] and the polymerization from the particles surface [c].
When the polymerization is over, we have to separate the polystyrene-grafted particles from the free polystyrene in solution (from the free initiator). We use the same ultra
85
diameter filter in regenerated cellulose.Each time, 100 mL of the solution is diluted with 200 mL of DMAc and concentrated to the initial volume; the solution is filtered five times. We keep apart the free polymer chains, which are characterized by Size Exclusion Chromatography (SEC).The
5
procedure is exactly the same for deuterated styrene (C8D8)
and for styrene C8H8. After extensive characterization of the
sol by TGA to determine grafting density of the polymer, the solutions are prepared at the desired concentration for SAN S measurements. Figure 2 resumes the whole grafting process.
10
Characterization
The grafting densities (silane, initiator and polymer) are determined by Thermo-gravimetric analysis (TGA). We use a TA instrument Q50, at a scan rate of 10 °C.min-1 to 800 °C,
15
under a nitrogen flow (60 mL.min-1); the grafting densities are determined using the equation below:
) ( 100 * * tot ref ref tot gr spe W W W W Na M S nsity Graftingde (1) 20
Where Sspe is the specific surface (nm2/g) of the silica, Mgr
the molar mass of the grafted molecule, Na the Avogadro
number, Wtot and Wref are, respectively, the weight loss of the
grafted sample and the weight loss of the reference sample (silica for determining the initiator grafting and
initiator-25
grafted silica for the polymer).
Small Angles Neutron Scattering (SANS) Measurements
Measurements were performed at the Laboratoire Léon
30
Brillouin (LLB) on the SANS spectrometer called PAXY. Three configurations were used: the first one with wavelength 15 Å, sample-to-detector distance of 6.70 m, and a collimation distance of 5.00 m, and the second with wavelength 6 Å, sample-to-detector distance of 6.70m, and a collimation
35
distance of 2.50 m and the last one with wavelength 6 Å, sample-to-detector distance of 3.00m, and a collimation distance of 2.50 m corresponding to a total Q range of 2.10-3
Å-1 to 0.1 Å-1. Data processing was performed with a
homemade program following standard procedures with H2O 40
as calibration standard. Small deviations, found in the spectra at the overlap of two configurations, are due to different resolution conditions and (slight) remaining contributions of inelastic, incoherent, and multiple scattering. To get the cross-section per volume in absolute units (cm-1), the incoherent 45
scattering cross section of H2O was used as a calibration. It
was estimated from a measurement of the attenuator strength, and of the direct beam with the same attenuator. The incoherent scattering background, mainly due to protons of the solvent, was subtracted using a blank sample with zero
50
silica fractions.
Neutrons Contrast variation method
The contrast variation method offered by neutron scattering experiments is a powerful technique to elucidate complex structures made out of the association of binary component
55
systems, i.e. here the polymer chain, the silica particle and the solvent. Two main conditions must be realized: the scattering length density of the two components of the system must be sufficiently different from each other and these values must be also comprised between the scattering length density values of
60
the hydrogenated and the deuterated solvent. This is the case for our system regarding the following scattering length density () values: SiO2 = 3.40 10
6 Å, h-PS = 1.43 10 -6 Å-2, d-PS = 6.53 10 -6 Å-2, h-DMAc = 0.52 10 -6 Å-2, d-DMAc = 6.60
10-6 Å-2. The total scattering length density of a mixture of
65
hydrogenated and deuterated solvent can be written as a function of the respective proportion of H/D in volume fraction Φ as:
mixture=h-DMAc×h-DMAc+(1-h-DMAc)×d-DMAc (2) 70
Using this property, we can perform SANS measurements on a solution of grafted silica nanoparticles in contrast matching condition for which we can first match the scattering contribution of the polymer chain to check the colloidal stability of the suspension. This can be done with a mixture of
75
85%/15% h-DMAc/d-DMAc. Secondly, on the same sample, we can investigate the scattering contribution of the grafted PS corona by matching the silica core contribution with a mixture of 53%/47% h-DMAc/d-DMAc. The resulting scattering signal in both contrast cases can then be analysed
80
by comparison to calculated scattering, using some specific expressions of form factor that we described just below.
Fitting Models
The total intensity I(Q) scattered by a colloidal solution of
85
centrosymetrical particles volume fraction Φ can be written as follows: ) ( ) ( ) ( . 2 Q S Q F V Q I part
(3)
Vpart is the volume of the particle, ² is the difference between 90
the scattering length density of the particle and the scattering length density of the solvent, F(Q) is the from factor of the particle and S(Q) is the structure factor of the particles. For diluted colloidal solutions, the interactions between the particles can be ignored and we can consider the structure factor to be
95
close to 1 (S(Q)1). The form factor of a bead which we assume to be a compact sphere is written as:
3 2 2 sin( ) cos( ) ) ( ) ( 3 ) ( x x x x x f with QR f Q F (4)
R is the radius of a native particle. The polydispersity in size of the silica beads is described by means of a log-normal
100
) ln 2 1 exp( 2 1 ) , , ( 0 2 2 0 R R R R R P
(5)
The form factor with polydispersity is calculated by integration:
2 2 0 2 2 ) , ( ) , , ( )
(Q P RSiO R F Q RSiO dRSiO
F
(6)
5
This form factor can be used to analyze the scattering signal of the native silica particles and also to analyze the scattering of the grafted silica particles in contrast matching conditions for which the polymer is matched, i.e. we see only the silica core. For the other contrast matching condition in which we match the silica
10
particle to see only the grafted polymer chains, two main form factors will be considered. The first one, and the most basic, is the core shell model which can be expressed as:
2 2 3 2 2 3 2 2 2 ) ( 3 4 )) ( ( ) ( 3 4 ) , ( SiO SiO SiO SiO SiO shell QR f R e R Q f e R R Q F
(7) 15
f(x) is defined in equation 3, the polydispersity of the radius of silica beads could be included by integration like equation 5, and
e denotes the thickness of the shell. This model supposes that the
corona is made of constant and homogenous density, which can be a mixture of polymer and solvent of constant concentration, as
20
function of the distance from the interface and will be consequently suitable for high grafting density. The second model we use has been built by Pedersen33 for block copolymer micelles and is representative of the form factor for Non-interacting Gaussian chains. The general expression can be
25 written as follows: ) ( ) 1 ( ) ( 2 ) ( ) ( ) , ( 2 2 2 2 2 2 2 2 Q S V N N Q S V NV Q F V N Q F V R Q F chain chain chain chain chain core chain core chain core chain chain chain core core core SiO pedersen
(8) Where Vcore, Vchain are the volume of the core and of the chain,
Fcore, Fchain are the form factors of the core and of the chain, 30
ρ²core, ρ²chain, are the contrast between the core and the solvent
and between the chain and the solvent, Score-chain and Schain-chain are
the structure factor between the core and the chain and the inter chain structure factor, N is the number of chains. The form factor of the core Fcore can be written as a sphere form factor (equation 35
3). The form factor of the Gaussian chain Fchain can be written
according to the classical Debye expression: 2 2 2 2 , ) 1 ( 2 ) ( g x chain with X Q R X X e Q F
(9)
where Rg is the radius of gyration of the Gaussian chain. The 40
crossing term related to the interaction between the core and the chain can be expressed as:
( )
) ( sin ) ( ) exp( 1 ) cos( ) ( ) sin( 3 ) ( 2 2 2 2 3 3 R R Q R R Q R Q R Q R QR QR QR Q Q S g g g g chain core (10)
The intra chain form factor can be expressed as:
45
2 2 2 2 2 2 ) ( ) ( sin ) ( ) exp( 1 ) ( R R Q R R Q R Q R Q Q S g g g g chain chain (11)In contrast matching conditions for which the silica core is matched to see only the polymer corona, the Pedersen expression (equation 7) is reduced to:
( ) ( 1) ( )
) , ( 2 2 2 2 Q S N Q F V N R Q F chain chain chain chain chain SiO pedersen (12) 50
And the total measured intensity I(Q) as:
( ) ( 1) ( )
) ( 2 2 . Q S N Q F V N V QI chain chain chain chain chain
part
(13)
In which the polydispersity can be included by integration of this expression according to the equation 5. In the case of block co-polymer, this model must contain an additional parameter
55
illustrating the inter-diffusion zone between the two polymers and the non possibility for the chain to penetrate into the polymer core must strictly be imposed by choosing an appropriate radial profile for the corona34. It is not necessary in our case as it is physically impossible for the grafted chains to penetrate the silica
60
core and thus simplified the analytical formulation of the model. The expressions of form factor for interacting self-avoiding chains have been derived by Svaneborg and Pedersen on the basement on Monte Carlo simulations35. We do not try to analyse our data with this model as the interactions between the chains in
65
the corona can be neglected regarding the range of the experimental grafting density. To analyze the experimental data, we have developed a home made code under Matlab with a fitting procedure using a least-square regression method. For each form factor model describe below, a routine procedure have been
70
writing including the fitting parameters. The numbers of fitting parameters is model dependent and can be reduced by fixing them to calculated (contrast term) or experimental (silica volume fraction) values when it is possible. The routine is running with various combinations of the adjustable fitting parameters for
75
which a fitting criterion, ², is calculated. All parameters are restricted within a range of values of physical meaning. We repeat the process until obtaining a minimal value of ².
Results
Native silica particles
The control of the aggregation state of the silica Ludox particles after the solvent transfer is checked by comparison of the SANS
5
spectra of a dilute solution of the particle in water (figure 1 [a]) and in Dmac (figure 1 [b]).
Fig. 3 Scattering curves of diluted solution of Ludox Silica particles in
water [a], and in Dmac [b] after solvent transfer. Open circles are
10
experimental data and full line are fit with a polydisperse form factor of spheres.
The scattering curves have been analyzed using the fitting routine corresponding to a polydisperse form factor of spheres (equation 4 and 6, and fitting procedure described in the
15
material and methods section). This model contains four parameters: the silica volume fraction Φ, the contrast term
², the mean sphere radius R and the polydispersity . The contrast term can be calculated and is fixed to reduce the number of fitting parameters (Φ, R, ). The scattering curve
20
of the initial solution of Ludox particles in water is nicely fitted by this model which gives a best fit value for the mean sphere radius equals to 134 Å with a polydispersity equal to 0.18. The solution of the same Ludox silica particles after transferred in the DMAc solvent is also well fitted with the
25
similar polydisperse form factor indicating that the particles are well disperse in the organic solvent, i.e., there is no aggregation due to the change of solvent. It seems us that such stability must be governed by the polarity of the DMAc but we do not discuss more precisely this point since this is
30
currently not the scoop of this paper. The very important result for us is that using a simple solvent transfer procedure, we are able to obtain defined silica particles in a well-dispersed state and in a solvent in which the NMP polymerization of the polystyrene is efficient.
35
Polymerization, chemical characterization and purification
We need to obtain good conversion rates for the polymerization
40
while keeping the control of the colloidal stability during the synthesis to avoid aggregation of the particles. Firstly, we have defined the conditions of synthesis using a model polymerization, without silica particles, to verify the control of the polymerization using the MAMA-NHS and to have an estimate of the conversion
45
rates. The result of this model polymerization (120°C, Mn theoretical
50 000 g/mol and 30% v/v of monomer) of Polystyrene in DMAc is reported on figure 4. Chain molecular weight distribution of the free chain displays a low polydispersity index, less than 1.3, through the whole polymerization.
50
Fig. 4 Evolution of the molecular masse Mw (left, open circles) and
polydispersity index PDI (right, open triangles) as function of the conversion for the model polymerization of polystyrene with NMP polymerization. The red line is a guide for the eyes illustrating the control
55
of the polymerization.
The number average molecular weight Mn varies linearly with
conversion (up to 50%), close to the theoretical line as expected for a controlled polymerization with an efficient initiation. Initially we were interested in changing the molecular weight of
60
the grafted chains by varying the synthesis conditions. This can be done by varying the ratio
monomer initiator
n
n , which corresponds to the theoretical Mn of the polymer chains at 100% of conversion.
Some tests in this direction on model polymerizations reveal that reducing the initiator concentration reduces too much the
efficiency and particularly the control of the polymerization. The other way to increase the theoretical length of the molecular chain is to increase the monomer concentration. This is also not convenient because introducing more styrene in the system changes drastically the polarity of the media resulting in the
5
destabilization of the sol. Some preliminary tests showed us that, for a dilute solution of silica particles (typically 1% v/v), we cannot increase the monomer concentration up to the one deduced from the model polymerization, typically 30% v/v. After the transfer from water to DMAc as detailed previously, the silica
10
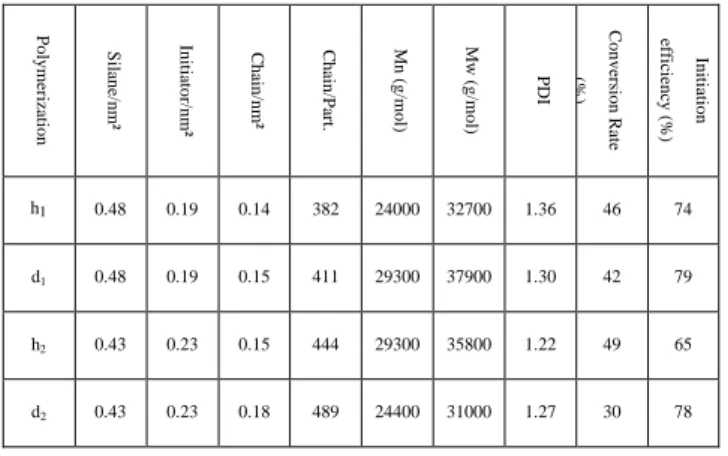
particles were thus first covered with Aminopropyltriethoxysilane and purified from free silane molecules by ultra filtration. The content of silane and silica in the resulting dispersion has been characterized by TGA analysis. Two different batches of silanised silica, entries 1and 2 have been successively synthesized
15
within the same conditions. Results are presented in table 1. The grafting densities of silanes are relatively high and we can note some small differences between the two batches 1 and 2, but the values are nevertheless close enough from each other to be directly comparable. The following step of polymerization, the
20
over-grafting of the initiator (MAMA-NHS), has been conducted also on these two batches. After purification by ultra filtration, the content of grafted organic material has also been characterized by TGA (see table 1) on the two over grafted silica batches.
25
Table 1 Chemical analysis deduced from thermo gravimetric
measurements on the four polymerizations.
P olym er iza ti on Numbe r S il ane /nm ² Init iator /nm ² C ha in/ nm² C ha in/ P ar t. M n (g/m ol) M w (g/m ol) P DI C onve rs ion R ate (%) Initiation ef ficie nc y (% ) h1 0.48 0.19 0.14 382 24000 32700 1.36 46 74 d1 0.48 0.19 0.15 411 29300 37900 1.30 42 79 h2 0.43 0.23 0.15 444 29300 35800 1.22 49 65 d2 0.43 0.23 0.18 489 24400 31000 1.27 30 78
In the final step, the polymerization was achieved on both batches 1 and 2 using the synthesis conditions deduced from the model
30
polymerization: 1% v/v of silica particles, 30% of monomer, and the corresponding quantity of initiator for Mn theoretical = 50 000
g/mol, at 120°C during 6 hours. For the batch number 1, two polymerizations were performed, one with hydrogenated styrene (called h1) and the other with deuterated styrene (called d1), in 35
similar concentration conditions (30% v/v). For the second batch (number 2) two polymerizations were also made. The polymerization using the hydrogenated monomer h-styrene (called h2) was done in similar conditions than for h1 and d1. The
second one using the deuterated monomer d-styrene (called d2) 40
was realized with a lower monomer concentration equal to 18%
v/v because of a lack of deuterated styrene at this time. The results of the evolution of the conversion as a function of time for all polymerizations (h1, d1, h2, d2) are reported in figure 5. For
comparison, the model polymerization is also reported. The
45
representation used, ln([M]0/[M]) as a function of t 2/3
, exhibits for each case a quasi-linear variation indicating a good control and efficiency of the polymerization whatever the batch (1 and 2), and whatever the nature of the monomer (h or d). It shows that chain growth (propagation) is as fast as initiation. We can
50
observe a nice reproducibility (h1, d1 and h2) for the
polymerizations which were synthesized in similar conditions. The final conversion rates are reported in table 1. We can observe a small decrease of the conversion rate in presence of particles as compared to the model polymerization; we also note very similar
55
values for h1, d1 and h2 and a lower value for the d2
polymerization in agreement with the lower value which was taken for the initial monomer concentration. For any polymerization, “sacrificial” free initiator is necessary to initiate the polymerization and to ensure a good control of the chain
60
growth; without the free initiator, the SG1 concentration would be to low to attain the persistent radical effect, thus allowing control. The consequence is the presence of free (non-grafted) polymer chains in the solvent at the end of the synthesis. The grafted nanoparticles can be separated from the free polymer
65
chains by an ultra filtration process. The grafted nanoparticles were analyzed by TGA to evaluate the number of grafted chains per particles. The free polymer chains were analyzed by SEC to determine the molecular weight of the synthesized chains. Previous studies11, 15, 19, 24, 36 shows that the mass of the grafted
70
chains are usually of the same order of magnitude as the molecular of the non grafted chains. Results are presented in table 1.
Fig. 5 Semi logarithmic evolution of the conversion as a function time to
75
the power 2/3 for the whole polymerization: the model (cross), the hydrogenated monomer h1 (open circles), the hydrogenated h2 (full
circles), the deuterated monomer d1 (full triangles) and the deuterated d2
SANS results
After purification, the different batches of grafted silica particles were measured with SANS measurements in dilute conditions (typically around 1% v/v) in both contrast
5
matching conditions.
Grafted particles in polymer matching condition
10
According to the Scattering Length Density values of the components, the matching of the deuterated grafted chains could be achieved with a mixture 1/99 % v/v h-DMAc/d-DMAc. The latter contrast condition implies to exchange all but 1% of the non deuterated DMAc with some deuterated
15
one. A simple dilution by 100 would give too much dilute samples for sufficient scattering. Dialysis would be possible, but would involve large quantities of deuterated solvent, which is costly. For these reasons, we only analyzed the contrast condition corresponding to the matching of the
20
hydrogenated chains. In this case, the contribution of the hydrogenated polymer can be matched with a mixture of hydrogenated and deuterated DMAc equal to 85/15 % v/v. The Deuterated DMAc is added in convenient proportions in the purified solution of the polymerization h1 and put in a 25
quartz Hellma cell of thickness 1mm (due to the high content of protons from the solvent). The particle concentration of the solution (close to 1% v/v) was adjusted to reduce strongly the interaction between the particles and to measure only the particles form factor. The background of the sample,
30
including mainly incoherent scattering, is determined by measuring the pure solvent, the mixture h-DMAc/d-DMAc 85/15 % v/v, in the same conditions. The corresponding flat signal is subtracted from the one of the particle solution as a function of the silica particles concentration Φ as:
35
solvent
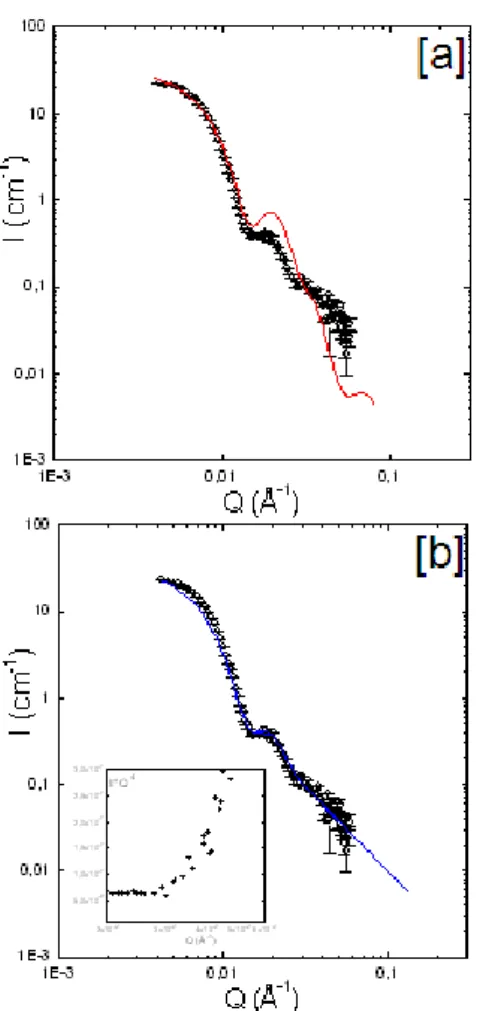
measured I I Q I( ) (1) (14)The resulting signal, i.e. the scattering from hydrogenated polystyrene (h-PS) grafted particles for which the grafted
40
chains are matched is reported on the figure 4. In the low-Q range of the spectra, the curve exhibits a plateau indicating a finite size of the scattering objects and no aggregation of the particles which is the most important information here. In the intermediate Q-range, we see an oscillation and the intensity
45
decreases quickly as function of Q-4 in the large Q-range.
Such variation is mostly encountered in presence of sharp interfaces between a compact object and the external medium, which suggest strongly that the signal is effectively due to the silica particles with no contribution from the polymer corona.
50
The experimental curve was analyzed using the fitting procedure described previously with the following adjustable parameters: the silica volume fraction Φ, the mean radius of the spheres R and the polydispersity σ. The best-fitted calculation is plotted on top of data on the figure 6 [a] (full
55
red line). We can observe a very good agreement between the calculation and the experimental data for Φ = 0.5%, R = 134 Å and σ = 0.18. So when we match the grafted polymer chains on the silica particles, the obtained scattering signal can be fitted with the same polydisperse form factor than the one
60
used for the silica particle before the polymerization process (figure 3[b]). This shows that the polymerization induced no aggregation of the particles and that the chain growth is occurring from the surface of a single particle and not of a cluster of many native particles as in this previous work8. The
65
inter-particles structure factor can be extracted by divided the total intensity with the calculated form factor; result is presented in the insert of the figure 6 [b]. As we can see, the obtained structure factor present a nicely oscillation characteristic of a repulsive liquid-like order of the particles
70
in the solution. This indicate the absence of aggregation between the silica core. Due to low concentration, the range of the interactions is enough long to produce an inter-particle structure factor close to one.
75
Fig. 6 [a] Scattering curve of a dilute solution of grafted silica particles
with hydrogenated PS chains in contrast condition of matching the scattering signal of the PS chains. Open circles are experimental data and the full red line is the best fitted result of the adjustment with a
80
polydisperse form factor of spheres, [b] inter-particle structure factor deduced from the division of the total intensity (experimental data) by the calculated form factor (red curve).
Grafted particles in silica matching condition: hydrogenated grafted chains
To see the corona only, the Scattering Length Density of
5
the silica core on the polymer grafted particles can be matched with a solvent mixture h-DMAc/d-DMAc equal to 53/47 % v/v. We focus first on the dispersions after polymerizations of hydrogenated styrene (h1 and h2). Deuterated DMAc is added
on diluted purified solution of grafted polymer particles in
10
right proportions and put in quartz Hellma cells. The concentration of the particles has been adjusted to reduce the interactions between the objects inducing a structure factor close to unity. As the incoherent contribution is, in this contrast condition, lower due to the higher proportion of
15
deuterated species, we can use cells of optical path of 2 mm to increase the coherent scattering signal while having an acceptable (though not very high) background level. This background is determined by measuring the pure solvent mixture h-DMAc/d-DMAc 53/47% v/v in the same
20
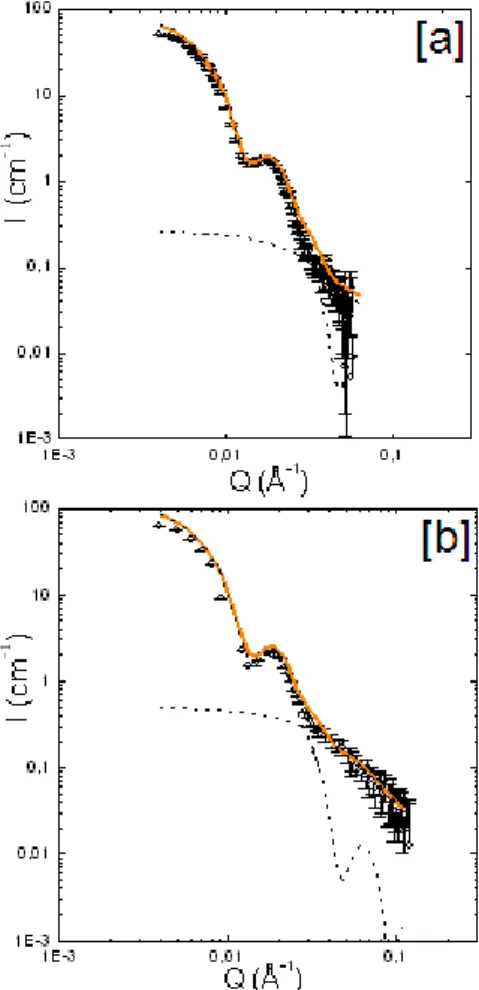
experimental conditions. The resulting flat contribution is subtracted from the coherent one according to the silica particle concentration as in equation 14. The resulting signal of the hydrogenated PS grafted corona is reported on figure 7 for the polymerization h1 and on figure 8 for the 25
polymerization h2. Let us first comment qualitatively the
shape of the curves. In the low Q region, we can observe a flat plateau of the scattered intensity. The inter-particles structure factor, determined previously in the polymer contrast matching condition, has been found to be close to one (see
30
figure 6 [b]).
This is the most robust way to check that there is no effective interaction between the particles and to be in the best conditions of the from factor determination. We can thus assume that this plateau correspond to finite size objects. Its
35
extrapolation to the zero Q limit should give the total mass of the chains in the corona. This is a very safe information, independent of the fitting models. In the intermediate Q-range, we can see a nice oscillation followed by a decrease of the intensity in Q-4. This Q-4 behavior is followed in the large
40
Q range by a decrease of the intensity as function of Q-2. The transition between the Q-4 and the Q-2 regime is illustrated in insert (figure 8[b]) with a Q-4.I versus Q representation. The oscillation is related to the thickness of grafted polymer laye r and the presence of the Q-2 decrease is the signature of
45
Gaussian chain conformation as expected if the grafted chains are swollen by DMAc which is a solvent.
For each polymerization, we used the same approach of fitting first the experimental data with a core-shell model (equation 7) and secondly with the Gaussian chain model (equation 13).
50
The core-shell model is composed of seven adjustable parameters: the particle concentration Φ, the radius of core R, the polydispersity σ, the thickness of the grafted polymer layer e, the scattering length density of the silica core core,
the one of the solvent solvent and the scattering length density 55
of the grafted corona corona. In this contrast condition, the
scattering length of the solvent is equal and fixed to the scattering length density of the silica core: solvent = core. The
scattering length density of the corona is range between the value of the polymer (a pure polymer grafted corona) and the
60
one of the solvent (absence of grafting). In a first step fitting process, the radius R and the polydispersity of the silica core can be fixed to the values deduced from the previous contrast condition (figure 6) in which we see only the silica particles (R=134 Å, σ=0.18). This way permits to reduce the fitting
65
parameters to only three (Φ, e, corona) and thus to limit the
risk of the creation of local minima of the fitting criteria and to obtain values without physical significations.
70
Fig. 7 Scattering curve of a diluted solution of silica Ludox particles
grafted with hydrogenated PS chains (h1) in contrast conditions for which
the scattering contribution of the silica core is matched with a mixture of
75
hydrogenated and deuterated solvent (DMAc). Open circles are experimental data points. The full red line [a] is the best fitted result of the adjustment with a core-shell model and the full blue line [b] is the best fitted result of the adjustment with the Gaussian chain model.
Fig. 8 Scattering curve of a diluted solution of silica Ludox particles
grafted with hydrogenated PS chains (h1) in contrast conditions for which
the scattering contribution of the silica core is matched with a mixture of hydrogenated and deuterated solvent (DMAc). Open circles are
5
experimental data points. The full red line [a] is the best fitted result of the adjustment with a core-shell model and the full blue line [b] is the best fitted result of the adjustment with the Gaussian chain model.
10
Table 2 Best-fitted results parameters of the fitting procedure applied on
the hydrogenated polymerizations h1 and h2 with the two analyzed model,
the core-shell and the Gaussian chain.
M ode l P olym er iz ati on C onc entr at ion Φ % v/v coR re (Å) P olydi spe rs it y S he ll T hickne ss (Å) S he ll P olym er volum e fr ac ti on Gr af ted C ha ins N R g of g ra fted cha ins (Å) Core-shell h1 0.50 134 0.18 98 0.31 - - h2 0.61 134 0.23 118 0.54 - - Gaussian chain d1 0.70 130 0.25 - - 360 58 d2 0.61 134 0.23 - - 485 67
We first use the software to find a minimum of ² as function
15
of the various combinations of the parameters (Φ, e, corona).
The fit can be then refined by letting free the core parameters R and σ also. The same procedure is applied for the Gaussian chain model which is also composed of six parameters: the particle concentration Φ, the contrast term ρchain², the radius 20
of core R, the polydispersity σ, the radius of gyration of the grafted chain Rg and the number of the grafted chains N. The
best fitting curve is the full red line for the core-shell model on figure 7[a] for the polymerization h1 and on figure 8[a] for
polymerization h2. It is the full blue line for the Gaussian 25
chain on figure 7[b] for h1 and 8[b] for h2. The best fitted
parameters deduced from the fitting procedure are reported in table 2. The core-shell model reproduces the experimental data only for the low Q data for which it gives a good estimate of the particle volume fraction, of the global size and
30
molecular mass of the grafted particles (core + polymer corona). The parameters of the core, R and σ, are very consistent with the one deduced form the scattering of the silica particles in solution (figure 6). There is also a good agreement with the chemical analysis results: the
35
polymerization h2 gives a higher conversion rate and larger
chains than the polymerization h1. This difference can be
explained by the fact that the monomer h2 have been distilled
before the polymerization while it was not the case for h1.
This is traduced in the model by a larger thickness of the
40
grafted corona and a higher polymer density in the corona. Nevertheless, the intermediate Q range, the oscillation, and the high Q domain (where the fit decreases very strongly compared to the data) are not well reproduced by the core-shell model.
45
On the contrary to the core-shell model, the results obtained with the Gaussian chain model fit much better the experimental data along the whole Q domain. The particle concentration and the parameter for the core are correctly described. The radiuses of gyration of the grafted chains are
50
very consistent with the molecular masses deduced from the GPC experiments. Applying the well-know relation37 for polystyrene, Rg=0.275.Mw0.5, we should expect to obtain values of the order of magnitude of 50Å, comparable to what we find, 58Å and 67Å. Finally, the number of grafted chains
55
deduced from the fit is also consistent with the one deduced from the chemical analysis. To summarize, among two different models using the same number of adjustable parameters, the grafted hydrogenated PS particles are better described by the Gaussian chain than by the core-shell model.
60
Grafted particles in silica matching condition: deuterated grafted chains
65
Measurements and fitting procedures for the polymerization d1 and d2 have been realized in the same way as described for
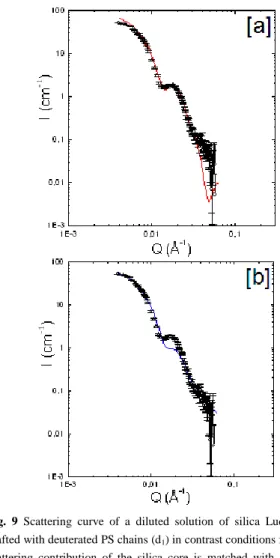
hydrogenated ones. The results are presented in figure 9 for the polymerization d1 and in figure 10 for d2. The shape of the
curve is very similar to the one obtained for grafted chains h1 70
and h2 but we can note a difference which is illustrated in
insert (figure 10[b]) in the I.Q4 versus Q representation: the transition between the Q-4 and the Q-2 decrease of the intensity is shifted toward the larger Q value than for h1 and h2,
typically from 2.8 10-2 to 3.3 10-2 Å-1. In other words the Q-4
5
regime “survives” on a larger range before to “sink” below the Q-2 scattering. The best fitting curve is the full red line for the core-shell model on figure 9[a] for the polymerization d1 and
on figure 10[a] for polymerization d2, the full blue line for the
Gaussian chain model on figure 9[b] for d1 and 10[b] for d2. 10
The best fit parameters are reported in table 3. For each case, the parameters for the core (R, σ) are the one expected from the scattering from the naked particles and the particles concentration, Φ, is the experimental nominal one. The parameters for the Gaussian chain fit are consistent with the
15
chemical analysis: the number of grafted chains and the radius of gyration of the chains are larger for the d1 polymerization.
20
Fig. 9 Scattering curve of a diluted solution of silica Ludox particles
grafted with deuterated PS chains (d1) in contrast conditions for which the
scattering contribution of the silica core is matched with a mixture of hydrogenated and deuterated solvent (DMAc). Open circles are experimental data points. The full red line [a] is the best fitted result of
25
the adjustment with a core-shell model and the full blue line [b] is the best fitted result of the adjustment with the Gaussian chain model.
Fig. 10 Scattering curve of a diluted solution of silica Ludox particles
30
grafted with deuterated PS chains (d2) in contrast conditions for which the
scattering contribution of the silica core is matched with a mixture of hydrogenated and deuterated solvent (Dmac). Open circles are experimental data points. The insert is a Q4.I versus Q representation
illustrating the cross-over between the Q-4 and the Q-2 regime. The full red 35
line [a] is the best fitted result of the adjustment with a core-shell model and the full blue line [b] is the best fitted result of the adjustment with the Gaussian chain model.
Table 3 Best-fitted results parameters of the fitting procedure applied on
the deuterated polymerizations d1 and d2 with the two analyzed model, the 40
core-shell and the Gaussian chain.
M ode l P olym er iza ti on C onc entr ati on Φ % v/v R c o re (Å) P olydi spe rs it y S he ll T hickne ss (Å) S he ll P olym er volum e fr ac ti on Gr af ted C ha ins N R g of gr af ted cha ins (Å) Core-shell d1 0.52 134 0.26 135 0.44 - - d2 1.05 134 0.24 136 0.36 - - Gaussian chain d1 0.52 134 0.26 - - 410 57 d2 1.05 134 0.24 - - 320 48
This is consistent with the larger value of the conversion rate obtained for d1 (42%) in comparison to the one of d2 (30%).
Nevertheless and on the contrary to the hydrogenated case, the Gaussian chain model does not reproduce well the experimental data and in particular, the amplitude of the
5
oscillation. For the deuterated case, the fit with the core -shell model is better. The parameters deduced from the fit, thickness and polymer density of the grafted corona are of the same order of magnitude of the hydrogenated case. There is no significant difference between d1 and d2 even if this is 10
expected regarding the different conversion rates between the two polymerizations.
Fig. 11 Scattering curve of a diluted solution of silica Ludox particles
15
grafted with deuterated PS chains (d1 [a], d2 [b]) in contrast conditions for
which the scattering contribution of the silica core is matched with a mixture of hydrogenated and deuterated solvent (DMAc). The full orange line is the result of the addition of the calculated core-shell model with the Debye simulation of a single chain which are presented in dash line (see
20
text for details).
Although the core-shell model is better than the Gaussian chain model, the agreement is nevertheless not perfect for the whole Q range: the core-shell model decrease as Q-4 at large Q
and the experimental data as Q-2. To account for this behavior, 25
we have built a new model based on our analysis of the respective qualities of the core-shell and of the Gaussian chain model. The idea is to reproduce the curve by addition of the
core-shell model which gives a good agreement at low and intermediate Q values and the behavior of a single grafted
30
chain at large Q values which can be calculated with the Debye formula (equation 9). Note that such chain scattering is, at large Q, close to the one given by the Gaussian chain model. The radius of gyration and the concentration of the grafted chains have been deduced from the fit with the
35
Gaussian chain model. The corresponding calculation is reported on figure 11 together with the best fit results for the core-shell model for d1 (figure 11[a]) and d2 (figure 11[b]).
The sum of these two calculated scattering is reported as an orange full line. We can observe that the agreement with
40
experimental data is now very consistent.
Discussion
The first point of this work is the ability to obtain well -defined silica particles stabilized in an organic medium in
45
which the polymerization of styrene can be efficient. We have been successful in transferring commercial Ludox particles from water into DMAc solvent while keeping the colloidal stability of the particles. The main issue of this transfer is to make now available particles with a well known form factor
50
and a low polydispersity distribution. These informations are of a great importance for characterization of the objects after grafting. The second main improvement is to determine the parameters for the synthesis of polystyrene-grafted-silica nanoparticles in a simplified way (mono-component system)
55
with efficient conversion rate and a good reproducibility. The grafted silica polystyrene particles must be produced in large quantities to be used later as fillers in polymer nanocomposites, the study of which requires many large samples. We chose a method based on Nitroxide-Mediated
60
Polymerisation (NMP): the alkoxyamine which acts as initiator controller agent is bound to the silica nanoparticles surface in two steps. To make the best use of neutron contrast variation techniques, the monomer, styrene, was either normal or deuterated. With the help of model polymerization without
65
silica particles, we could refine the synthesis parameters and obtain around 50% of conversion rate without any aggregation of the sol. The two steps of grafting give us high grafting density of first, the initiator and, second the grafted chains: a mean value of 400 chains/particle, close to 0.2 chain/nm² is
70
satisfactory, as well as the chains molecular mass, around 30 000 Dalton. The whole set of results is consistent with good control and efficiency of the polymerization.
One of the still open questions concerning such polymerization process is the use of free initiator, which in
75
our case also plays the role of control agent. Suppressing or reducing the free initiator could be of interest for varying the mass of the grafted chain but also to ascribe more precisely the radical persistent effect. Moreover and more practically, it could permit to skip the purification step required to remove
80
![Fig. 2 Scheme of the three steps of grafting: the silanization [a], the over-](https://thumb-eu.123doks.com/thumbv2/123doknet/13264663.397008/4.892.470.848.577.952/fig-scheme-steps-grafting-silanization.webp)
![Fig. 3 Scattering curves of diluted solution of Ludox Silica particles in water [a], and in Dmac [b] after solvent transfer](https://thumb-eu.123doks.com/thumbv2/123doknet/13264663.397008/7.892.135.355.240.672/scattering-curves-diluted-solution-silica-particles-solvent-transfer.webp)
![Fig. 6 [a] Scattering curve of a dilute solution of grafted silica particles with hydrogenated PS chains in contrast condition of matching the scattering signal of the PS chains](https://thumb-eu.123doks.com/thumbv2/123doknet/13264663.397008/9.892.441.796.97.952/scattering-solution-particles-hydrogenated-contrast-condition-matching-scattering.webp)