HAL Id: hal-02160541
https://hal.archives-ouvertes.fr/hal-02160541
Submitted on 13 Feb 2021
HAL is a multi-disciplinary open access archive for the deposit and dissemination of sci-entific research documents, whether they are pub-lished or not. The documents may come from teaching and research institutions in France or abroad, or from public or private research centers.
L’archive ouverte pluridisciplinaire HAL, est destinée au dépôt et à la diffusion de documents scientifiques de niveau recherche, publiés ou non, émanant des établissements d’enseignement et de recherche français ou étrangers, des laboratoires publics ou privés.
Similar Cardioventilatory but Greater Neuromuscular
Stimuli With Interval Drop Jump Than With Interval
Running
Guillaume Ducrocq, Thomas Hureau, Olivier Meste, Gregory Blain
To cite this version:
Guillaume Ducrocq, Thomas Hureau, Olivier Meste, Gregory Blain. Similar Cardioventilatory but Greater Neuromuscular Stimuli With Interval Drop Jump Than With Interval Running. Interna-tional Journal of Sports Physiology and Performance, Human Kinetics, 2020, 15 (3), pp.330-339. �10.1123/ijspp.2019-0031�. �hal-02160541�
RESEARCH ARTICLE | Authors’ edition
Similar Cardioventilatory but Greater Neuromuscular Stimuli With
Interval Drop Jump Than With Interval Running
Guillaume P. Ducrocq1, Thomas J. Hureau1,2, Olivier Meste3, Grégory M. Blain1
1 Université Côte d’Azur, LAMHESS, France 2 Université Côte d’Azur, CNRS, I3S, France
Ducrocq GP, Hureau TJ, Meste O, Blain GM Similar Cardioventilatory but Greater Neuromuscular Stimuli With Interval Drop Jump Than With Interval Running
Purpose: Drop-jumps and high-intensity interval-running are relevant training methods to improve explosiveness and endurance performance, respectively. Combined training effects might however be achieved by performing interval-drop-jumping. Our goal was thus to determine the acute effects of interval-drop-jumping on oxygen uptake (V̇ O2) – index of cardioventilatory / oxidative stimulation level, and peripheral fatigue – a limiting factor of explosiveness.
Methods: Thirteen participants performed three 11-min ‘interval-training’ sessions, during which participants ran 15-s at 120% of the velocity that elicited maximal V̇O2 (V̇O2-MAX) (ITRUN) or drop-jumped at 7 (ITDJ7) or 9 (ITDJ9) jumps per 15-s, interspersed with 15-s of passive recovery. V̇O2 and the time spent above 90% of V̇ O2-MAX (TV̇ O2-MAX) were collected. Peripheral fatigue was quantified via pre- to post-exercise changes in evoked potentiated quadriceps twitch (∆QT). Power output was estimated during ITDJs using optical sensors. Results: All participants reached 90% of V̇O2-MAX or higher during ITRUN and ITDJ9, but only eleven did during ITDJ7. TV̇O 2-MAX was not different between ITRUN and ITDJ9 (145±76-s vs 141±151-s; p=0.92) but wasreduced during ITDJ7 (28±26-s; p=0.002). Mean ∆QT in ITDJ9 and ITDJ7 were not different (-17±9% vs -14±8%; p=0.73) and greater than in ITRUN (-8±7%; p=0.001). No alteration in power output was found during ITDJs (37±10 W.kg-1).
Conclusion: Interval-drop-jumping at high work rate stimulated the cardioventilatory and oxidative systems to the same extent than interval-running, while the exercise-induced increase in fatigue did not compromize drop-jump performance. Interval drop-jumping might be a relevant strategy to get concomitant improvements in endurance and explosive performance.
Key words: high intensity interval training, drop-jump,
plyometric exercise, endurance and strength training, neuromuscular fatigue.
Correspondance to : Guillaume P. DUCROCQ. g.ducrocq@live.fr
INTRODUCTION
Exercise performance of many sport disciplines (e.g. team sports, racquet sports, short and mid-distance running, etc.) requires both high endurance and muscle power output capabilities1,2. Usually, these specific physical capabilities are developped separately but the increasing number of competitions in professional athletes significantly reduces the time allocated to physical training. Therefore, improving the time-efficiency of physical training is of critical importance and this goal might be achieved by combining the development of endurance and muscle power / explosiveness within the same physical exercise.
Plyometric jump-training is a well-known and effective training method to enhance the stretch-shortening cycle of muscle function and improve muscle power3-5, jump performance6, agility7, sprint ability5 as well as running economy8. Previous findings9 also suggest that, if effectively designed, this training method might be used to develop maximal oxygen uptake (VO 2-MAX), a key determinant of endurance performance10. Indeed, eight series of ten drop-jumps separated by three minutes of passive recovery can elevate oxygen uptake (V̇O2) up to 83% of V̇O2-MAX9. Given the tight relationship between work rate and O2 uptake11, the pre-requesites of an effective plyometric jump-training approach combining improvements in V̇ O2-MAX and muscle power would be: 1) to perform a high volume of drop jumps at a high work rate to increase the metabolic demand, reach V̇O2-MAX and maximize the time spent above 90% of V̇O 2-MAX (T V̇ O2-MAX) – a threshold beyond which major cardiorespiratory and oxidative adaptations are thought to occur12,13, and 2) to perform 120 drop-jumps per session or above14 with a ground contact time below 260-ms15 and at a high muscle power16 to optimize training effects on muscle power and explosiveness.
High intensity interval running is a training method commonly used by physical trainers and generally accepted as the gold standard approach for V̇O2-MAX development17-21. Replacing the sequences of running by repeated drop jumps (i.e. interval drop-jumping) might be an effective training method to combine improvements in V̇ O2-MAX and muscle power. However, performing drop jumps at a high work rate could impair muscle activation and force / power production - that is fatigue could develop22,23. The mechanisms associated with exercise-induced neuromuscular fatigue involve the alterations of processes within the muscle (i.e. periphera fatigue)24 and/or the central nervous system (i.e. central fatigue)25. Little is known on the time-course of neuromuscular fatigue recovery following a high-volume of drop jumps and on the contribution of peripheral and central fatigue to force recovery. Moreover, fatigue during repeated drop jumps might be associated with a loss of tolerance of stretch loads, a progressive lengthening of the ground contact time and a reduction in muscle power16, which may not be optimal to improve the stretch shortening cycle15,16.
To date, the effects of interval drop-jumping on the time spent above 90% of V̇ O2-MAX, on neuromuscular fatigue and on jumping performance characteristics are unknown. This is crucial because the risk of such a combined training method is, while trying to develop both capabilities at the same time, to finally not stimulate the underlying physiological processes enough to get significant training adaptations in any of these capabilities12,15. The purpose of the present study was thus to test the V̇ O2, neuromuscular fatigue and jump performance responses to interval drop-jumping, during which sequences of repeated drop-jumps at two different jumping frequencies (i.e. two different work rate) were alternated with sequences of passive recovery. We hypothesized that 1) V̇ O2-MAX can be reached during interval drop-jumping at a high work rate and 2) the time spent at V̇O2-MAX is dependent upon the level of work
V̇O2, FATIGUE AND INTERVAL DROP-JUMPING
2
rate and the total amount of work. We also aimed to determine whether the increase in work rate, necessary to elevate V̇O2 to V̇O2-MAX level, would increase neuromuscular fatigue to a degree that would compromize drop jump performance. The responses from interval drop-jumping were then compared to the responses obtained during high-intensity interval running of similar duration.
METHOD Participants.
Nine males and four females participated in this study (age = 21.2 ± 1.9 years [mean ± SD], height = 173.1 ± 9.0 cm, body mass = 67.4 ± 9.4 kg, body fat = 17.1 ± 6.6 %). All participants were students at the faculty of Sport Sciences and trained at least three times per week in team or raquet sports. The study was approved by the local ethics committee and conducted according to the Helsinki Declaration for human experimentation.
Experimental Design.
During two preliminary visits, participants were thoroughly familiarized with testing procedures. The drop height that produced the greatest power output was determined. Participants also performed a maximal incremental exercise test (9-km.h-1 + 0.5-km.h-1 every minute) until voluntary exhaustion on a motorized treadmill (RUN900, Technogym, Rome, Italy) to determine V̇O2-MAX and the minimal velocity that elicits V̇O 2-MAX (vV̇O2-MAX). After 5-min of passive recovery, a constant-workload running test at 105% of vV̇O2-MAX (CW105%) was performed until exhaustion to ensure that the peak V̇O2 (V̇O 2-PEAK) measured during the previous incremental test corresponded to V̇O2-MAX26.
During three separated experimental visits, participants performed an 11 min ‘interval-training sessions’ (IT), during which participants ran (ITRUN) or repeated drop-jumps (ITDJ) for 15-s, alternated with 15-s of passive recovery. No warm up preceded the ITs in order to accurately determine the time to reach V̇ O2-MAX from the start of exercise. During ITRUN, participants ran at a velocity corresponding to 120% of vV̇O 2-MAX. This running speed has been shown to elicit the greatest TV̇O2-MAX during a similar interval running protocol27. During ITDJ, participants dropped and jumped back and forth with their own sport footwear from two stackable plyometric boxes separated by one meter and from the drop height that maximized power output (Fig. 1). To modulate work rate, jumping frequency was set at either 7 (ITDJ7) or 9 (ITDJ9) drop-jumps per 15-s. Participants performed a total of 154 and 198 drop jumps in ITDJ7 and ITDJ9, respectively. Participants were instructed to reach the hard linoleum surface with both feet and to jump as fast and as high as possible toward the box located in front of them. Drop-jump frequency was set by a custom-made soundtrack, with a beep occurring every time the participants had to drop and jump from one box to the other. Neuromuscular testing was performed prior and immediately after the end of every IT. Experimental sessions were performed at the same time of day. To account for potential order effects, a randomized block design was used for the three experimental visits.
Figure 1. Schematic of the interval drop-jumping procedure. Participants dropped and jumped back and forth with their own sport footwear from two stackable plyometric boxes separated by one meter and from the drop height that maximized power output. The frequency at which the participants had to jump was set by a custom sound-track. Note that during the last jump, the participants landed on the floor to quantify power output, jump height and reactive strength index.
Data collection and analysis
Drop-jump height and mechanical performance. Prior to every
maximal incremental exercise test, participants performed a series of drop-jumps with both feet at 20, 30, 40, 50 and 60-cm (random order). Drop-jumps were repeated three times at every height and separated by 1-min of passive recovery. To ensure that performance was maximized during each drop-jump, participants were instructed to jump “as fast and as high as possible”28. Power output, jump height and the reactive strength index were estimated from the ground contact and the flight times, measured by an optical acquisition system (accuracy: 0.001-s; OPTOJUMP, Microgate, Bolzano, Italy)29. The drop height (45 ± 12 cm) that elicited the greatest power output (43 ± 14 W.kg-1) was subsequently used during ITDJ7 and ITDJ928. At this drop height, the jump height (31.4 ± 10.6 cm) and the reactive strength index (1.59 ± 0.6 m.s-1) corresponded to 97.8 ± 3.7 % and 99.1 ± 2.1 % of their maximum value (estimated during the series of drop-jumps from different heights), respectively. During ITDJs, ground contact time was recorded during each jump. Participants were also instructed to land between the optical sensors (i.e. on the floor) following the last jump of every work bout to estimate power output, the jump height, and the reactive strength index.
Exercise responses. Minute ventilation ( V̇ E), breathing frequency (fR), tidal volume (VT), oxygen uptake (V̇O2) and carbon dioxide output (V̇CO2) were measured breath-by-breath at rest and during exercise using a calibrated stationary automatic ergospirometer (MS-CPX, Viasys, San Diego, California, USA). Heart rate (HR) was recorded by a heart rate monitor (RS800CX, Polar Electro, Kempele, Finland) and averaged every 5-s. Blood lactate concentration ([La]b) was determined at rest and 3-min post-exercise by an ampero-metric method (LactatePro, Arkray, Kyoto, Japan) using blood samples collected from a fingertip (5 μl). Rate of perceived exertion was obtained at rest and at every minute during exercise using the Borg’s modified CR10 scale30.
Processing of the gas exchange data. During exercise,
breath-by-breath data were disrupted by occasional errant breaths (e.g. swallows, coughs, sighs), which were not considered as part of the underlying physiological response to exercise. To remove these artifacts, raw data were linearly interpolated to obtain one
Stackable boxes EMG electrodes Heart rate monitor Facemask, pneumotachograph and sampleline for O2 and CO2 measurement
Optoelectric sensors
V̇O2, FATIGUE AND INTERVAL DROP-JUMPING
3
datapoint per second and fitted using an exponential function. The resulting fitted curve was substracted from the raw signal and the data exceeding three times the standard deviation of the residual signal were removed31. TV̇O2-MAX was calculated for every ITs as the time during which V̇O2 was equal to or exceeded 90% of V̇O2-MAX. To test the effect of work rate on TV̇O2-MAX during ITDJs, TV̇O2-MAX was also determined during ITDJ9 when the same amount of work than ITDJ7 was completed (i.e. 154 drop-jumps; ITDJ9 ISO-WORK).
Contractile properties and voluntary activation. For the
assessment of the contractile function, participants were seated on a custom-made bench with a trunk/thigh angle of 135° and the right knee joint angle at 90°. A non-compliant strap attached to a calibrated load cell (model SM-2000N, Interface, Scottsdale, AZ, USA) was fixed to the participant’s right ankle. The cathode electrode (3 x 3 cm, Ag-AgCl, Mini-KR, Contrôle-Graphique, Brie-Comte-Robert, France), was placed on the femoral triangle, at the stimulation site which resulted in both the maximal force output and the maximal amplitude of the compound muscle action potential (MMAX) for the vastus lateralis (VL), vastus medialis (VM) and rectus femoris (RF).
The anode electrode (70 x 50-mm) was placed on the gluteal fold. A constant current stimulator (DS7A, Digitimer, Hertfordshire, United-Kingdom) delivered a square wave stimulus (1-ms) at a maximum of 400 V. To assure maximal spatial recruitment of motor units during the neuromuscular tests, the stimulation intensity (201 ± 30 mA) corresponded to 120% of the intensity eliciting maximal quadriceps twitch and MMAX. For the evaluation of the quadriceps function, potentiated quadriceps twitches were measured 3-s after a maximal voluntary contraction (MVC). Six MVCs, separated by 1-min, were performed prior to every IT. Following exercise, measurements of the neuromuscular function were obtained exactly at 30-s, 1, 2, 4 and 6-min post-exercise. Potentiated quadriceps twitch force evoked by paired 100Hz (QT100), 10Hz (QT10) and single (QTsingle) electrical stimulations of the femoral nerve were elicited 3, 6, and 9-s after each MVC, respectively. For all QT10, QT100, and MVCs, we determined peak force. For all QTsingle, peak force, contraction time to peak force (CT), maximal rate of force development (MRFD, maximal value of the first derivative of the force signal) and half relaxation time (HRT, time to obtain half of the decline in maximal force) were assessed. Superimposed paired stimuli at 100Hz (QT100,superimposed) were delivered during the peak force of each MVC to determine voluntary activation of the quadriceps (VA)32. Voluntary activation was calculated as follows: VA (%) = (1 – QT100,superimposed / QT100) ´100. Quadriceps fatigue was calculated as the difference in evoked twitch force from pre- to post-exercise and expressed as a percent change from pre-exercise (ΔQTsingle, ΔQT10, and ΔQT100). A decrease in the ratio QT10 / QT100 (QT10:100) was used as an index of low-frequency fatigue33.
Surface electromyography (EMG). Electrical activity of the
right VL, VM and RF was recorded by pairs of Ag/AgCl surface electrodes (diameter = 10 mm; inter-electrode distance = 20 mm; impedance = 1.7 ± 0.8 kΩ) placed on the muscle belly and connected to an EMG system (Octal Bio-Amp, ML138, AdInstrument, Bella-Vista, Australia). The reference electrode was placed on the right lateral tibial condyle. EMG signals were amplified (gain = 20 mV), filtered (bandwidth frequency, 0.03 Hz – 1 kHz), and recorded (sampling frequency, 4 kHz) using a
commercially available software (Labchart 7, ADInstruments, Bella-Vista, Australia). Each burst onset and offset of the rectified EMG signal recorded during each work bout of every IT was determined. The root mean square (RMS) of each burst from the EMG signal was calculated, normalized to the RMS recorded during pre-exercise MVC (RMS%MVC) and averaged. RMS during each MVC was calculated as the average value over a 0.5-s interval during the plateau phase of the MVC34. Statistical analysis.
Data presented in the results section are expressed as mean ± SD. Normality of every dependent variable and homogeneity of the variance of the distributions were confirmed using the Kolmogorov-Smirnov test and the Levene test, respectively. Reliability of V̇O2-MAX and vV̇O2-MAX determined from the two maximal incremental exercise tests was tested by verifying that both samples did not differ using Student’s paired t-test and by evaluating how strongly these samples resembled to each other using intraclass correlation coefficients (ICC) and coefficients of variation35. Reliability was considered excellent, good, fair and poor when ICC was > 0.75, 0.75 - 0.60, 0.60 - 0.40, and < 0.40, respectively36. A multivariate analysis (MANOVA) was conducted on our dependent variables to protect against the risk of type I error arising from multiple comparisons37. A significant (p < 0.01) condition ´ time effect was found for both the exercise and post-exercise recovery dataset. Then, two-way ANOVAs with repeated measures were used to test for condition effect across time. In addition, a one-way ANOVA with repeated measures was used to determine differences across conditions on absolute values of TV̇O2-MAX, time to reach 90% of V̇ O2-MAX, ∆V̇ O2 and [La]b. When a significant difference was found, multiple comparisons analysis was performed using the Tukey’s HSD test. Effect size was assessed using partial eta-squared (η2). Statistical analyses were conducted using Statistica 8.0 (StatSoft, Inc., Tulsa, OK, US). Statistical significance was set at p < 0.05.
RESULTS
Determination of 𝑉̇O2-MAX and v𝑉̇O2-MAX. V̇O2-PEAK, peak HR and [La]b recorded during every exercise trial are presented in Table 1. No significant difference was observed in V̇O2-PEAK during maximal incremental exercise tests and subsequents CW105% (p=0.19), showing that V̇O2-PEAK corresponded to V̇O 2-MAX. No significant difference (p=0.90) and “excellent” reliability (ICC>0.974, CV<1.9 %) were found for V̇O2-MAX and vV̇O2-MAX between the two maximal incremental exercise tests. Thus, V̇O2-MAX and vV̇O2-MAX were calculated as the average of the V̇O2-MAX and the vV̇O2-MAX reached during the two tests, and equaled 55 ± 7 ml.min-1.kg-1 and 14.4 ± 1.8 km.h-1, respectively. Gas exchange and cardioventilatory variables. As shown in
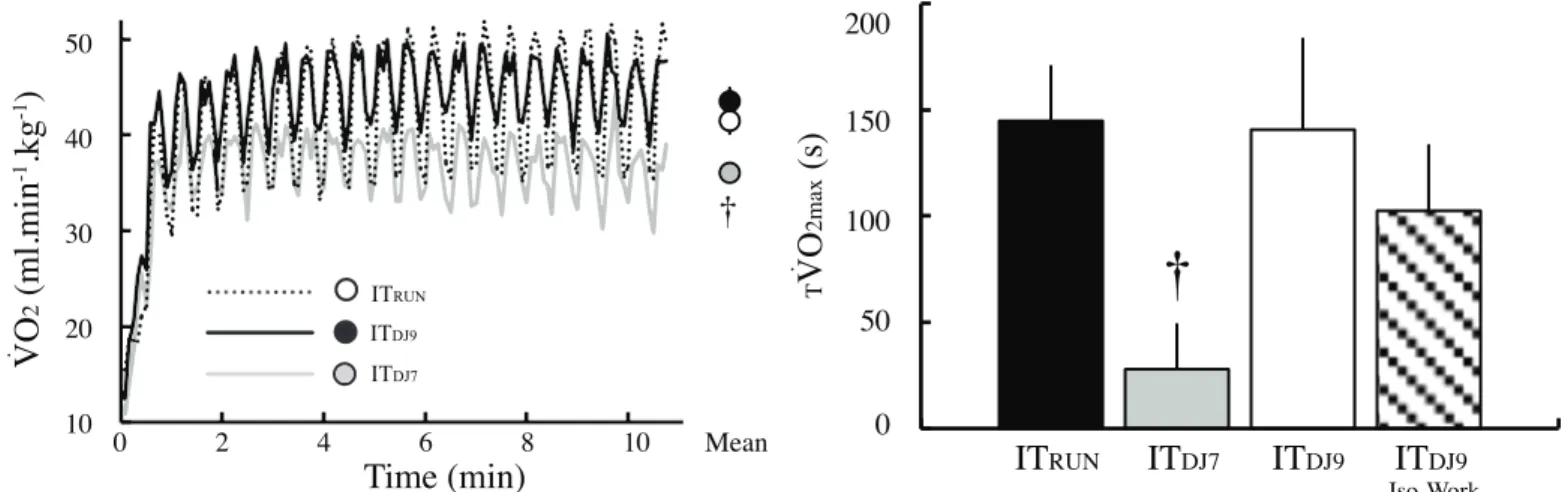
Figures 2-3, V̇ O2 (p=0.94), V̇ CO2 (p=0.97), V̇ CO2.V̇ O2-1 (p=0.94), V̇E (p=0.95), V̇E.V̇ CO2-1(p=0.99), fR (p=0.14), VT (p=0.14) and HR (p=0.37) responses to exercise were not different between ITDJ9 and ITRUN but lower during ITDJ7 (p=0.001, η2>0.41). Moreover, no significant difference in V̇O 2-PEAK was found between ITDJ9 compared to ITRUN (p=0.64). All participants reached 90% of V̇O2-MAX during ITRUN and ITDJ9, while only 11 didduring ITDJ7. During ITRUN and ITDJ9, the time to reach 90% of V̇O2-MAX (180 ± 116 s vs 122 ± 117 s; p=0.30), TV̇O2-MAX (145 ± 76 s vs 141 ± 151 s; p=0.91) were not different between conditions. During ITDJ7, the time to reach 90% of
Figure 2. Oxygen uptake and time spent above 90% of maximal oxygen uptake during interval running and drop-jumping. Individual V̇O2 data were averaged every 5 s and are shown as a group mean in the left panel. Time spent above 90% of V̇O2-MAX (TV̇O2-MAX) is
presented in the right panel as mean ± SE. ITRUN, high intensity interval running at 120% of the velocity that elicited the maximal oxygen uptake;
ITDJ9, interval drop-jumping at 9 drop-jumps per 15 s ; ITDJ7, interval drop-jumping at 7 drop-jumps per 15 s . Error bars were omitted from the
V̇O2 time-course in the left panel graph to aid clarity. † Indicates significant difference in ITDJ7 compared to ITRUN and ITDJ9 on the mean data (p
< 0.05). No significant difference was found between ITDJ9 and ITRUN.
0 2 4 6 8 10 Mean 10 20 30 40 50
Time (min)
VO
2(m
l.m
in
-1.kg
-1)
. ITDJ7 ITDJ9 ITRUNIT
DJ7IT
RUNIT
DJ9†
0 50 100 150 200 TVO
2max(s
)
.IT
DJ9 Iso-Work†
38 36 34 32 30 28 26V
E.VCO
2 -1.
.
0 2 4 6 8 10 MeanTime (min)
V
E(l
.m
in
-1)
100 80 60 40 20 50 40 30 20 10VCO
2(m
l.m
in
-1.kg
-1)
.
1.1 1.0 0.9 0.8 0.7 0.6.
f
R(b
re
at
hs
.m
in
-1)
50 40 30 20 200 180 160 140 120 100H
R
(b
ea
ts
.m
in
-1)
0 2 4 6 8 10 MeanTime (min)
ITDJ7 ITDJ9 ITRUN†
†
†
†
†
†
VCO
2.VO
2 -1.
.
†
†
†
†
†
†
V̇O2, FATIGUE AND INTERVAL DROP-JUMPING
5
Figure 3 (previous page). Gas exchange and cardioventilatory responses to interval running and drop-jumping.
Individual gas exchange and cardioventilatory data were averaged every 5 s and represented as a group mean. V̇CO2, CO2 output; V̇E, minute
ventilation; fR, respiratory frequency; HR, heart rate; ITRUN, high intensity interval running at 120% of the velocity that elicited the maximal
oxygen uptake; ITDJ9, interval drop-jumping at 9 drop-jumps per 15-s; ITDJ7, interval drop-jumping at 7 drop-jumps per 15-s . Error bars were
omitted from the time-course data to aid clarity. † Indicates significant difference in ITDJ7 compared to ITRUN and ITDJ9 during exercise and on the
mean data(p < 0.05). No significant difference was found between ITDJ9 and ITRUN.
V̇O2-MAX (120 ± 88 s) was not different than ITRUN and ITDJ9, whereas TV̇ O2-MAX (23 ± 26 s) was significantly reduced (p=0.001, η2=0.47). T V̇ O2-MAX during ITDJ7 was also significantly reduced (p = 0.05) compared to ITDJ9 ISO-WORK (103 ± 113 s), when a similar amount of work was completed in both conditions (i.e. 154 drop-jumps). Increasing the amount of work from 154 to 198 drop jumps in ITDJ9 increased TV̇O2-MAX (i.e. from 103 ± 113 s to 141 ± 151 s), but this difference did not reach statistical significance (p = 0.58). [La]b was significantly lower after ITDJ9 and ITDJ7 compared to ITRUN (p=0.001, η2=0.81; Table 1).
Table 1. Work duration and peak physiological responses to incremental, constant workload and interval training exercises
Visits duration Work
(s)
V̇O2-PEAK
(ml.min-1.kg-1) (beats.minHR-PEAK -1) (mmol.l[La]b-1)
st max test 822 ± 274 55.4 ± 6.7 182 ± 11 11.2 ± 2.1 1st CW 105% 150 ± 14 55.7 ± 6.7 186 ± 7 - 2nd max test 810 ± 274 55.3 ± 7.2 182 ± 11 10.7 ± 1.8 2nd CW105% 161 ± 14 56.0 ± 6.6 184 ± 18 - ITRUN 330 54.3 ± 6.7 182 ± 11 7.4 ± 2.2* ITDJ9 330 55.7 ± 7.3 184 ± 18 5.4 ± 1.8*† ITDJ7 330 45.2 ± 6.4*†# 175 ± 14*†# 3.1 ± 1.5*†#
Work duration calculated for interval training exercise (i.e. 330s) corresponded to the
sum of 22 sets of 15s work. V̇O2-PEAK, peak oxygen uptake; HR-PEAK, peak heart rate;
[La]b, blood lactate concentration; max test, maximal incremental exercise test;
CW105%, constant work load trial at 105% of the velocity that elicited V̇O2-PEAK during
the previous maximal incremental exercise test; ITRUN, high intensity interval running
at 120% of vV̇O2-MAX; ITDJ9, interval drop-jumping at 9 drop-jumps per 15-s ; ITDJ7,
interval drop-jumping at 7 drop-jumps per 15-s. No significant physiological difference was found between the first and second maximal incremental exercise test as well as between a given maximal incremental exercise test and the subsequent
CW105%. *, significantly different from the maximal incremental exercise test (p <
0.05); †, significantly different from ITRUN (p < 0.05); #, significantly different from
ITDJ9 (p < 0.05).
Surface electromyography. Exercise had no effect on VL MMAX (p=0.26, η2=0.10) and VM MMAX (p=0.08, η2=0.13), while a significant exercise-induced reduction in RF MMAX (p=0.002, η2=0.29) was found in ITDJ9. During exercise, VL RMS%MVC (p=0.001, η2=0.61), VM RMS%MVC (p=0.03, η2=0.26)andRF RMS%MVC (p=0.001, η2=0.57) were significantly greater during ITDJ9 and ITDJ7 compared to ITRUN (Fig. 4). No significant difference was found between ITDJ9 and ITDJ7 (VL RMS%MVC: p=0.75; VM RMS%MVC: p=0.95; RF RMS%MVC: p=0.99). Fatigue variables. As presented in Table 2 and Figure 5, MVC
, VA, QTsingle, QT10, QT10:100, CT and HRT were significantly impaired following interval running and drop-jumping (p<0.001, η2>0.25), whereas QT100 (p=0.03, η2=0.13) was reduced following ITDJ9 only. Significant reductions in MRFD were also found following ITDJ9 and ITDJ7 (p<0.001, η2=0.30). ∆QTsingle (p=0.73), ∆QT10 (p=0.99), ∆QT10:100 (p>0.88) and ∆MRFD (p=0.90) were not different after ITDJ9 and ITDJ7 but significantly greater compared to ITRUN (p<0.001). No significant between-condition difference was found for ∆MVC (p=0.93, η2<0.01), ∆VA (p=0.30, η2<0.10), ∆QT100 (p=0.09, η2=0.18), ∆CT (p=0.43, η2=0.06) and ∆HRT (p=0.54, η2=0.05).
Figure 4. Quadriceps electromyographic amplitude during interval running and drop-jumping.
Data are presented as mean ± SE. Muscle activation was calculated as the root mean square (RMS) of each burst recorded during exercise. These data were averaged for each work bout and normalized by the RMS calculated during pre-exercise maximal voluntary isometric contractions (RMS%MVC). VL, vastus lateralis; VM, vastus medialis; RF, rectus femoris; ITRUN, high intensity interval running at 120% of the velocity that elicited the maximal oxygen uptake; ITDJ9, interval drop-jumping at 9 drop-jumps per 15-s ; ITDJ7, interval drop-jumping at 7 drop-jumps per 15-s . † indicates significant difference in ITRUN compared to ITDJ7 and ITDJ9 during exercise and on the mean data (p < 0.001). No significant difference was found between ITDJ7 and ITDJ9 110 100 90 80 70 ITDJ9 ITRUN ITDJ7 150 130 110 90 70 100 90 80 70 60 0 2 4 6 8 10 Mean
Times (min)
R
F R
M
S
% M V C(%)
V
M
R
M
S
% M V C(%)
V
L R
M
S
% M V C(%)
†
†
†
†
†
†
Table 2. Effects of interval running and drop-jumping on the neuromuscular function.
ITRUN ITDJ7 ITDJ9
Baseline Post-exercise Baseline Post-exercise Baseline Post-exercise
MVC, N Δ% 598 ± 137 559 ± 127 * -6 ± 7 581 ± 138 547± 125* -5 ± 7 594 ± 147 558 ± 141* -6 ± 5 VA, % Δ% 87 ± 10 77 ± 12 * -12 ± 7 87 ± 7 74 ± 10 * -15 ± 9 87 ± 9 74 ± 11 * -15 ± 5 QTsingle, N Δ% 204 ± 37 187 ± 34 * -8 ± 7 198 ± 34 170 ± 37 *† -14 ± 8 † 204 ± 38 170 ± 33 *† -17 ± 9 † QT10, N Δ% 291± 60 242 ± 51 * -17 ± 6 282 ± 62 216 ± 62 *† -24 ± 11 † 293 ± 62 217 ± 53 *† -26 ± 9 † QT100, N Δ% 262 ± 45 259 ± 48 -2 ± 6 260 ± 50 252 ± 57 -4 ± 9 263 ± 54 243 ± 45 *† -7 ± 9 QT10:100, N Δ% 1.11 ± 0.11 0.94 ± 0.12 * -15 ± 6 1.09 ± 0.11 0.86 ± 0.13 *† -21 ± 7 † 1.12 ± 0.09 0.89 ± 0.12 *† -20 ± 6† CT, ms Δ% 114 ± 4 109 ± 3 * -4 ± 2 114 ± 4 110 ± 4 * -4 ± 2 114 ± 3 109 ± 4 * -4 ± 2 MRFD, N.ms-1 Δ% 1.8 ± 0.3 1.7 ± 0.3 -4 ± 7 1.7 ± 0.1 1.6 ± 0.3 *† -11 ± 8 † 1.8 ± 0.3 1.6 ± 0.3 *† -13 ± 9 † HRT, ms Δ% 80 ± 27 46 ± 9 * -40 ± 12 74 ± 28 43 ± 7 * -37 ± 16 77 ± 29 44 ± 7 * -38 ± 16 VL MMAX, mV Δ% 13.8 ± 4.2 14.2 ± 4.7 2 ± 6 13.3 ± 4.5 13.6 ± 4.2 4 ± 8 13.6 ± 4.3 13.8 ± 4.7 1 ± 8 VM MMAX, mV Δ% 17.4 ± 4.3 17.0 ± 3.7 -2 ± 6 16.8 ± 4.0 15.7 ± 3.5 -7 ± 5 17.0 ± 3.9 16.0 ± 4.3 -7 ± 7 RF MMAX, mV Δ% 5.4 ± 1.6 5.2 ± 1.7 * -3 ± 5 5.7 ± 1.4 5.6 ± 1.3 -1 ± 6 5.5 ± 1.3 5.2 ± 1.3* -6 ± 8 ‡
ITRUN, high intensity interval running at 120% of the velocity that elicited the maximal oxygen uptake; ITDJ9, interval drop-jumping at 9 drop-jumps per 15 s ; ITDJ7, interval
drop-jumping at 7 drop-jumps per 15 s ; MVC, maximal voluntary isometric contraction; VA, voluntary activation of the quadriceps; QTsingle, QT10 and QT100 represent the
potentiated quadriceps twitch evoked by single, 10 Hz-paired and 100 Hz-paired electrical stimulation of the femoral nerve, respectively; QT10:100, low-frequency fatigue ratio
(QT10 / QT100); MRFD, maximal rate of force development; CT, contraction time; HRT, half relaxation time; MMAX, maximal amplitude of the compound muscle action
potential; VL, vastus lateralis; VM, vastus medialis; RF, rectus femoris; Δ%, Δ percentage change from baseline. Post-exercise values corresponded to the average of the data measured from 30 s through 6 min after the end of exercise. * Indicates significant difference from baseline measurements (p < 0.01); † Indicates significant difference from ITRUN (p < 0.05); ‡ Indicates significant difference from ITDJ7 (p < 0.05);
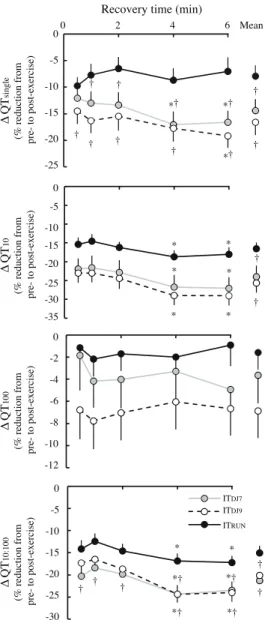
Figure 5 (left). Percent change in peripheral fatigue indices following interval running and drop-jumping.
Data are presented as mean ± SE. Post-exercise values were measured from 30-s through 6-min after the end of exercise. QTsingle, QT10 and QT100 represent the potentiated quadriceps twitch evoked by single, 10 Hz-paired and 100 Hz-paired electrical stimulation of the femoral nerve, respectively. QT10:100, low-frequency fatigue ratio (QT10 / QT100); ITRUN, high intensity interval running at 120% of the velocity that elicited the maximal oxygen uptake; ITDJ9, interval drop-jumping at 9 drop-jumps per 15-s ; ITDJ7, interval jumping at 7 drop-jumps per 15-s . * indicates significant difference compared to the post-exercise value measured at 30-s; † indicates significant difference compared to ITRUN (p < 0.05). Note that exercise-induced reductions in QT100 were not significantly different from baseline following ITRUN and ITDJ7.
Following ITRUN and ITDJs, ∆QT10 and ∆QT10:100 significantly decreased during the post-exercise recovery period (p=0.002). Similar reduction during recovery were found in ∆QTsingle for ITDJ7 and ITDJ9 only (p<0.001).
Mechanical performance during interval drop-jumping. No
difference between ITDJ7 and ITDJ9 (p=0.08, η2=0.11) were found for the ground contact time, power output, jump height and the reactive strength index (Figure 6). No time effect was also found for ground contact time and power output (p=0.09,
η2<0.10). A significant time effect was found for reactive strength index (p=0.01, η2=0.14) and jump height (p=0.04, η2=0.12) but post-hoc analysis did not reveal a significant difference between the first and the following datapoints, suggesting that drop-jumping performance was unaltered over time.
Rate of perceived exertion. During ITRUN and ITDJ9, RPE increased linearly throughout exercise, from 1.3 ± 0.9 and 1.4 ± 1.0 to 6.4 ± 2.2 and 6.8 ± 2.0, respectively. No difference was
0 -5 -10 -15 -20 -25 0 2 4 6 ∆ QT single (% reduction from pre- to p os t-e xe rc ise )
Recovery time (min)
Mean 0 -5 -10 -15 -20 -25 -30 -35 ∆ QT 10 (% reduction from pre- to p os t-e xe rc ise ) 0 -2 -4 -6 -8 -10 -12 ∆ QT 100 (% reduction from pre- to p os t-e xe rc ise ) 0 -5 -10 -15 -20 -25 -30 ∆ QT 10:100 (% reduction from pre- to p os t-e xe rc ise ) ITDJ7 ITDJ9 ITRUN † † † * † † † † * * * * * * * * *† *† † † † *† *† † † † † † *† *† †
V̇O2, FATIGUE AND INTERVAL DROP-JUMPING
7
found between conditions (p=0.80). During, ITDJ7, RPE also increased linearly (from 1.4 ± 1.1 to 4.2 ± 1.4) but remained lower (p=0.03) than ITDJ9 and ITRUN from the 3rd to the last work bout.
DISCUSSION
Our findings showed that an 11-min bout of interval drop-jumping at 9 drop-jumps per 15-s, elicited TV̇O2-MAX that was not differentthan high-intensity interval running. Reducing the work rate from 9 to 7 drop-jumps per 15-s, significantly decreased the V̇O2 response to exercise. Quadriceps EMG and exercise-induced neuromuscular fatigue were higher during interval drop-jumping compared to interval running, indicating that the neuromuscular system was activated and stimulated to a higher extent during interval drop-jumping. This greater stimulation of the neuromuscular system did not however compromise jump performance during interval drop-jumping. Our results therefore confirmed our hyptoheses and suggest that interval drop-jumping at a high work rate (i.e. 9 drop-jumps per 15-s) might be an effective method to produce concomitant cardioventilatory and neuromuscular adaptations, which is particularly relevant to many sports requiring both endurance and muscle power capabilities.
Effect of interval running and drop-jumping on the time spent at 𝐕̇O2-MAX.
Our results showed that gas exchange and cardioventilatory responses to exercise during ITDJ9 was not different than ITRUN (Fig. 2 and 3). Moreover, no significant difference in TV̇ O2-MAX, a key determinant of V̇ O2-MAX improvement with training12,13,38,39, was found between ITDJ9 and ITRUN. Our findings therefore indicate that, the repetition of 192 drop jumps – a training method commonly used during physical training to improve explosive performance3-5 -, was effective when performed at a work rate of 9 jumps per 15-s to stimulate the cardiorespiratory and oxydative systems to levels that are known to produce long term positive adaptations with training12,13,38,39. Our results extend previous findings from Brown et al.9, which showed that participants reached 83% of V̇O2-MAX during eight series of ten drop-jumps (height: 80 cm), with three minutes of passive recovery between series. Our findings showing that TV̇O2-MAX was greatly improved in ITDJ9 and ITDJ9-ISO WORK compared to ITDJ7 indicate that the metabolic and cardioventilatory response to repeated drop-jumps is critically dependent on the work rate. Therefore, the improved V̇O2 response in our study compared to the abovementioned study is likely due to 1) the shorter recovery duration between work bouts (i.e. 15-s vs. 3-min) and 2) a higher number of jumps per minute, which contributed to increase the work rate and prevent a fall in V̇O2 during recovery (Fig. 2).
Our results showed that, despite similar work / recovery intensity and duration, TV̇O2-MAX in ITRUN was less than previously reported by Dupont et al. (145 ± 76 s vs 323 ± 172 s )27. Differences in the warm-up protocol (with vs without), the exercise termination modality (exhaustion vs eleven minutes) and in the running surface (track vs treadmill) likely explain the discrepancies between Dupont et al.27 and our study, respectively.
Figure 6. Ground contact time, power output, jump height and reactive strength index measured during interval drop-jumping at different jump frequencies.
Data are presented as mean ± SE. Ground contact time was measured during each drop-jump and averaged for each work bout. Power output, jump height and reactive strength index were measured during the last drop-jump of each work bout. ITDJ9, interval drop-jumping at 9 drop-jumps per 15-s ; ITDJ7, interval drop-jumping at 7 drop-jumps per 15-s . Note that no significant alteration in performance over time and no significant difference between conditions were found.
45 40 35 30 0 2 4 6 8 10 Mean Time (min) Power output (W .kg -1 ) 0 2 4 6 8 10 Mean ITDJ7 ITDJ9 G ro un d c on ta ct ti m e ( m s) 270 250 230 210 190 1.0 1.2 1.4 1.6 1.8 0 2 4 6 8 10 Mean R ea ct iv e s tre ng th in de x ( m .s -1 ) 0 2 4 6 8 10 Mean 35 30 25 20 Ju m p h ei gh t ( cm )
V̇O2, FATIGUE AND INTERVAL DROP-JUMPING
8
Effect of interval running and drop-jumping on exercise-induced neuromuscular fatigue
Our results showed that quadriceps force was significantly impaired after ITRUN and ITDJs (Fig. 5). The exercise-induced reductions in potentiated twitch force as well as in voluntary activation suggest that the reduction in MVC peak force was caused by the alteration of processes within the working muscles (i.e. peripheral fatigue) and within the central nervous system (i.e. central fatigue)24,25.
Absence of exercise-induced reductions in VL and VM MMAX indicates that the reduced potentiated twitch force following exercise was unlikely related to a reduced membrane excitability40. In contrast, the decrease in ∆QT10:100 indicates that the main cause of peripheral fatigue was likely a failure of the excitation-contraction coupling within the working muscles41. Moreover, the absence of potentiated twitch force recovery following ITs suggest that the observed peripheral fatigue was not mainly attributable to metabolic disturbances in energy-rich phosphates and pH – which are readily reversible42. Rather, the relatively preserved ∆QT100 associated with the progressive reduction in ∆QT10 and ∆QT10:100 during the recovery period (Fig. 5) suggest that mechanisms related to prolonged low-frequency force depression (e.g. free radicals accumulation and/or muscle damage) have mainly contributed to the observed failure of the excitation-contraction coupling33,43. The absence of any increase in the ground contact time or any reduction in power output, jump height and reactive strength index during ITDJs, suggest however that the exercise-induced fatigue was not sufficient to compromise drop-jumping performance. In contrast, a ~80% and ~30 % reduction in the potentiated quadriceps twitch force evoked with low and high frequency doublets were found following a series of 100 drop jumps at a 50-cm drop height (vs. 22% and 7% in the present study)44. This was associated with a ~12 % reduction in jump height that persisted for at least 3 days. The much larger reduction in the evoked force by low frequency doublets and in the low frequency fatigue ratio in the above-mentioned study (corresponding to QT10 and QT10:100 in the present study, respectively) suggests that the higher drop height significantly increased prolonged low frequency fatigue and muscle damages44,45, therefore compromizing performance.
The greater reduction in potentiated twitch force after ITDJs compared to ITRUN coincided with a 25 to 45% higher EMG amplitude (Fig. 4) – indicative of a higher muscle activation46, as well as a larger decrease in ∆QT10:100. We thus interpret these findings to indicate that the increased ‘neural’ drive to the working muscles during drop-jumping compared to running likely elicited the recruitment and the subsequent fatigue of a larger number of the highly fatigable fast-twitch motor units47. Moreover, given the greater reduction in ∆QT10:100 afterITDJs compared to ITRUN, the recruited motor units were more sensitive to prolonged low-frequency force depression following ITDJs.
Both running and drop-jumping involve the activation and the contraction of different muscles groups (e.g. the plantar flexors)48 which might be activated and fatigue differently than the quadriceps during interval running and drop-jumping. The absence of reduction in drop jump performance indices during ITDJs suggest however that the net fatigue effect of the involved locomotor muscles was not sufficient to compromise the participant’s drop-jumping capabilities. Alternatively, the coordination of these locomotor muscles might have been
adapted by the central nervous system in response to fatigue development in the quadriceps in order to preserve drop jumping performance 49.
Practical Applications
Our results showed that interval drop-jumping at a work rate corresponding to 9 drop-jumps per 15-s is a suitable exercise to elicit and spend time above 90% of V̇O2-MAX, a threshold beyond which major cardiorespiratory and oxidative adaptations are thought to occure.g., 12,13,38,39. In addition, we found that a high volume of drop-jumps (n = 198 in ITDJ9) can be performed within a short period of time (11 min) without compromising power output, ground contact time (which remained well below 260-ms15,16), jump height and the reactive strength index throughout exercise (Fig. 6). Because a high volume of drop jumps (i.e. 120 or above) and a high level of power output are prerequisites for optimized plyometric training effects14-16, these findings suggest that explosive and reactive strength might also be enhanced following 11 minutes of interval drop-jumping. Finally, the higher degree of peripheral fatigue and quadriceps EMG found after ITDJs showed that the neuromuscular system was activated and stimulated to a greater extent compared to interval running. Thus, interval drop-jumping may have complementary training effects – e.g. increase in V̇O2-MAX, vV̇O2-MAX, explosive and reactive strength, jump height – that would benefit performance in sports requiring both endurance and muscle power (e.g. team sports, racket sports, mid-distance runners, etc.). Further research on the chronic effects of interval drop-jumping is however warranted to confirm this hypothesis.
CONCLUSION
Our results showed that interval drop-jumping allowed participants to spend a significant amount of time at V̇O2-MAX and elicited peripheral fatigue without compromising drop-jumping performance, which are key determinants of oxydative, cardioventilatory and neuromuscular adaptations to training. A high work rate (i.e. at least 9 jumps per 15-s) and a large amount of work (i.e. ~200 drop-jumps) is however required to achieve a similar metabolic demand during interval drop-jumping compared to high intensity interval running. Together our findings suggest that interval drop-jumping might be a relevant training method to combine endurance and muscle power enhancements in a minimum amount of time, therefore improving time-efficiency during physical training.
Additional information Competing interest
The authors have no conflicting interests.
Fundings
This study was supported by funding from the “Région Provence Alpes Côte d’Azur” (14APR001ECSR and 13BDE001ACSR) and the French Ministry of Higher Education grant (CIFRE 2012/0445).
REFERENCES
1. Spencer M, Bishop DJ, Dawson B, Goodman C. Physiological and
Metabolic Responses of Repeated-Sprint Activities. Sports Med 2005;35:1025– 44.
2. Ben Abdelkrim N, Fazaa El S, Ati El J. Time-motion analysis and
physiological data of elite under-19-year-old basketball players during competition. Br J Sports Med 2007;41:69–75.
V̇O2, FATIGUE AND INTERVAL DROP-JUMPING
9
3. Alkjaer T, Meyland J, Raffalt PC, Lundbye-Jensen J, Simonsen EB.
Neuromuscular adaptations to 4 weeks of intensive drop jump training in well-trained athletes. Physiol Rep 2013;1:e00099.
4. Chelly MS, Ghenem MA, Abid K, Hermassi S, Tabka Z, Shephard
RJ. Effects of in-season short-term plyometric training program on leg power, jump- and sprint performance of soccer players. J Strength Cond Res 2010;24:2670–6.
5. Sáez de Villarreal E, Requena B, Cronin JB. The effects of
plyometric training on sprint performance: a meta-analysis. J Strength Cond Res 2012;26:575–84.
6. Markovic G. Does plyometric training improve vertical jump height?
A meta-analytical review. Br J Sports Med 2007;41:349–55–.
7. de Villarreal ES-S, Gonzalez-Badillo JJ, Izquierdo M. Low and
moderate plyometric training frequency produces greater jumping and sprinting gains compared with high frequency. J Strength Cond Res 2008;22:715–25.
8. Turner AM, Owings M, Schwane JA. Improvement in running
economy after 6 weeks of plyometric training. J Strength Cond Res 2003;17:60– 7.
9. Brown GA, Ray MW, Abbey BM, Shaw BS, Shaw I. Oxygen
consumption, heart rate, and blood lactate responses to an acute bout of plyometric depth jumps in college-aged men and women. J Strength Cond Res 2010;24:2475–82.
10. Joyner MJ, Coyle EF. Endurance exercise performance: the
physiology of champions. J Physiol (Lond) 2008;586:35–44.
11. Asmussen E, Fenn WO, Rahn H. Muscular Exercise. In: Handbook
of Physiology. Washington, DC: 1965. pages 939–78.
12. Wenger HA, Bell GJ. The interactions of intensity, frequency and
duration of exercise training in altering cardiorespiratory fitness. Sports Med 1986;3:346–56.
13. Turnes T, de Aguiar RA, Cruz RS de O, Caputo F. Interval training
in the boundaries of severe domain: effects on aerobic parameters. Eur J Appl Physiol 2016;116:161–9.
14. Ramírez-Campillo R, Andrade DC, Izquierdo M. Effects of
plyometric training volume and training surface on explosive strength. J Strength Cond Res 2013;27:2714–22.
15. Goss-Sampson M, Alkureishi R, Price M. Optimum contact time and
the amortization phase in the bounce drop jump. J Sports Sci 2002;20:3–74.
16. Horita T, Komi PV, Nicol C, Kyröläinen H. Interaction between
pre-landing activities and stiffness regulation of the knee joint musculoskeletal system in the drop jump: implications to performance. Eur J Appl Physiol 2002;88:76–84.
17. Little JP, Safdar A, Wilkin GP, Tarnopolsky MA, Gibala MJ. A
practical model of low-volume high-intensity interval training induces mitochondrial biogenesis in human skeletal muscle: potential mechanisms. J Physiol (Lond) 2010;588:1011–22.
18. Jacobs RA, Flück D, Bonne TC, Bürgi S, Christensen PM, Toigo M,
et al. Improvements in exercise performance with high-intensity interval training coincide with an increase in skeletal muscle mitochondrial content and function. J Appl Physiol 2013;115:785–93.
19. Helgerud J, Høydal K, Wang E, Karlsen T, Berg P, Bjerkaas M, et
al. Aerobic high-intensity intervals improve VO2max more than moderate training. Medicine and science in sports and exercise 2007;39:665–71.
20. MacInnis MJ, Gibala MJ. Physiological adaptations to interval
training and the role of exercise intensity. J Physiol (Lond) 2017;595:2915–30.
21. Billat VL. Interval training for performance: a scientific and
empirical practice. Special recommendations for middle- and long-distance running. Part I: aerobic interval training. Sports Med 2001;31:13–31.
22. Wadden KP, Button DC, Kibele A, Behm DG. Neuromuscular
fatigue recovery following rapid and slow stretch-shortening cycle movements. Appl Physiol Nutr Metab 2012;37:437–47.
23. Strojnik V, Komi PV. Fatigue after submaximal intensive
stretch-shortening cycle exercise. Medicine and science in sports and exercise 2000;32:1314–9.
24. Allen DG, Lamb GD, Westerblad H. Skeletal muscle fatigue: cellular
mechanisms. Physiol Rev 2008;88:287–332.
25. Gandevia SC. Spinal and supraspinal factors in human muscle
fatigue. Physiol Rev 2001;81:1725–89.
26. Rossiter HB, Kowalchuk JM, Whipp BJ. A test to establish
maximum O2 uptake despite no plateau in the O2 uptake response to ramp incremental exercise. J Appl Physiol 2006;100:764–70.
27. Dupont G, Blondel N, Lensel G, Berthoin S. Critical velocity and
time spent at a high level of VO2 for short intermittent runs at supramaximal velocities. Can J Appl Physiol 2002;27:103–15.
28. Byrne PJ, Moran K, Rankin P, Kinsella S. A comparison of methods
used to identify “optimal” drop height for early phase adaptations in depth jump training. J Strength Cond Res 2010;24:2050–5.
29. Bosco C, Luhtanen P, Komi PV. A simple method for measurement
of mechanical power in jumping. Eur J Appl Physiol Occup Physiol 1983;50:273–82.
30. Borg G. Borg's Perceived Exertion and Pain Scales. Champaign, IL:
Human Kinetics Publishers; 1998.
31. Lamarra N, Whipp BJ, Ward SA, Wasserman K. Effect of interbreath
fluctuations on characterizing exercise gas exchange kinetics. J Appl Physiol 1987;62:2003–12.
32. Merton PA. Voluntary strength and fatigue. J Physiol (Lond)
1954;123:553–64.
33. Martin V, Millet GY, Martin A, Deley G, Lattier G. Assessment of
low-frequency fatigue with two methods of electrical stimulation. J Appl Physiol 2004;97:1923–9.
34. Blain GM, Mangum TS, Sidhu SK, Weavil JC, Hureau TJ, Jessop
JE, et al. Group III/IV muscle afferents limit the intramuscular metabolic perturbation during whole body exercise in humans. J Physiol (Lond) 2016;594:5303–15.
35. Hopkins WG. Measures of reliability in sports medicine and science.
Sports Med 2000;30:1–15.
36. Cicchetti DV. Guidelines, criteria, and rules of thumb for evaluating
normed and standardized assessment instruments in psychology. Psychological Assessment 1994;6:284–90.
37. Tabachnick BG, Fidell LS. Using multivariate statistics, 5th. Boston,
MA: Allyn & Bacon/Pearson Education; 2007.
38. Ben Abderrahman A, Zouhal H, Chamari K, Thevenet D, de
Mullenheim P-Y, Gastinger S, et al. Effects of recovery mode (active vs. passive) on performance during a short high-intensity interval training program: a longitudinal study. Eur J Appl Physiol 2013;113:1373–83.
39. Gormley SE, Swain DP, High R, Spina RJ, Dowling EA, Kotipalli
US, et al. Effect of intensity of aerobic training on VO2max. Medicine and science in sports and exercise 2008;40:1336–43.
40. Fuglevand AJ, Zackowski KM, Huey KA, Enoka RM. Impairment
of neuromuscular propagation during human fatiguing contractions at submaximal forces. J Physiol (Lond) 1993;460:549–72.
41. Hill CA, Thompson MW, Ruell PA, Thom JM, White MJ.
Sarcoplasmic reticulum function and muscle contractile character following fatiguing exercise in humans. J Physiol (Lond) 2001;531:871–8.
42. Edwards RHT, Hill DK, Jones DA, Merton PA. Fatigue of long
duration in human skeletal muscle after exercise. J Physiol (Lond) 1977;272:769–78.
43. Bruton JD, Place N, Yamada T, Silva JP, Andrade FH, Dahlstedt AJ,
et al. Reactive oxygen species and fatigue-induced prolonged low-frequency force depression in skeletal muscle fibres of rats, mice and SOD2 overexpressing mice. J Physiol (Lond) 2008;586:175–84.
44. Skurvydas A, Brazaitis M, Venckūnas T, Kamandulis S. Predictive
value of strength loss as an indicator of muscle damage across multiple drop jumps. Appl Physiol Nutr Metab 2011;36:353–60.
45. Power GA, Dalton BH, Rice CL, Vandervoort AA. Delayed recovery
of velocity-dependent power loss following eccentric actions of the ankle dorsiflexors. J Appl Physiol 2010;109:669–76.
46. Bigland-Ritchie BR, Woods JJ. Changes in muscle contractile
properties and neural control during human muscular fatigue. Muscle Nerve 1984;7:691–9.
47. Henneman E, Somjen G, Carpenter DO. Functional Significance of
Cell Size in Spinal Motoneurons. J Neurophysiol 1965;28:560–80.
48. Jacobs R, Bobbert MF, van Ingen Schenau GJ. Mechanical output
from individual muscles during explosive leg extensions: the role of biarticular muscles. J Biomech 1996;29:513–23.
49. Brøchner Nielsen N-P, Hug F, Guével A, Colloud F, Lardy J, Dorel
S. Changes in Motor Coordination Induced by Local Fatigue during a Sprint Cycling Task. Medicine and science in sports and exercise 2018;50:1394–404.