HAL Id: halshs-01302770
https://halshs.archives-ouvertes.fr/halshs-01302770
Submitted on 17 Apr 2016
HAL is a multi-disciplinary open access
archive for the deposit and dissemination of sci-entific research documents, whether they are pub-lished or not. The documents may come from teaching and research institutions in France or abroad, or from public or private research centers.
L’archive ouverte pluridisciplinaire HAL, est destinée au dépôt et à la diffusion de documents scientifiques de niveau recherche, publiés ou non, émanant des établissements d’enseignement et de recherche français ou étrangers, des laboratoires publics ou privés.
The More Children You Have the More Likely You Are
to Smoke? Evidence from Vietnam
Mohamed Arouri, Adel Ben Youssef, Cuong Nguyen-Viet
To cite this version:
Mohamed Arouri, Adel Ben Youssef, Cuong Nguyen-Viet. The More Children You Have the More Likely You Are to Smoke? Evidence from Vietnam. Oxford Development Studies, Taylor & Francis (Routledge), 2016. �halshs-01302770�
1
The More Children You Have the More Likely You Are to
Smoke? Evidence from Vietnam
Mohamed Arouri
Centre Clermontois de Recherche en Gestion et Management (CRCGM) Clermont-Ferrand, France
mohamed.arouri@u-clermont1.fr
Adel Ben Youssef (contact author)
Groupe de REcherche en Droit, Économie, Gestion (GREDEG) Institut Supérieur d'Économie et Management (ISEM)
Université de Nice-Sophia Antipolis Nice, France
adel.ben-youssef@gredeg.cnrs.fr Cuong Nguyen
National Economic University Hanoi, Vietnam
Email: c_nguyenviet@yahoo.com
Phone (84) 904159258 Fax: (844) 38693369
Abstract
There is no doubt that parental smoking can cause health problems for children. It is expected that parents who are aware of the harmful effect of second-hand smoke would decrease parental smoking when having more children. Yet, using instrumental variable regressions and data from the 2006 and 2008 Vietnam Household Living Standard Surveys, we find a very strongly positive and significant effect of the number of children on the probability of households smoking tobacco in Vietnam. Having an additional child in-creases the probability of households consuming tobacco by approximately 15 percent. These findings imply low awareness levels regarding the harmful effects of second-hand smoke on children‟s health in Vietnam and indicate the need for policy action that disseminates knowledge on the harmful effects of smoking.
Keywords: parental smoking behaviors, children,health, instrumental variable regressions JEL Classifications: I12; I31; O1.
2 1. INTRODUCTION
The World Health Organization (WHO) estimates that more than 6million people lose their liveseach year because of tobacco use, with tobacco use growing fastest in low- and middle-income countries owing to rapid population growth and tobacco-industry target-ing (WHO2013). Further, the annual death toll owtarget-ing to tobacco use could rise to more than eight million by 2030.Smoking harms not only the smoker but also people nearby who are exposed to second-hand smoke. Second-hand smoke is the cause of death for 600.000people every year (WHO 2009a). Sorahan et al. (1997) show a strong association between fathers‟ smoking and the risk of cancer in children.1
Understanding factors influencing smoking behaviors are important for not only policy makers but also researchers. Factors associated with smoking can be categorized into several groups including socio-economic, demographic, biological, intrapersonal,and psychosocialfactors (Brannon and Feist 1992,Tyas and Pederson 1998, van Loon et al. 2005). Many empirical studies aim to explain smoking behaviors of individuals (Cha-loupka and Wechsler 1997, Smet et al. 1998, Cha(Cha-loupka and Pacula 1999, Gruber and Zinman 2000, Chaloupka and Warner 2000, Tauras 2004, van Loon et al. 2005,Carpenter and Cook 2008, Block and Webb 2009, Azagba and Sharaf 2011a).A widelyused control variable in these studies is family size. However, empirical results on the effect (or asso-ciation) of household size on tobacco smoking are not consistent: while several studies find individuals in large families are less likely to smoke (Burchfie et al. 1989, Jarvis 1996,Cutler and Glaeser 2007,Azagbaand Sharaf 2011a), there are also results that indi-cate the reverse (Isohanni et al. 1991, Stanton et al. 1994,Johansson et al., 2003, Block
1Smoking can also cause harmful effects on non-health outcomes, e.g., Zhao et al. (2012) found that
3 and Webb 2009).An interesting question in this context is whether there is a causal effect of the number of children on the parental smoking. However, this question remains un-der-researched in empirical studies.
Economists and sociologists have long been interested in the role of children in intra-household allocation of resources. A vast amount of this empirical literature inves-tigates trade-offs between the number of children andtheir own and their family‟s out-comes (e.g., Becker 1960, Becker and Lewis 1973, Becker and Tomes 1976,Rosenzweig and Wolpin 1980,Cáceres-Delpiano 2006, Black et al. 2005,Angrist et al. 2010). Some of the literature specifically investigates the effect of the number of children on parental employment (e.g., Blau and Robins 1988,Korenman and Neumark 1992,Browning 1992,Angrist and Evans 1998, Lundberg and Rose 2002). Yet, little is empirically known about the ultimate impact of the number of children on tobacco smoking by their parents. A related study byJohansson et al. (2003) finds that while parenthood is not associated with lower smoking levels, it is positively associated with the probability of smoking outdoors in Sweden.
This studyexamineswhetherthe number of children can affect the smoking of to-bacco by households in Vietnam. In our empirical investigations, toto-bacco refers to both homemade tobacco products that are smoked, and commercially sold cigarettes.Vietnam is an interesting case study, since it is a country with a very high smoking prevalence rate. About 48 percent of all men in Vietnam smoke as opposed to only 1.5 percent of all women who smokein 2009 (World Bank, 2012). Vietnam is ranked 23rd among 176 countries in terms of the prevalence of male smokers (World Bank, 2012). The
preva-4 lence of smoking for married men with children is even higher, at 66 percent in 2006. More seriously, around 62 percent of fathers often smoke at home.2
Our study contributes to the existing literature on determinants of smoking be-cause we treat the number of children as the main variable of interest, and not as a con-trol variable.In addition, there are very few studies on smoking decisions of individuals in Vietnam. Laxminarayan and Deolalikar (2004) find that increasing tobacco prices re-duces tobacco demand, but does not lead to smoking cessation while Guindon (2009) finds that higher tobacco prices can delay the initiation of smoking among teens and young adults. Nguyen (2012) examines demographic variables associated with male smokers in Vietnam to find that age, education, and employment are important determi-nant factors for the probability of men smoking. Our study is also different from existing literature on family economics since we analyze the effect of children on health beha-viors instead of welfare outcomes of families. Empirical findings on the effect of the number of children on parental smoking can potentially inform policy measures and fu-ture research on tobacco consumption and control, and children‟s health in Vietnam.
A methodological difficulty in estimating the effect of the number of children on parental smoking behavior is the endogeneity bias inherent in such an exercise. Unob-served variables such as attitudes towards children and the health of parents can affect both tobacco smoking decisions and the number of children expected by parents. There-fore, we use instrumentalvariable regression to treat the endogeneity bias. The presence
2 We estimate this figure from the 2006 Vietnam Household Living Standard Survey (see the second
5 of twins of the first-born children is the instrument, which introduces a random and ex-ogenous variation in the number of children.
The paper is structured into six sections. Section 2 presents the theoretical frame-work that underlies the empirical analysis of the effect of children on tobacco consump-tion in families. Secconsump-tion 3 discusses the data sets used in this study and the statistical de-scription of the prevalence of smoking in Vietnam. Sections 4 and 5 respectively present the estimation method and empirical results. Finally, section 6 concludes.
2. THEORETICAL FRAMEWORK
To illustrate the channels through which the number of children can affect household consumption of tobacco, we use a simple model in which a household is assumed to maximize their utility of consumption through leisure time (TL), quality of childrennQ, tobacco (S), and other commodities (C). Q is the quality of a child and n is the number of children. We assume children receive equal investment from parents and have the same quality. The number of children is assumed to be exogenously given. An exogenous shock such as having twins or a miscarriage can cause the actual number of children to differ from the desired number.
The utility function,which is increasing, concave, and twice continuously diffe-rentiable,is assumed to be written additively as follows:
) , ( ) ( ) , ( ) , , , (T nQS C U S n U nQ U , T C U L S Q TC L (1)
6 We assume the utility derived from tobacco consumption depends directly on the number of children, and the marginal utility of tobacco consumption risesas the number of child-ren increases. Numerous sociological studies show that childchild-ren can be a major source of stress for parents (Aneshensel 1992,Crnic and Acevedo 1995, Pelham and Lang 1999). They also find that parents of children with behavior problems, especially children with attention deficit hyperactivity disorder, suffer greater stresses related to their children (e.g., Mash and Johnston 1980, Pelham and Lang 1999). In this context, many smokers report that smoking can help relieve stress,while stress can increase the probability and intensity of smoking(Kenneth et al. 1992, Parrott 1999,Aronson et al. 2008). This would indicate that stress could increase the marginal utility of smoking. A large number of studies find a positive association between stressful experiences and smoking (e.g., Col-by et al. 1994,Tyas and Pederson 1998,Scal et al. 2003, Vitoria et al. 2006,Khwaja et al. 2006,Ayyagari and Sindelar 2009,Azagba and Sharaf 2011b). Given these sociological studies, we assume thatUS(S,n) n0.
Household income is from exogenous income Y and time spent working TW with
the hourly return w. We assume that households have to spend their limited total time T for leisure, working, and care of children. We denote the average time spent on care for each child by the parameter tc. The time spent working is expressed as:
c L w T T nt
T . (2)
The household maximizes their utility subject to the budget constraint:
) ( L c C Q SS p nQ p C Y wT T nt p . (3)
7 p denotes the price of corresponding items. We assume that the cost of child quality can depend on the consumption of tobacco directly if parents are aware of the harmful effects of second-hand smoke on their children‟s health. There are numerous studies document-ing adverse effects of parental smokdocument-ing on children‟s health in both developed and de-veloping countries (e.g., Pattenden et al. 2006, Charlton 1984, Cook and Strachan 1997, 1999). Thus, if there is parental smoking, there can be additional costs to keep the quality of children the same as in the absence of parental smoking. As a result, p can be in-Q creasing in S, that is,dpQ dS0.
Maximizing the Lagrangian expression, and solving the first-order conditions, we obtain the demand for tobacco, quality of children, leisure time, and consumption of oth-er commodities as a function of the numboth-er of children and othoth-er parametoth-ers. The de-mand for tobacco consumption is expressed asSS(pS,pQ,pC,w,tc,n).3 The effect of children on tobacco consumption is not unambiguous. Through the tobacco utility func-tion,US(S,n), children can increase their parent‟s tobacco consumption if they cause parental stress thatmitigatesthrough smoking. However, the number of children also in-creases the cost of providing for children‟s quality. Since child quality and tobacco are neither substitute goods nor complementary goods, the substitution effect of child quality cost on tobacco is expectedto be negligible. As a result, an increase in the cost of child-ren‟s quality can decrease tobacco consumption through the income effect:parents have
3
Using comparative-static analysis, we can compute
J J n S S
, whether J is the Jacobian determinant of the partial derivatives of the implicit functions of S, Q, C and TL with respect to these variables (denoted
by F), and JS is the determinant of the Jacobian matrix but the column vector of
S F replaced by n F .
8 to spend on children, and having more children or spending more on the quality of their life can limit the household budget for several consumption items including tobacco.
In addition, children can also affect household budget through the labor supply of parents. Motherhood and childcare require substantial time and effort that is customarily mostly expended by women, thereby reducing the labor supply of women (Becker 1965, 1985). A large number of studies find a negative relation between labor supply of women and the number of their children (e.g., Blau and Robins 1988, Browning 1992,Angrist and Evans 1998, Connelly and Kimmel 2003). However, families can also decrease their leisure time to keep their working time unchanged. Several studies show that men spend more time and effort in the labor market when they have children (Lundberg and Rose 2002). Empirical studies also find that married men have a higher presence in the labor supply and earn more wages than single men (e.g., Korenman and Neumark 1991,Lundberg and Rose 2002). Therefore, irrespective of the number of children in a household or expenditure on their quality, its consumption of tobacco through the house-hold income channel is not knowna priori.
3. DATA SOURCE AND STATISTICAL DESCRIPTION OF SMOKING PREVALENCE IN VIETNAM
3.1. Data description
This study uses data from the 2006 and 2008 Vietnam Household Living Standard Sur-veys (VHLSS).The General Statistics Office of Vietnam (GSO) conducts these surSur-veys every two years since 2002 with technical support from The World Bank. However, only
9 the 2006 VHLSS contains basic information on the smoking behavior of individuals aged 10 and above, including whether they are current smokers or have quit smoking. There-fore,we use the 2006 VHLSS to examine the prevalence of smoking among individuals and the demographic characteristics of smokers.
The 2006 VHLSS covered 9,189 households and 39,071 individuals. The sample is representative at the national, urban/rural, and regional levels. It contains very detailed information on households with respect to basic demography, employment and labor force participation, education, health, income, expenditure, housing, fixed assets and dur-able goods, participation of households in poverty alleviation programs, etc. For our study, we restrict our sample to fathers who have at least one child. The number of ob-servations in our sample is 4,971.
As mentioned above, we use the presence of first-born twins as the instrument for the number of children. However, this greatlyimpacts the sample size since the 2006 VHLSS contains only a few observations of twin children. Thus, we use data from the much larger 2008 VHLSS to examine the effect of the number of children on house-holds‟ tobacco consumption. Although the 2008 VHLSS does not have individual-level data on tobacco consumption, it contains household-level data on the habit. The 2008 VHLSS is a special survey that collected consumption data for a much larger number of households with the aim of constructing price indexes for provinces in Vietnam.With data pertaining to 69,435 households, the larger sample size of this survey provides us with statistically significant number of observations on households with twin children.
Among the 2008 VHLSS surveyed households, 56,718 households have at least one child. Further, we have identified 304 households with first-born twins (0.54
per-10 cent), that is, children born to the household in the same month and year. We drophouse-holds without children from our sample for the household level analysis. Therefore, we use the 2006 VHLSS data to examine the prevalence of individual smoking and demo-graphic characteristics of smokers, while we use the 2008 VHLSS datato empirically analyze the effect of the number of children on the probability of tobacco consumption in a household. As we will show in the next section, the empirical analysis of individual-level data on smokers in the 2006 VHLSS and household-individual-level smoking data in the 2008 VHLSS produce very similar results on the prevalence of smoking in different household groups.
3.2. Descriptive statistics on smoking prevalence in Vietnam
About 48 percent of all men in Vietnam smoke as opposed to only 1.5 percent of all women who smoke (World Bank, 2012). This is a very high prevalence of male smokers, as a percentage of total male population, in the world (World Bank, 2012). In 2000, Vietnam, a developing country, established a very ambitious policy objective that aimed to reduce the prevalence of male smoking rate to 20 percent of the total male population by 2010 (Government of Vietnam 2000). However, the objective was not achieved, and nearly half of all men currently smoke. According to our estimates from the2006 VHLSS, prevalence of smoking for married men with children, at 66 percent, is higher than for single men, 25 per cent percent of whom smoke. More seriously, around 62 per-cent of fathers often smoke at home. A possible reason for the failure in reducing smok-ing in Vietnam is a weak legal framework related to smoksmok-ing restrictions. Smoksmok-ing is
11 allowed in public areas. In addition, because of low taxation on tobacco, Vietnam is amongst countries with the lowest price of tobacco (Nguyen, 2010).
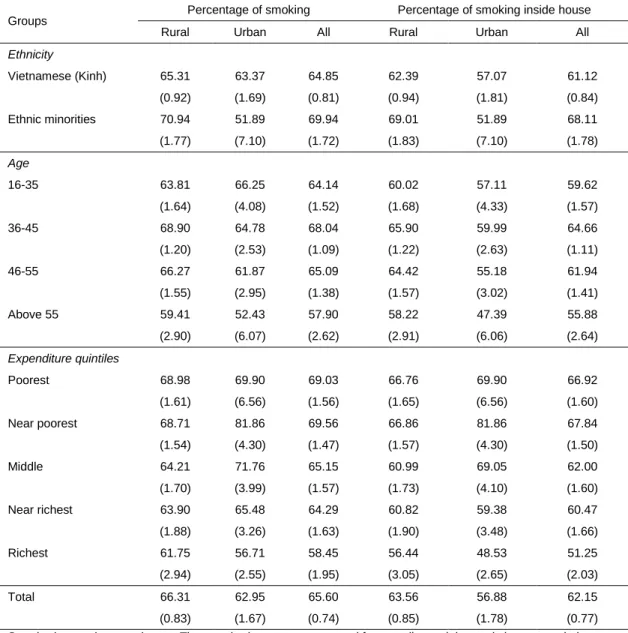
Unlike developed countries, tobacco is mainly consumed by men in Vietnam. Ta-ble 1 presents the smoking rate of fathers by urban/rural and other individual characteris-tics. Although the point estimate of tobacco smoking in rural areas is higher than that in urban areas, the difference in smoking rates between urban and rural areas is not statisti-cally significant. Ethnic minorities who are the poorest and live mainly in mountainous and highland areas have a higher rate of smokers than the Kinhpeople. The percentage of smoking was highest amongst those aged between 36 and 45 years, at 68 percent. The table also shows that fathers of high expenditure quintiles are less likely to smoke than those of low expenditure and low education quintiles.
[Table 1 HERE]
With regard to the main objective of this study to examine the relationship between household smoking and children, Table 2 shows a clear association between the preva-lence of smoking by fathers and the number of children, in both urban and rural areas:63.6 percent of fathers with one child smoke, while 73.5 percent of fathers with at least four children smoke.
12 Table 3 presents the percentage of households with tobacco-related expenditures, classi-fied according to the number of children. The percentage of households that spendon smoking is 64.1 percent, which is very similar to the percentage of fathers that smoke (in Table 2). Rural households are also more likely to spend on smoking than urban house-holds. Table 3 also clearly indicates a positive association between the number of child-ren and the percentage of households that smoke: 57.7 percent of households with only one child consume tobacco, while 78.3 percent of households with more than four child-ren spend on tobacco consumption. This association is also very similar to the association between fathers whosmoke and the number of children they have, presented in Table 2. Since smokers are mainly men in Vietnam, tobacco consumption in families is strongly correlated with the probability of smoking by fathers.
[Table 3 HERE]
4. ESTIMATION METHOD
To examine the effect of the number of children on the tobacco consumptionby fathers, we estimate a simple model using individual-level data from the 2006 VHLSS as fol-lows: i i i i X C Y , (4)
whereY refers to the tobacco smoking status of father i, which equals 1 for smokers and i 0 for non-smokers; X is a vector of control variables applicable to the father i; and, i C is i
13 the number of children that the father has. The number of children ranges from 1 to 8 in our 2006 VHLSS sample.
A challenge in estimating the effect of the number of children on household smoking is its inherent endogeneity. Households with a small number of children migh-thave unobserved characteristics in the “smoking” equation that are different from households with a large number of children. For example, parents who pay more atten-tion to „quality‟ of children tend to have a small number of children (Becker and Lewis, 1973)and not to smoke at the same time. As mentioned above, we will use the presence of twins as an instrument for the number of children to deal with endogeneity. Thus, the second model uses household-level data from the 2008 VHLSSthat contains a statistical-ly significant number of observations on twins to measure the effect of the number of children on the probability of households spending on tobacco. The model is given by:
j j j
j X C u
S , (5)
where,S is the tobacco spending status of households j, which equals 1 for households j with smoking-related expenditures and 0 for households without smoking expenditures;
j
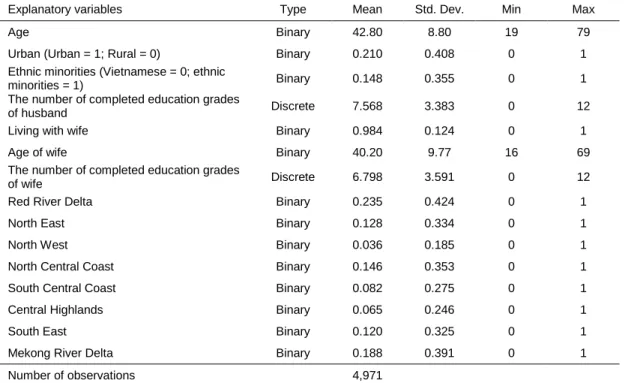
X is a vector of control variables for household i; C is the number of children in the j household. In the 2008 VHLSS sample, the number of children ranges from 1 to 9. The X variables include age, ethnicity, education, urban, and regional variables. The summary statistics of the explanatory variables are presented in Tables A.1 and A.2 in the Appen-dix.
Our parameter of interest is , which measures the effect of the number of child-ren on the probability of pachild-rental smoking in the household. In the literature of
quantity-14 quality of children, the presence of twins is often used as an instrument for the number of children (Rosenzweig and Wolpin 1980,Cáceres-Delpiano 2006, Black et al. 2005,Angrist et al. 2010). The presence of twins can be considered as a random event that causes the expected number of children in a family to increase and does not affect the smoking of parents directly. Twins can be regarded as an exogenous source affecting the number of children. Therefore, we use the presence of first-born twins as the instru-ment. Twins born after the first child are not considered for the empirical analysis in or-der to avoid reverse causality, since having more children can increase the probability of having twins. Anew concern about using twins as an instrument variable refers tothe in-creasing randomness of twins being born owing to parents undergoing fertility treat-ments.However, this concern does not apply to the general population in Vietnam since fertility techniques have been introduced only recently and are very expensive for aver-age Vietnamese families. We expect that only a very small proportion of higher-income families in Vietnam have twins through fertility techniques.
In Table A.3 in Appendix, we run regressions of the first-born twin presence on different observed variables including age and education of parents, ethnicity and region-al dummies. In three model specifications, region-almost region-all explanatory variables are not signif-icant. Only the age of father is statistically significant at the 10% level. The R-squared is very small. Thus, we expect that the presence of first-born twins is random for the case of Vietnam.
A potential problem in using twins as instruments is that twins can have an effect on not only the number of children but also the birth space between children. Having twins is might be more stressful than having two babies between several years. To test
15 whether the twins can significantly affect smoking through other channels in addition to the number of children, we can compare the tobacco consumption between families with twins and families with two non-twin children. In Table A.4 in Appendix, we run regres-sions of tobacco consumption on the twin presences using the sample of households with just two children and the sample of households with just three children. The twin pres-ence is not significant in all three models using the two samples. Thus we expect that the direct effect of having twins on household smoking would be small.
Although the “smoking” variable S is a binary, we estimate equation (1) by apply-ing the two-stage least squares (2SLS) regression for the linear probability model. This is because when there are no available estimators for a binary model with endogenous count variables, 2SLS estimators are consistent and can be applied for the binary model with count endogenous variables (e.g., Angrist 2001,Cáceres-Delpiano 2006,Angrist et al. 2010).The first-stage regression of the number of children is presented in Table A.4 in Appendix. The instrument has its expected sign and a strongly significant effect on the number of children. The weak instrument tests strongly reject the hypothesis on the weakness of the instrument.
5. EMPIRICAL RESULTS
Tables 4 and 5 present results on the effect of the number of children on smoking by fa-thers. We estimate three models with different sets of control variables. Model 1 does not include any control variable. Model 2 includes exogenous control variables. Although previous studies suggest that variables that are also likely to be affected by the number of
16 children should not be controlled (Heckman et al. 1999,Angrist and Pischke 2009),we add several demographic variables of parents as controls in Model 3 to examine whether the omission of these variables can influence the estimated effects of children on house-hold smoking. The regression results from the different models consistently show a posi-tive association of the number of children with the prevalence of smoking among father. Having more children is positively correlated with the probability of fathers smoking in general and g at home.
[Table 4 HERE]
Table 5 reports the effect of having a child on smoking by married men. The sample used for this analysis includes married men who do not have any child and those who have only one child. This analysis shows a large difference in the smoking rate be-tween the two groups of married men after the observed characteristics are controlled. The smoking rate among married men with a child is 11 percentage points higher than the smoking rate among married men without any child.
[Table 5 HERE]
It is possible that OLS estimators in Tables 4 and 5 are biasedowingto endogenei-ty of the number of children. Thus,the estimates from these tables should be interpreted solely as indications with regard to the association between the number of children and smoking by fathers.
In Table 6, we use 2SLS with first-born twins as the instrument for the number of childrento estimate the causal effect of the number of children on the probability of households consuming tobacco. The three models with different sets of control variables
17 give very similar estimates. According to Model 3 2SLS estimates, an additional child leads to an increase of 0.16 in the probability of households spending on tobaccosmok-ing. The point estimates from the 2SLS regressions are higher than those from the OLS regressions, and the endogeneity test provides evidence against the exogeneity of the number of children.4
We also run reduced-form OLS regressions of to estimate the probability of to-bacco consumption in the presence of first-born twins (Table A.5 in Appendix). The three models once again produce similar estimates, and, according to Model 3 for exam-ple, having first-born twins increases the probability of households using tobacco by 0.08.
[Table 6 HERE]
Table 6 reveals some interesting findings on the association between tobacco con-sumption and other household demographic variables. Specifically, families with fathers present are more likely to consume tobacco. In addition,men with higher education,as well as older men,are more likely to smoke. Interestingly, the presence of mothers in households reduces tobacco consumption in families significantly. It implies that a man‟s decision on smoking might also depend on his wife‟s decision. However, the education level of the wife does not affect the smoking decision of husband.
Another important question is whether there is a heterogeneous effect of the number of children on households‟ tobacco consumption. We examine this question by including interactions between numbers of children with other demographic variables of
4 We use the command “ivreg2” in Stata to estimate the 2SLS models. The P-value of endogeneity test in
18 families. The instruments for these interactions are the interactions between the presence of twins and demographic variables in families. For example, we examine whether the effect of children on household tobacco consumption varies across families with different education levels of fathers by includingthe interaction between the education level of the father and the number of children in the 2SLS regression (Table A.6 in the Appendix). The instrument for this interaction is the interaction between the father‟s education level and the presence of first-born twins. Demographic variables interacting with the number of children are urbanity, ethnicity, education of mother, and age and education of fathers. The estimation results show that not all the interactions are statistically significant.
We further run 2SLS regressions to examine the effect of children on household tobacco consumption for different sub-samples that differentiate between urban and rural households, education levels of mothers, education levels of fathers, and different age groups of fathers(Table A.7 in the Appendix). Figure 1 summarizes the point estimates of the effect of children on household tobacco consumption and the corresponding 90 per-cent confidence intervals. It shows that the effect of children on household tobacco con-sumption is approximately similar across different household groups. In addition, the effect of children on household tobacco consumption is statistically significant for fami-lies in which fathers or mothers have lower education levels(the number of completed grades less than 8). It is possible that families with lower education levels are less aware of the harmful effect of second-hand smoking on children. The effect of children on to-bacco consumption is higher for families with fathers who are middle aged (age from 40 to 49).
19 6. CONCLUSIONS
This studyexamined the effect of the number of children on fathers‟ smoking using in-strumental-variable regression and data from the 2006 and 2008 VHLSS. We show that the number of children increases the probability of households consuming tobacco. Hav-ing an additional child increases the probability of household spendHav-ing on smokHav-ing by 15 percent. Possibly, having more children might cause more stress for parents, which in turn can increase their probability of smoking.
This finding implies that parents, especially fathers since smoking is predomi-nantly a male activity in Vietnam, are possibly unaware ofthe health impacts of second-hand smoking on their children. This brings to the fore an important policylearning: knowledge and information on the harmful effects of second-hand smoke should be widely disseminated in Vietnam. In addition, given the weak regulatory environment related to tobacco consumption in Vietnam, legislative action that induces a healthier, smoke-free lifestyle may be appropriate. This would also apply to other developing coun-tries, especially ASEAN countries such as Thailand, Philippines, Indonesia, Lao, and Cambodia, which have similar smoking prevalence patterns and economic structures as Vietnam.
20 REFERENCES
1. Aneshensel, Carol S. (1992), “Social stress: theory and research”, Annual Review of Sociology, 18, 15-38.
2. Angrist D. J. and Pischke JS (2009), Mostly Harmless Econometrics: An Empiricist's Companion, Princeton University Press, 2009.
3. Angrist D. J., Lavy Victor, Schlosser Analia (2010), “Multiple experiments for the causal link between the quantity and quality of children.” Journal of Labor Econom-ics, 28(4): 773-823.
4. Angrist, D. J. (2001), “Estimation of limited dependent variable models with dummy endogenous regressors: simple strategies for empirical practice.” Journal of Business & Economic Statistics, 29(1): 1-28.
5. Angrist, J., and Evans, W.N. (1998), “Children and Their Parents Labor Supply: Evidence from Exogenous Variation in Family Size”, American Economic Review, 88(3), 450 477.
6. Aronson KR, Almeida DM, Stawski RS, Klein LC, Kozlowski LT. (2008), “Smok-ing is associated with worse mood on stressful days: results from a national diary study”,Annals of Behavioral Medicine, 36(3):259-69.
7. Ayyagari, Padmaja and Jody L. Sindelar (2009), “The Impact of Job Stress on Smoking and Quitting: Evidence from the HRS”, NBER Working Paper No. 15232, National Bureau of Economic Research, Cambridge.
8. Azagba, S. and Sharaf, M. (2011b), “The effect of job stress on smoking and alcohol consumption”, Health Economics Review, 1(15), 1-14.
9. Azagba,S. and Sharaf M. (2011a) “Cigarette taxes and smoking participation: evi-dence from recent tax increases in Canada”, International Journal of Environmental Research and Public Health, 8, 1583-1600; doi:10.3390/ijerph8051583
10. Becker, G. (1985), "Human Capital, Effort, and the Sexual Division of Labor", Journal of Labor Economics, 3, 33-38.
11. Becker, G., and H. Lewis (1973), “On the Interaction between the quantity and quality of children.”Journal of Political Economy, 81, 279-288.
12. Becker, G., and N. Tomes (1976), “Child endowments and the quantity and quality of children.”Journal of Political Economy, 84, 398-419.
13. Becker, G.S. (1960). An economic analysis of fertility. In: National Bureau of Eco-nomic Research (ed.). Demographic and EcoEco-nomic Change in Developed Coun-tries.Princeton: Princeton University Press: 209-231 (NBER Conference Series vol. 11).
21 14. Becker, G.S. (1965), “A Theory of the Allocation Time”, Economic Journal, 75,
493-517.
15. Black, S., Devereux, P. J. and Salvanes K. G. (2005), “The more the merrier?the effect of family composition on children‟s education.” Quarterly Journal of Eco-nomics.120(2): 669–700.
16. Blau, D., and Robins, P. (1988), “Child-Care Costs and Family Labor Supply”, The Review of Economics and Statistics, 70(3), 374-381.
17. Block, S. and Webb P. (2009), “Up in Smoke: Tobacco use, expenditure on food, and child malnutrition in developing countries”, Economic Development and Cultur-al Change, 58 (1), 1-23.
18. Brannon L., and Feist J. (1992), Health Psychology. An introduction to behavior and health.2nd edition. California, Wadsworth Publishing Company, 1992.
19. Browning, M. (1992), “Children and Household Economic Behavior”, Journal of Economic Literature, Vol. 30(3), 1434-75.
20. Burchfiel CM, Higgins MW, Keller JB, Butler WJ, Donahue RP.(1989), “Initiation of cigarette smoking in children and adolescents of Tecumseh, Michigan”, American Journal of Epidemiology, 130, 410–415.
21. Cáceres-Delpiano, Julio (2006), “The impacts of family size on investment in child quality.” The Journal of Human Resources, 41(4): 738-754.
22. Carpenter, C., and Cook, P. (2008), “Cigarette taxes and youth smoking: New evidence from national, state, and local Youth Risk Behavior Surveys”, Journal of Health Economics, 27(2), 287-299.
23. Chaloupka, F. J. and Pacula, R. L. (1999), “Sex and race differences in young people‟s responsiveness to price and tobacco control policies”, Tobacco Control 8: 373–377.
24. Chaloupka, F. J. and Wechsler, H. (1997), “Price, tobacco control policies and smoking among young adults”, Journal of Health Economics 16(3): 359–373.
25. Chaloupka, Frank J. & Warner, Kenneth E. (2000), "The economics of smoking", Handbook of Health Economics, in: A. J. Culyer& J. P. Newhouse (ed.), Handbook of Health Economics, edition 1, volume 1, chapter 29, pages 1539-1627 Elsevier. 26. Charlton, A. (1984), “Children's coughs related to parental smoking”, British
Medi-cal Journal, 288(6431): 1647–1649.
27. Colby JP Jr, Linsky AS and Straus MA. (1994), “Social stress and state-to-state dif-ferences in smoking and smoking related mortality in the United States”, Social Science Medicine, 38(2): 373–381.
28. Connelly, R., and Kimmel, J. (2003), “The Effect of Child Care Costs on the Labor Force Participation and Welfare Recipiency of Single Mothers: Implications for Welfare Reform”, Southern Economic Journal, 69(3), 498-510.
22 29. Cook, D. and Strachan, S. (1999), “Summary of effects of parental smoking on the respiratory health of children and implications for research”, Thorax, 54(4), 357-366. 30. Cook, D., and Strachan, D. (1997), “Parental smoking and prevalence of respiratory
symptoms and asthma in school age children”, Thorax, 52(12), 1081-1094.
31. Crnic, K., and Acevedo M. (1995), “Everyday stresses and parenting.” In: Bornstein, M.H., ed. Handbook of Parenting. Vol. 4. Mahwah, NJ: Lawrence Erlbaum Asso-ciates, 1995. pp. 277–298.
32. David M. Cutler, Edward L. Glaeser (2007), “Social interactions and smoking”, NBER Working Paper No. 13477.
33. Government of Vietnam (2000), “National strategy on ant-tobacco‟s harms”, Gov-ernment of Vietnam. Available at: http://www.vinacosh.gov.vn/?mPage=0CP80G01 34. Gruber, J. and Zinman, J. (2000), “Youth smoking in the U.S.: evidence and
implica-tions”, NBER Working Paper Series 7780.
35. Guindon , G. E. (2009), “The impact of tobacco prices on smoking onset in Vietnam: duration analyses of retrospective data”, Centre for Health Economics and Policy Analysis, McMaster University, Hamilton, Ontario, Canada.
36. Guindon GE, Nguyen TT Hien, Hoang V Kinh, McGirr E, Dang V Trung, Nguyen T Lam (2010), “Tobacco taxation in Vietnam”, International Union Against Tubercu-losis and Lung Disease, Paris.
37. Isohanni M, Moilanen I, Rantakallio P. (1991), “Determinants of teenage smoking, with special reference to non-standard family background.” British Journal of Addic-tion, 86, 391–398.
38. Jarvis, M. J. (1996), “The association between having children, family size and smoking cessation in adults”, Addiction 91, 427–434.doi: 10.1046/j.1360-0443.1996.91342712.x
39. Johansson AK, Halling A, The LinQuest Study Group (2003), “Does having children affect adult smoking prevalence and behaviours at home?”,Tobacco Induced Diseas-es 1(3), 175-183.
40. Kenneth A. Perkins, James E. Grobe, Carolyn Fonte, Michael Breus, (1992) “Para-doxical effects of smoking on subjective stress versus cardiovascular arousal in males and females”, Pharmacology Biochemistry and Behavior, 42(2): 301-311. 41. Khwaja A, Sloan F and Chung S. (2006), “Learning about individual risk and the
decision to smoke”, International Journal of Industrial Organization 24(4): 683-699.
42. Korenman, S. and D. Neumark (1992), "Marriage, Motherhood, and Wages", Jour-nal of Human Resources, 27, 233-55.
43. Laxminarayan, R. and A. Deolalikar (2004), “Tobacco initiation, cessation, and change: evidence from Vietnam”, Health Economics, 13, 1191–1201.
23 44. Lundberg, S. and E. Rose (2002), “The Effects of Sons and Daughters on Mens‟ Labour Supply and Wages”, The Review of Economics and Statistics 84(2), pp. 251- 68.
45. Mash, E.J., and Johnston, C. (1990), “Determinants of parenting stress: Illustrations from families of hyperactive children and families of physically abused children”. Journal of Clinical Child Psychology 19:313–328.
46. Nguyen, C., (2012), "Demographic and Socio-economic Determinants of Smoking Behavior: Evidence from Vietnam," Economics Bulletin, 32(3), 2300-2312.
47. Nguyen, H. (2010), “Tăngthuếthuốclásẽlàmgiảmtỷlệhútthuốc”, Dan Tri Newspapers, on 09/03/2010. Available at: http://dantri.com.vn/c7/s7-383193/tang-thue-thuoc-la-se-lam-giam-ty-le-hut-thuoc.htm
48. Parrott, Andy C. (1999), “Does cigarette smoking cause stress?”,American Psychol-ogist, 54(10), 817-820.
49. PattendenSam, TemenugaAntova, Manfred Neuberger, BojidarNikiforov, Manuela De Sario, Leticia Grize, Joachim Heinrich, FrantiskaHruba, Nicole Janssen, Heike Luttmann-Gibson, Larissa Privalova, Peter Rudnai, Anna Splichalova, RenataZ-lotkowska, Tony Fletcher (2006), “Parental smoking and children‟s respiratory health: independent effects of prenatal and postnatal exposure”, Tobacco Control, 15(4), 294-301.
50. Paulo D. Vitoria, Stef P.J. Kremers, Aart N. Mudde, Manuel Pais-Clemente and Hein de Vries (2006), “Psychosocial factors related with smoking behaviour in Por-tuguese adolescents”, European Journal of Cancer Prevention , 15(6), 531-540. 51. Pelham WE Jr and Lang AR (1999), “Can your children drive you to drink? Stress
and parenting in adults interacting with children with ADHD”, Alcohol Res Health, 23(4):292-8.
52. Rosenzweig Mark R., and Kenneth I. Wolpin. (1980), "Testing the quantity-quality fertility model: the use of twins as a natural experiment.” Econometrica, XLVIII: 227-240.
53. Ross H. (2002), “Economic determinants of smoking initiation and cessation”, Inter-national Tobacco Evidence Network (ITEN), June 26, 2002
54. Scal, P., Ireland, M., &Borowsky, I. W. (2003), “Smoking among American adoles-cents: A risk and protective factor analysis”, Journal of Community Health: The Publication for Health Promotion & Disease Prevention, 28, 79-97.
55. Seungji Lima, WoojinChungb, HanjoongKimc, SunmiLeed (2010), “The influence of housing tenure and marital status on smoking in South Korea”, Health Policy 94, 101–110
56. Smet Bart, Lea Maes, Linda De Clercq, KristianaHaryanti, RachmadDjatiWinarno (1999), “Determinants of smoking behaviour among adolescents in Semarang, Indo-nesia”, Tobacco Control 8:186–191.
24 57. Stanton WR, Oei TP, Silva PA (1994), “Sociodemographic characteristics of
adoles-cent smokers”, International Journal of Addiction, 1994, 29:913–925.
58. Stronks K, Van de Mheen HD, Looman CWN, Mackenbach JP.(1997), “Cultural, material and psychosocial correlates of the socioeconomic gradient in smoking be-havior among adults”, Preventive Medicine 26:754–66.
59. Sorahan, T., P. Prior, R. Lancashire, S.FAux, M.Hulten, I. Peck and A. Stewart (1997), “Childhood cancers and parental use of tobacco: Deaths from 1971 to 1976”, British Journal of Cancer, 76(11), pp1525-1531
60. Tauras, J. (2004), “Public policy and smoking cessation among young adults in the United States”, Health Policy 68 (2004) 321–332.
61. Townsend L., Roderick P., C. Cigarette (1994), “Smoking by socioeconomic group, sex, and age: effects of price, income, and health publicity”,British Medical Journal, 309 (6959), 923-927.
62. Tyas, L., & Pederson, L. (1998), “Psychosocial factors related to adolescent smok-ing: A critical review of the literature”, Tobacco Control, 7, 409-420.
63. Van Loon M., Tijhuis, M., Surtees, P., Ormel, J. (2005), “Determinants of smoking status: cross-sectional data on smoking initiation and cessation”, European Journal of Public Health, 15(3), 256–261.
64. WHO (2009a), “Who report on the global tobacco epidemic 2009", World Health Organization.
65. WHO (2009b), “Tobacco control in Vietnam”, World Health Organization Repre-sentative Office in Viet Nam 2009.
66. WHO (2013), “Who report on the global tobacco epidemic 2013: Enforcing bans on tobacco advertising, promotion and sponsorship", World Health Organization. http://apps.who.int/iris/bitstream/10665/85380/1/9789241505871_eng.pdf
67. World Bank (2012), World Development Indicators Data, Washington, DC. Availa-ble at http://data.worldbank.org/data-catalog/world-development-indicators
68. Zhao, M., Konishi, Y., and Glewwe, P. (2012), “Does smoking affect schooling? Evidence from teenagers in rural China”, Journal of Health Economics, 31(4), 584-598.
25 Tables and Figures
Table 1: The smoking rate of fathers by several characteristics (in percent)
Groups Percentage of smoking Percentage of smoking inside house Rural Urban All Rural Urban All
Ethnicity Vietnamese (Kinh) 65.31 63.37 64.85 62.39 57.07 61.12 (0.92) (1.69) (0.81) (0.94) (1.81) (0.84) Ethnic minorities 70.94 51.89 69.94 69.01 51.89 68.11 (1.77) (7.10) (1.72) (1.83) (7.10) (1.78) Age 16-35 63.81 66.25 64.14 60.02 57.11 59.62 (1.64) (4.08) (1.52) (1.68) (4.33) (1.57) 36-45 68.90 64.78 68.04 65.90 59.99 64.66 (1.20) (2.53) (1.09) (1.22) (2.63) (1.11) 46-55 66.27 61.87 65.09 64.42 55.18 61.94 (1.55) (2.95) (1.38) (1.57) (3.02) (1.41) Above 55 59.41 52.43 57.90 58.22 47.39 55.88 (2.90) (6.07) (2.62) (2.91) (6.06) (2.64) Expenditure quintiles Poorest 68.98 69.90 69.03 66.76 69.90 66.92 (1.61) (6.56) (1.56) (1.65) (6.56) (1.60) Near poorest 68.71 81.86 69.56 66.86 81.86 67.84 (1.54) (4.30) (1.47) (1.57) (4.30) (1.50) Middle 64.21 71.76 65.15 60.99 69.05 62.00 (1.70) (3.99) (1.57) (1.73) (4.10) (1.60) Near richest 63.90 65.48 64.29 60.82 59.38 60.47 (1.88) (3.26) (1.63) (1.90) (3.48) (1.66) Richest 61.75 56.71 58.45 56.44 48.53 51.25 (2.94) (2.55) (1.95) (3.05) (2.65) (2.03) Total 66.31 62.95 65.60 63.56 56.88 62.15 (0.83) (1.67) (0.74) (0.85) (1.78) (0.77) Standard errors in parentheses. The standard errors are corrected for sampling weights and cluster correlation. Source: Estimation from the 2006 VHLSS.
26 Table 2: The smoking rate of fathers by the number of children (in percent)
The number of children
Percentage of smoking Percentage of smoking inside house Rural Urban All Rural Urban All 1 64.12 61.89 63.57 60.56 56.63 59.59 (1.78) (3.55) (1.60) (1.83) (3.64) (1.65) 2 64.54 60.78 63.62 61.68 52.92 59.53 (1.23) (2.35) (1.09) (1.25) (2.50) (1.13) 3 68.30 68.27 68.29 66.07 65.43 65.97 (1.64) (3.96) (1.51) (1.66) (4.03) (1.53) 4 71.29 69.44 71.10 68.84 67.16 68.67 (2.51) (7.35) (2.38) (2.58) (7.46) (2.44) Above 4 73.23 75.63 73.52 71.96 72.53 72.03 (3.53) (8.84) (3.29) (3.55) (9.17) (3.32) Total 66.31 62.95 65.60 63.56 56.88 62.15 (0.83) (1.67) (0.74) (0.85) (1.78) (0.77) Standard errors in parentheses. The standard errors are corrected for sampling weights and cluster correlation. Source: Estimation from the 2006 VHLSS.
Table 3: Percentage of households having smoking spending by the number of children
The number of children Rural Urban All
1 59.18 54.30 57.68 (0.85) (1.40) (0.73) 2 66.37 61.15 65.01 (0.61) (1.23) (0.55) 3 68.95 65.53 68.44 (0.91) (2.43) (0.85) 4 72.98 72.27 72.91 (1.71) (5.55) (1.63) Above 4 77.69 85.73 78.26 (2.78) (6.58) (2.63) Total 65.55 59.55 64.07 (0.50) (0.93) (0.44) Standard errors in parentheses. The standard errors are corrected for sampling weights and cluster correlation.
27 Table 4: OLS regressions of father’s smoking on the number of children
Explanatory variables Father‟s smoking Father‟s smoking inside house Model 1 Model 2 Model 3 Model 1 Model 2 Model 3 The number of children 0.0266*** 0.0177*** 0.0146** 0.0336*** 0.0212*** 0.0155** (0.0070) (0.0060) (0.0056) (0.0065) (0.0068) (0.0070) Age -0.0013 -0.0062*** -0.0004 -0.0054***
(0.0008) (0.0017) (0.0008) (0.0020) The completed education grade -0.0185*** -0.0169*** -0.0210*** -0.0173***
(0.0029) (0.0033) (0.0025) (0.0030) Ethnic minorities (yes=1) 0.0121 0.0078 0.0217 0.0104
(0.0272) (0.0298) (0.0253) (0.0256) Urban (urban=1, rural=0) 0.0093 0.0175 -0.0137 0.0014
(0.0222) (0.0222) (0.0199) (0.0203) Red River Delta Reference
North East -0.0215 -0.0236 -0.0323 -0.0327 (0.0268) (0.0265) (0.0275) (0.0275) North West -0.0188 -0.0201 -0.0203 -0.0243 (0.0371) (0.0391) (0.0428) (0.0427) North Central Coast 0.0018 -0.0009 0.0216 0.0165
(0.0392) (0.0396) (0.0282) (0.0281) South Central Coast 0.0669** 0.0654** 0.0504* 0.0469
(0.0291) (0.0297) (0.0292) (0.0295) Central Highlands -0.0143 -0.0087 -0.0085 -0.0012 (0.0333) (0.0339) (0.0331) (0.0332) South East 0.0218 0.0293 0.0045 0.0162
(0.0310) (0.0326) (0.0297) (0.0306) Mekong River Delta 0.0882*** 0.0889*** 0.0855*** 0.0867***
(0.0203) (0.0217) (0.0239) (0.0251) Living with wife -0.2922** -0.3051***
(0.1104) (0.1086) Living with wife * The completed
education grade of wife
-0.0001 -0.0020 (0.0035) (0.0031) Living with wife * Age of wife 0.0058*** 0.0059***
(0.0019) (0.0021) Log of per capita income -0.0207* -0.0388***
(0.0113) (0.0135) Constant 0.5949*** 0.7895*** 1.2334*** 0.5445*** 0.7357*** 1.3500***
(0.0197) (0.0534) (0.1280) (0.0172) (0.0483) (0.1641) Observations 4,971 4,971 4,971 4,971 4,971 4,971 R-squared 0.004 0.031 0.034 0.005 0.037 0.041 * significant at 10%; ** significant at 5%; *** significant at 1%
Robust standard errors in parentheses. The standard errors are corrected for sampling and cluster correlation.
28 Table 5: OLS regressions of father’s smoking on ‘having a kid’
Explanatory variables Father‟s smoking Father‟s smoking inside house Model 1 Model 2 Model 3 Model 1 Model 2 Model 3 Having a kid (yes=1; no=0) 0.1751*** 0.1223*** 0.1231*** 0.1570*** 0.1097*** 0.1122***
(0.0252) (0.0300) (0.0307) (0.0253) (0.0303) (0.0309) Age -0.0029*** -0.0043** -0.0026** -0.0043** (0.0010) (0.0021) (0.0010) (0.0021) The completed education grade -0.0104*** -0.0089* -0.0105*** -0.0078* (0.0039) (0.0046) (0.0040) (0.0046) Ethnic minorities (yes=1) 0.0821* 0.0768* 0.0966** 0.0878* (0.0427) (0.0432) (0.0446) (0.0450) Urban (urban=1, rural=0) -0.0405 -0.0329 -0.0376 -0.0262 (0.0328) (0.0337) (0.0336) (0.0345) Red River Delta Reference
North East -0.0174 -0.0137 -0.0352 -0.0304 (0.0425) (0.0426) (0.0423) (0.0424) North West 0.0525 0.0556 0.0192 0.0224
(0.0709) (0.0707) (0.0787) (0.0783) North Central Coast 0.0190 0.0209 0.0364 0.0388
(0.0459) (0.0460) (0.0457) (0.0459) South Central Coast 0.1720*** 0.1730*** 0.1345*** 0.1342***
(0.0497) (0.0501) (0.0515) (0.0518) Central Highlands 0.0091 0.0141 0.0319 0.0378
(0.0719) (0.0719) (0.0715) (0.0715) South East 0.1332*** 0.1422*** 0.1073** 0.1157** (0.0476) (0.0485) (0.0488) (0.0498) Mekong River Delta 0.2336*** 0.2395*** 0.2265*** 0.2312***
(0.0349) (0.0367) (0.0355) (0.0372)
Living with wife -0.0712 -0.0870
(0.1451) (0.1450) Living with wife * The completed
education grade of wife
-0.0008 -0.0025 (0.0052) (0.0052) Living with wife * Age of wife 0.0015 0.0018
(0.0022) (0.0022) Log of per capita income -0.0170 -0.0231 (0.0205) (0.0209) Constant 0.4606*** 0.6413*** 0.8497*** 0.4389*** 0.6068*** 0.8913***
(0.0199) (0.0811) (0.2258) (0.0196) (0.0820) (0.2287) Observations 1,710 1,710 1,710 1,710 1,710 1,710 R-squared 0.030 0.095 0.096 0.024 0.083 0.084 * significant at 10%; ** significant at 5%; *** significant at 1%
Robust standard errors in parentheses. The standard errors are corrected for sampling and cluster correlation. Source: Estimation from the 2006 VHLSS.
29 Table 6: OLS and 2SLS regressions of dependent variable ‘household having tobacco
consumption’
Explanatory variables OLS regressions IV regressions
Model 1 Model 2 Model 3 Model 1 Model 2 Model 3 The number of children 0.0473*** 0.0425*** 0.0320*** 0.1459** 0.1521** 0.1549***
(0.0042) (0.0039) (0.0040) (0.0583) (0.0596) (0.0587) Ethnic minorities (Vietnamese = 0;
ethnic minorities = 1)
0.0587*** 0.0446*** 0.0137 -0.0007 (0.0087) (0.0094) (0.0250) (0.0226) Living with father 0.7261*** 0.6879***
(0.0257) (0.0354) Living with father * Age of father -0.0072*** -0.0072***
(0.0005) (0.0005) Living with father * The completed
education grade of father
-0.0028*** -0.0029*** (0.0008) (0.0009) Living with mother -0.4368*** -0.4913***
(0.0239) (0.0359) Living with mother * Age of mother 0.0081*** 0.0084***
(0.0004) (0.0004) Living with mother * The
com-pleted education grade of mother
-0.0022* -0.0002 (0.0012) (0.0016) Urban (urban=1, rural=0) -0.0603*** -0.0505*** -0.0406** -0.0318** (0.0094) (0.0092) (0.0172) (0.0155) Red River Delta Reference
North East -0.0010 -0.0041 0.0021 0.0011 (0.0123) (0.0116) (0.0114) (0.0110) North West -0.0189 -0.0231 -0.0291 -0.0304 (0.0197) (0.0202) (0.0230) (0.0241) North Central Coast -0.0056 0.0030 -0.0307 -0.0253 (0.0225) (0.0223) (0.0233) (0.0223) South Central Coast 0.0671*** 0.0679*** 0.0376 0.0378* (0.0200) (0.0198) (0.0242) (0.0219) Central Highlands 0.0302* 0.0336* -0.0435 -0.0442 (0.0155) (0.0168) (0.0443) (0.0414) South East 0.0325** 0.0352*** 0.0014 0.0029
(0.0123) (0.0122) (0.0224) (0.0209) Mekong River Delta 0.0892*** 0.0742*** 0.0794*** 0.0680***
(0.0136) (0.0144) (0.0120) (0.0123) Constant 0.5487*** 0.5382*** 0.3115*** 0.3349*** 0.3179*** 0.1281
(0.0165) (0.0126) (0.0153) (0.1259) (0.1231) (0.0917) Observations 56,718 56,718 56,718 56,718 56,718 56,718 R-squared 0.011 0.021 0.073
* significant at 10%; ** significant at 5%; *** significant at 1%
Robust standard errors in parentheses. The standard errors are corrected for sampling and cluster correlation. Source: Estimation from the 2008 VHLSS.
30 Figure 1: The effect of the number of children on household smoking consumption for
different household groups
Note: The graph presents the point estimates and the 90% confidence interval of the estimates of the number of children on the 2SLS regressions of the household smoking consumption. The sample is households with all the children. The full regressions are presented in Tables A.5 in Appendix
Source: Estimation from the 2006 VHLSS.
0,256 0,125 0,15 0,169 0,161 0,1437 0,148 0,183 0,126 -0,1 0,0 0,1 0,2 0,3 0,4 0,5 0,6
31
Appendix
Table A.1. Summary statistics of individual-level data in the 2006 VHLSS
Explanatory variables Type Mean Std. Dev. Min Max
Age Binary 42.80 8.80 19 79
Urban (Urban = 1; Rural = 0) Binary 0.210 0.408 0 1 Ethnic minorities (Vietnamese = 0; ethnic
minorities = 1) Binary 0.148 0.355 0 1 The number of completed education grades
of husband Discrete 7.568 3.383 0 12 Living with wife Binary 0.984 0.124 0 1 Age of wife Binary 40.20 9.77 16 69 The number of completed education grades
of wife Discrete 6.798 3.591 0 12 Red River Delta Binary 0.235 0.424 0 1 North East Binary 0.128 0.334 0 1 North West Binary 0.036 0.185 0 1 North Central Coast Binary 0.146 0.353 0 1 South Central Coast Binary 0.082 0.275 0 1 Central Highlands Binary 0.065 0.246 0 1 South East Binary 0.120 0.325 0 1 Mekong River Delta Binary 0.188 0.391 0 1 Number of observations 4,971
32 Table A.2. Summary statistics of household-level data in the 2008 VHLSS
Explanatory variables Type Mean Std. Dev. Min Max Urban (Urban = 1; Rural = 0) Binary 0.267 0.443 0 1 Ethnic minorities (Vietnamese = 0; ethnic
minorities = 1) Binary 0.135 0.342 0 1 Living with father Binary 0.880 0.324 0 1 Age of father Discrete 46.56 11.00 18 88 The number of completed education grades of
father Discrete 5.171 4.613 0 12 Living with mother Binary 0.976 0.154 0 1 Age of mother Discrete 44.66 11.04 17 77 The number of completed education grades of
mother Discrete 4.598 4.407 0 12 Red River Delta Binary 0.214 0.410 0 1 North East Binary 0.132 0.338 0 1 North West Binary 0.031 0.174 0 1 North Central Coast Binary 0.122 0.327 0 1 South Central Coast Binary 0.086 0.281 0 1 Central Highlands Binary 0.060 0.237 0 1 South East Binary 0.154 0.361 0 1 Mekong River Delta Binary 0.202 0.401 0 1 Number of observations 56,718
33 Table A.3: OLS regressions of the presence of first-born twins
Explanatory variables
Dependent variable is the presence of first-born twins
Model 1 Model 2 Model 3 Ethnic minorities (Vietnamese = 0; ethnic minorities = 1) 0.00020 0.00036 (0.00104) (0.00105) Urban (urban=1, rural=0) 0.00151 0.00137
(0.00095) (0.00097) Red River Delta Reference
North East 0.00160 0.00154
(0.00147) (0.00147)
North West -0.00047 -0.00039
(0.00172) (0.00172) North Central Coast -0.00072 -0.00081 (0.00152) (0.00151) South Central Coast -0.00094 -0.00094 (0.00136) (0.00135) Central Highlands -0.00156 -0.00153 (0.00126) (0.00126)
South East -0.00058 -0.00057
(0.00138) (0.00138) Mekong River Delta -0.00055 -0.00051 (0.00125) (0.00124) Living with father -0.00586 -0.00572 (0.00374) (0.00377) Living with father * Age of father 0.00012* 0.00012* (0.00007) (0.00007) Living with father * The completed education grade of father -0.00006 -0.00005 (0.00014) (0.00014) Living with mother 0.00044 0.00083
(0.00381) (0.00380) Living with mother * Age of mother -0.00006 -0.00006 (0.00007) (0.00007) Living with mother * The completed education grade of mother 0.00012 0.00006
(0.00015) (0.00015) Constant 0.00525*** 0.00774*** 0.00748** (0.00111) (0.00289) (0.00307) Observations 56,718 56,718 56,718
R-squared 0.0002 0.0002 0.0004
* significant at 10%; ** significant at 5%; *** significant at 1%
Robust standard errors in parentheses. The standard errors are corrected for sampling and cluster correlation. Source: Estimation from the 2008 VHLSS.
34 Table A.4: OLS regressions of ‘household having tobacco consumption’ on the presence
of first-born twin controlled for the number of children
Explanatory variables Sample of two children Sample of three children Model 1 Model 2 Model 3 Model 1 Model 2 Model 3 Having the first-born twins (yes=1,
no=0)
0.0351 0.0461 0.0397 0.0231 0.0203 0.0388 (0.0337) (0.0365) (0.0333) (0.0468) (0.0477) (0.0528) Ethnic minorities (Vietnamese = 0;
ethnic minorities = 1)
0.0710*** 0.0535*** 0.0541*** 0.0459*** (0.0096) (0.0106) (0.0130) (0.0122) Living with father 0.7162*** 0.6854***
(0.0345) (0.0587) Living with father * Age of father -0.0072*** -0.0070***
(0.0007) (0.0013) Living with father * The completed
education grade of father
-0.0023 -0.0022 (0.0017) (0.0017) Living with mother -0.4593*** -0.5005***
(0.0377) (0.0651) Living with mother * Age of mother 0.0086*** 0.0096***
(0.0006) (0.0012) Living with mother * The
com-pleted education grade of mother
-0.0032* -0.0013 (0.0017) (0.0021) Urban (urban=1, rural=0) -0.0647*** -0.0555*** -0.0536*** -0.0456***
(0.0137) (0.0127) (0.0151) (0.0148) Red River Delta Reference
North East -0.0133 -0.0190 0.0044 -0.0007 (0.0141) (0.0136) (0.0259) (0.0249) North West -0.0191 -0.0231 -0.0382 -0.0393 (0.0222) (0.0231) (0.0335) (0.0337) North Central Coast -0.0052 0.0015 -0.0272 -0.0203 (0.0252) (0.0253) (0.0290) (0.0297) South Central Coast 0.0554** 0.0497** 0.0792*** 0.0732***
(0.0255) (0.0239) (0.0268) (0.0252) Central Highlands 0.0412 0.0396 0.0263 0.0326
(0.0278) (0.0278) (0.0252) (0.0259) South East 0.0338* 0.0311* 0.0201 0.0187
(0.0176) (0.0168) (0.0231) (0.0225) Mekong River Delta 0.0743*** 0.0549*** 0.0843** 0.0715** (0.0122) (0.0135) (0.0313) (0.0294) Constant 0.6525*** 0.6401*** 0.4073*** 0.6983*** 0.6776*** 0.4394***
(0.0113) (0.0117) (0.0203) (0.0072) (0.0193) (0.0365) Observations 25,452 25,452 25,452 10,794 10,794 10,794 R-squared 0.000 0.010 0.055 0.000 0.011 0.051 * significant at 10%; ** significant at 5%; *** significant at 1%
Robust standard errors in parentheses. The standard errors are corrected for sampling and cluster correlation. Source: Estimation from the 2008 VHLSS.
35 Table A.5: First-stage OLS regressions of the number of children, and OLS reduced-form
regressions of tobacco consumption
Explanatory variables Dependent variable is the number of children Dependent variable is „household having tobacco consumption‟ Model 1 Model 2 Model 3 Model 1 Model 2 Model 3 Having the first-born twins (yes=1,
no=0)
0.4754*** 0.5085*** 0.5122*** 0.0694*** 0.0774*** 0.0794*** (0.0939) (0.0815) (0.0798) (0.0229) (0.0249) (0.0247) Ethnic minorities (Vietnamese =
0; ethnic minorities = 1)
0.4106*** 0.3686*** 0.0762*** 0.0564*** (0.0391) (0.0385) (0.0083) (0.0091) Living with father 0.3135*** 0.7365***
(0.0364) (0.0259)
Age of father 0.0003 -0.0072***
(0.0008) (0.0005) The completed education grades
of father
0.0004 -0.0028*** (0.0027) (0.0008) Living with mother 0.4429*** -0.4226***
(0.0525) (0.0241)
Age of mother -0.0027** 0.0080***
(0.0010) (0.0004) The completed education grades
of mother
-0.0162*** -0.0027** (0.0024) (0.0012) Urban (urban=1, rural=0) -0.1807*** -0.1524*** -0.0681*** -0.0554***
(0.0162) (0.0158) (0.0097) (0.0096) Red River Delta Reference
North East -0.0279 -0.0416* -0.0021 -0.0053 (0.0240) (0.0243) (0.0128) (0.0120) North West 0.0945 0.0607 -0.0148 -0.0210 (0.0676) (0.0648) (0.0184) (0.0193) North Central Coast 0.2304*** 0.2315*** 0.0043 0.0105
(0.0351) (0.0325) (0.0221) (0.0220) South Central Coast 0.2709*** 0.2462*** 0.0788*** 0.0760***
(0.0273) (0.0270) (0.0198) (0.0196) Central Highlands 0.6741*** 0.6348*** 0.0590*** 0.0541***
(0.0725) (0.0708) (0.0144) (0.0159) South East 0.2849*** 0.2639*** 0.0447*** 0.0438***
(0.0451) (0.0443) (0.0122) (0.0122) Mekong River Delta 0.0900*** 0.0511* 0.0931*** 0.0759***
(0.0275) (0.0291) (0.0141) (0.0148) Constant 2.1659*** 2.0056*** 1.4880*** 0.6509*** 0.6230*** 0.3586***
(0.0174) (0.0138) (0.0315) (0.0094) (0.0098) (0.0156) Observations 56,718 56,718 56,718 56,718 56,718 56,718 R-squared 0.001 0.052 0.068 0.000 0.013 0.068 Cragg-Donald weak identification
test 63.2 76.2 78.6
* significant at 10%; ** significant at 5%; *** significant at 1%
Robust standard errors in parentheses. The standard errors are corrected for sampling and cluster correlation. Source: Estimation from the 2008 VHLSS.
36 Table A.6: 2SLS regressions of dependent variable ‘household having smoking
con-sumption’ with interactions
Explanatory variables Dependent variable „household having smoking consumption‟ (yes=1, no=0) The number of children 0.1117 0.1610 0.1171 0.1280* 0.1243*** 0.1807** (0.0958) (0.1769) (0.0818) (0.0758) (0.0431) (0.0717) Age of father * The number of children 0.0011
(0.0018) Age of mother * The number of
child-ren
-0.0001 (0.0037) The completed education grades of
father * The number of children
0.0089 (0.0138) The completed education grades of
mother * The number of children
0.0061 (0.0145) Urban (urban=1, rural=0) * The
num-ber of children
0.1360 (0.1859) Ethnic minorities * The number of
children
-0.2133 (0.1533) Ethnic minorities (Vietnamese = 0;
ethnic minorities = 1)
-0.0006 -0.0008 0.0097 0.0091 0.0066 0.5306 (0.0231) (0.0229) (0.0285) (0.0288) (0.0194) (0.3656) Living with father 0.6755*** 0.6867*** 0.6907*** 0.6874*** 0.6920*** 0.6863***
(0.0411) (0.0455) (0.0361) (0.0360) (0.0332) (0.0368) Age of father -0.0090*** -0.0072*** -0.0070*** -0.0071*** -0.0073*** -0.0071***
(0.0033) (0.0008) (0.0007) (0.0006) (0.0005) (0.0005) The completed education grade of
father
-0.0027*** -0.0029*** -0.0222 -0.0033*** -0.0030*** -0.0027*** (0.0010) (0.0009) (0.0299) (0.0011) (0.0010) (0.0009) Living with mother -0.4809*** -0.4897*** -0.4821*** -0.4814*** -0.4861*** -0.4877***
(0.0384) (0.0524) (0.0427) (0.0455) (0.0319) (0.0333) Age of mother 0.0082*** 0.0087 0.0083*** 0.0083*** 0.0083*** 0.0086***
(0.0005) (0.0065) (0.0006) (0.0005) (0.0004) (0.0004) The completed education grade of
mother
-0.0003 -0.0002 0.0003 -0.0126 0.0001 -0.0014 (0.0017) (0.0017) (0.0017) (0.0297) (0.0018) (0.0014) Urban (urban=1, rural=0) -0.0316** -0.0316** -0.0288* -0.0301* -0.3121 -0.0318** (0.0157) (0.0156) (0.0169) (0.0168) (0.3713) (0.0158) Red River Delta Reference
North East 0.0005 0.0013 -0.0006 -0.0005 0.0023 -0.0154 (0.0111) (0.0117) (0.0113) (0.0114) (0.0118) (0.0114) North West -0.0317 -0.0304 -0.0310 -0.0292 -0.0244 -0.0334** (0.0250) (0.0239) (0.0231) (0.0231) (0.0242) (0.0168) North Central Coast -0.0260 -0.0254 -0.0282 -0.0268 -0.0266 -0.0360 (0.0225) (0.0221) (0.0220) (0.0224) (0.0226) (0.0247) South Central Coast 0.0359 0.0379* 0.0350 0.0374* 0.0356 0.0304
(0.0235) (0.0225) (0.0222) (0.0220) (0.0241) (0.0235) Central Highlands -0.0466 -0.0443 -0.0446 -0.0411 -0.0449 -0.0094 (0.0436) (0.0415) (0.0421) (0.0392) (0.0412) (0.0286) South East -0.0001 0.0032 0.0022 0.0036 0.0008 -0.0028 (0.0213) (0.0219) (0.0220) (0.0200) (0.0213) (0.0225) Mekong River Delta 0.0664*** 0.0684*** 0.0674*** 0.0671*** 0.0638*** 0.0594***
(0.0131) (0.0146) (0.0128) (0.0135) (0.0139) (0.0111) Constant 0.2124 0.1160 0.1956 0.1771 0.1938** 0.0712
(0.1786) (0.3495) (0.1330) (0.1296) (0.0765) (0.1236) Observations 56,718 56,718 56,718 56,718 56,718 56,718 * significant at 10%; ** significant at 5%; *** significant at 1%
Robust standard errors in parentheses. The standard errors are corrected for sampling and cluster correlation. Source: Estimation from the 2008 VHLSS.