Publisher’s version / Version de l'éditeur:
Applied Optics, 26, 19, pp. 4298-4302, 1987
READ THESE TERMS AND CONDITIONS CAREFULLY BEFORE USING THIS WEBSITE. https://nrc-publications.canada.ca/eng/copyright
Vous avez des questions? Nous pouvons vous aider. Pour communiquer directement avec un auteur, consultez la première page de la revue dans laquelle son article a été publié afin de trouver ses coordonnées. Si vous n’arrivez pas à les repérer, communiquez avec nous à PublicationsArchive-ArchivesPublications@nrc-cnrc.gc.ca.
Questions? Contact the NRC Publications Archive team at
PublicationsArchive-ArchivesPublications@nrc-cnrc.gc.ca. If you wish to email the authors directly, please see the first page of the publication for their contact information.
NRC Publications Archive
Archives des publications du CNRC
This publication could be one of several versions: author’s original, accepted manuscript or the publisher’s version. / La version de cette publication peut être l’une des suivantes : la version prépublication de l’auteur, la version acceptée du manuscrit ou la version de l’éditeur.
Access and use of this website and the material on it are subject to the Terms and Conditions set forth at
Noise characteristics of single-shot broadband CARS signals
Snelling, D. R.; Parameswaran, T.; Smallwood, G. J.
https://publications-cnrc.canada.ca/fra/droits
L’accès à ce site Web et l’utilisation de son contenu sont assujettis aux conditions présentées dans le site
LISEZ CES CONDITIONS ATTENTIVEMENT AVANT D’UTILISER CE SITE WEB.
NRC Publications Record / Notice d'Archives des publications de CNRC:
https://nrc-publications.canada.ca/eng/view/object/?id=f04d4172-abde-461d-8657-618ce9f5b717 https://publications-cnrc.canada.ca/fra/voir/objet/?id=f04d4172-abde-461d-8657-618ce9f5b717
Noise characteristics of single-shot broadband CARS signals
D. R. Snelling, T. Parameswaran, and G. J. SmallwoodSpectrally resolved measurements of noise in resonant nitrogen coherent anti-Stokes Raman spectroscopy (CARS) are presented for three pump laser bandwidths. The experimental noise curves are compared with those calculated from a simple model involving statistically independent Stokes modes. The sources of noise in both resonant and nonresonant CARS spectra are discussed.
1. Introduction
Single-pulse broadband coherent anti-Stokes Ra-man spectroscopy (CARS) has become an important diagnostic technique,'-7 particularly for combustion measurements of temperature and species concentra-tion. The single-pulse (10-ns) capability is crucial for the study of turbulent combustion environments such as gas turbine combustors, internal combustion en-gines, and turbulent flames.
Noise in the CARS signal limits the accuracy of these single-pulse measurements; and pulse-to-pulse varia-tion in the output of the broadband dye laser is the predominant source of this noise. A picture of CARS noise has emerged8 9whereby the greater the number
of dye laser modes contributing to the excitation of the CARS signal the lower the resultant CARS noise be-comes. In particular, a model of dye laser noise based on statistically independent modes with random phases8 has recently been adduced'0-'2to explain the observed dependence of resonant and nonresonant
CARS noise6"10on the pump laser bandwidth. A
spec-tral dependence of the amplitude fluctuations ob-served in the temporal profile of the broadband dye laser has been proposed3 9"10as an additional source of noise. CARS pulses shorter than the laser intramode beat periods may also lead to incomplete temporal averaging.'2 The benefit of lengthening the CARS pulse has also been discussed.9
Calculations of average (spectral) noise levels in res-onant (Raman resres-onant N2spectra) and nonresonant
CARS spectra8"10"'1 are in semiquantitative agreement with experimental results.6 8"0 In particular it has
The authors are with National Research Council of Canada, Divi-sion of Mechanical Engineering, Ottawa, Ontario KlA OR6, Canada.
Received 28 February 1987. 0003-6935/87/194298-05$02.00/0.
been shown1 0"'1 that the decrease in N2resonant CARS spectral noise with increasing pump laser bandwidth (see Table I which is reproduced from Ref. 10) is attrib-utable to the greater number of dye laser modes con-tributing as the pump laser bandwidth increases. Kroll et al.11 have developed a simple explicit semi-quantitative model for estimating the average relative noise of various broadband CARS techniques. We have very briefly reportedl numeric calculations where the CARS noise was obtained by computing the quantity:
1/2
(1k)2) ZIk),
k
(1)
which represents8 the noise attributable to K
statisti-cally independent modes of intensity (Ik). In Eq. (1), a is the standard deviation, the () brackets indicate a time average, and (I) = (IA). In this analysis the following assumptions are made.8"12 The Stokes and
pump lasers are statistically independent. For pump lasers with a finite bandwidth, the medium samples a large number of fluctuations in the intensities in a single-pulse CARS experiment. Therefore, the pump laser may be crudely treated as a coherent source with a constant intensity equal to the time average.
With the above assumptions the effect of the pump laser can be included in the calculation of (Ik) by convolving the monochromatic CARS intensity with the appropriate pump laser bandwidth, and the noise in the CARS spectrum can then be attributed to the modes in the dye laser [Eq. (1)].
Spectrally averaged (15-cm-' bandwidth) values of the fractional noise oi(I), calculated in this way, showed the same trends as the experimental data in Table I; however, the calculated values were somewhat lower.'0 The dye mode spacing was taken to be 0.01 cm'1 (approximately the longitudinal mode spacing in our dye laser), and the (k) was calculated as the pump convolved CARS intensities at the 0.01-cm-' interval as modulated by the slit function.'0
Table 1. Noise Statistics: Standard Deviation a Expressed as Percent Calculated for 15-cm-1Bandwidth
Pump laser configuration Multimode Multimode Spectrum type Single mode (0.10 cm-') (0.69 cm-') CO2nonresonant
-spectra 6.6 8.4 9.1
N2flame spectra
T = 1580 K 22.4(22.0) 16.1(15.6) 11.1(10.8) The above values are reproduced from Ref. 10
Calculated for 70-cm'1 Bandwidth CO2nonresonant
spectra 7.7 10.3 10.5
the spectrally averaged noise has been discussed previ-ously6"10where the quantity Yij, which represents the
normalized CARS signal, is defined. i and j represent the diode index and spectrum index, respectively. The standard deviation of the spectra Yij was calculat-ed for each diode to yield a percentage noise Ni, which represents the shot-to-shot variability of the CARS noise. This noise can be corrected for detector shot noise by assuming that the detector shot noise compo-nent D and the corrected experimental noise crc are
uncorrelated and give a net noise 0
N given by
2 = 2 + Y2
IN D C. (2)
We have previously measured the detector shot noise
component, which is given by'0
In this paper we present for the first time spectrally resolved measurements of CARS noise for pump laser
bandwidths of 0.1 and 0.69 cm-' as well as single-mode
pump laser operation. The observed noise, with the component attributable to detector shot noise sub-tracted, is compared with theoretical calculations based on Eq. (1).
II. Results and Discussion
The theoretical noise was calculated on the basis of Eq. (1) as outlined in the previous section. The dye laser mode spacing was assumed to be constant, inde-pendent of wavelength. An asymmetric Voigt instru-ment functions was used to calculate the Ik values from the pump-convolved CARS intensities generated at the assumed dye laser mode spacing. The theoreti-cal CARS computer program used included the effects of cross-coherence and collisional narrowing.'0 The summation in Eq. (1) was performed over all the Ik values falling under the envelope of the Voigt instru-ment function, and v/(I) was calculated as a function of frequency (cm-'). /(I) calculated in this way rep-resents the expected fractional noise (single standard deviation) associated with a given detector element (pixel) of the diode array tuned to that frequency. The mode spacing (0.02 cm-') was chosen to give the best fit to the experimental single-mode data.
This is consistent with the method of calculating noise from experimental spectra6"10where we first di-vide the individual spectra by an averaged spectrum (to remove the dependence on diode sensitivity) and then divide by the integrated intensity from all detec-tor elements (pixels) in the analysis bandwidth. This ensures that fluctuations in the spectrally integrated CARS signal do not contribute to the measured noise of individual pixels.6"10 It should be noted, however, that the experimental noise defined in this way is a weak function of the analysis bandwidth; for example, a decrease in the analysis bandwidth from 70 to 30 cm-' produced a 13% reduction in the measured
non-resonant CARS noise.6
The experimental CARS spectra were recorded in a hydrogen/air fueled flat-flame burner for pump laser bandwidths of 0.1 and 0.69 cm-' and for single-mode pump laser operation.' The method of calculating
c= + kC, (3)
where rO is the dark noise and kC is the shot noise component for a diode signal of C counts. Measured values of c0 and k'0 were used to obtain the corrected experimental noise crc, which is plotted in the accom-panying figures. At very low CARS intensities the noise is dominated by detector shot noise, and the calculation of crc becomes uncertain as can be seen in
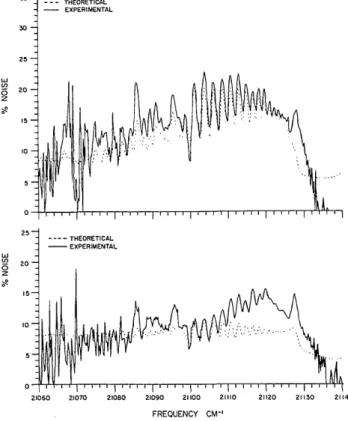
Figs. 1 and 2.
The single-mode pump laser noise curves are shown in Fig. 1 with the experimental (400-pulse average) CARS spectrum. A mode spacing of 0.02 cm-' was chosen to give the best fit to the single-mode experi-mental data, and the theoretical noise was calculated for a temperature of 1550 K and 1-atm pressure, the conditions appropriate to the experimental spectra. The spectral shapes of the theoretical and experimen-tal noise curves are quite similar. In particular, the observed spectral coincidence of noise peaks with peaks in the CARS spectrum is predicted by theory as is the falloff in noise in the lower intensity regions of the CARS spectrum beyond the V = 1-0 bandhead and in the vicinity of the 3-2 band. It is interesting to note that both the theoretical and experimental noise spec-tra exhibit considerably more modulation than do the corresponding CARS spectra. Heuristically, the noise
peaks can be thought of as resulting from fewer dye
laser modes contributing to the summation in Eq. (1) due to the discontinuous narrow (typically 0.03-0.05 cm-') Raman resonances in the pump laser convolved CARS spectrum. In the lower intensity regions of the CARS spectrum, where the nonresonant contribution is more important, the pump laser convolved CARS spectrum is relatively more continuous leading to the participation of many more dye laser modes in Eq. (1). In the limit of a continuous featureless nonresonant spectrum the theoretical noise becomes 7.9% indepen-dent of frequency and pump laser bandwidth. This is in good agreement with the experimental value of 7.7% obtained from nonresonant CARS spectra using a sin-gle-mode pump laser and an analysis bandwidth of 70 cm-' (Table I). (As noted above and observed previ-ously6the experimental noise is a weak function of the analysis bandwidth.) Thus the experimental noise observed in both the resonant N2flame spectra and the
35 30 25 0 z 20 '5 to 0I 0 21060 21070 21080 21090 21100 21110 FREQUENCY CM` 21120 21130 21140
Fig. 1. Top: CARS noise (single standard deviation) for single-mode pump laser: dotted curve, theoretical; solid curve, observed. Bottom: 400 pulse average single-mode CARS spectrum. The theoretical calculations were based on an assumed dye laser mode spacing of 0.02 cm'1. The equivalent width of the asymmetric Voigt
instrument function used in the calculations was 1.89 cm-1.
nonresonant CO2spectra are in satisfactory agreement
with Eq. (1) if a dye laser mode spacing of 0.02 cm-' is assumed.
The limited number of previous comparisons of cal-culated and observed noise8 "10"'1 have used spectrally averaged values. The structure in the spectral noise curves (Figs. 1 and 2) indicates the importance of spec-ifying the exact bandwidth in such comparisons.
The experimental and theoretical noise curves (us-ing the same 0.02-cm'1 dye laser mode spac(us-ing as-sumed for the single-mode pump laser comparison) for pump laser bandwidths of 0.1 and 0.69 cm-' are shown in Fig. 2. The 0.1-cm'1 results are in satisfactory agreement, but, for the larger pump laser bandwidth, the calculated curve underestimates the observed noise. That there is an additional source of noise in the CARS spectra to that represented by Eq. (1) is not surprising, since this equation predicts the noise in nonresonant CARS spectra to be independent of laser bandwidth, which is in disagreement with the experi-mental data reproduced in Table I. From a more detailed analytic analysis, Hall and Greenhalgh'2 also conclude that the noise in nonresonant CARS spectra should be largely independent of pump laser band-width. However, the assumption of uncorrelated pump and Stokes laser beams inherent in this analysis and in the derivation of Eq. (1) may be invalid for the
21060 21070 21080 21090 21100 21110 21120 21130 21140
FREQUENCY CM-'
Fig. 2. Theoretical (dotted curve) and observed (solid curve) CARS noise (single standard deviation). Top: 0.10-cm-1 multimode pump laser. Bottom: 0.69-cm-' multimode pump laser. The the-oretical calculations were based on an assumed dye laser mode spacing of 0.02 cm-1. The equivalent width of the asymmetric Voigt
instrument function used in the calculations was 2.04 cm-1.
multimode pump laser results in Fig. 2. In fact, inten-sity correlations have been observed between the Stokes and pump lasers in that the temporal profile of the Stokes laser attempts to follow that of the multi-mode pump laser.6 These correlations between the temporal profiles of the pump and Stokes lasers, which vary over the Stokes spectral profile, have been ad-duced3'6'9"0 to explain the observed increase in the nonresonant CARS noise with increasing pump laser bandwidths.
The dye laser used in our experiments is an oscilla-tor/amplifier configuration with an amplifier gain of -4. Both the oscillator and amplifier are pumped slightly off-axis. The high-gain near-saturated ampli-fier, which dominates the output of our dye laser, has a temporal profile that follows that of the pump laser.6 We have observed6 a spectral dependence to the Stokes laser temporal amplitude profiles which can account for one source of noise. The temporal behav-ior of the Stokes laser may be a function of the pump-ing geometry,'2 which can vary from one CARS system to another.
We can estimate this temporal contribution to the observed nonresonant noise by assuming that the sin-gle-mode noise is attributable to mode noise only [Eq. (1)1 and subtracting this component from the multi-mode noise. Assuming that the temporal crT and mode
4300 APPLIED OPTICS / Vol. 26, No. 19 / 1 October 1987
15 000 10 0 2000 O- I-z 1-z 1500 1000 500
noise CM contributions are uncorrelated the net noise
cN is given by
(4)
For the 70-cm'1 bandwidth CrT is 6.7% (0.1-cm-' multi-mode pump laser) and 7.1% (0.69-cm'1 multimulti-mode pump laser).
This temporal noise component can also qualitative-ly account for the differences observed between the calculated and theoretical spectra in Fig. 2. While a detailed comparison is not warranted, Eq. (4) can be used to obtain the net calculated noise with the values
of crT given above. It can be readily shown that this
would increase the calculated noise by 1-2% (0.1-cm-' multimode pump) and 2-3% (0.69-cm-' multimode pump) in the central higher-intensity region of the CARS resonant spectrum. This would improve the agreement between calculated and observed noise, particularly for the 0.69-cm-' data.
Returning to the question of mode noise as repre-sented by Eq. (1) we can see that, although the spectral forms of the theoretical noise curves are in good agree-ment with the single-mode experiagree-ment, the absolute fit was obtained by selecting a Stokes (dye) laser mode spacing of 0.02 cm-'. It has been suggested that CARS generation is dominated by the longitudinal TEMoo modes.8"13 The longitudinal mode spacing in our dye laser6"10is -0.009 cm- or about one-half of the mode spacing assumed to fit the data in Fig. 1. By deliberately inducing some spherical aberration in the dye laser we observed a drop in noise that was attribut-ed to the greater participation of higher-order trans-verse modes in the CARS generation with the aberrat-ed beam.'0 The contribution of these higher-order modes in the absence of deliberately induced aberra-tion is unclear. However, their participaaberra-tion in the CARS generation would further increase the discrep-ancy noted above. The larger Stokes laser mode spac-ing required to fit the data in Fig. 1 may result from the systematic absence of modes in the dye laser output. A more likely explanation is that mode correlations, such as those observed in a multimode pulsed dye laser,'4 may also contribute to the reduction in the effective number of independent modes contributing to Eq. (1). These mode correlations have been inter-preted in terms of a simple model that calculates the effect of gain competition on the modes.'4
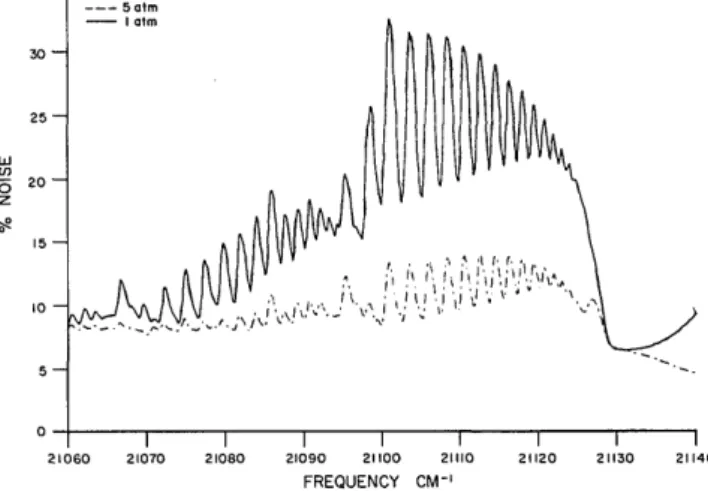
While the above results show that at atmospheric pressure the single-mode resonant spectra are consid-erably noisier than the 0.69-cm-1 multimode spectra, this difference is expected to decrease with increasing pressure. The broadening of the Raman resonances leads to the contribution of a greater number of Stokes laser modes, and, in the limit of completely overlap-ping lines, the number of modes contributing is inde-pendent of pump laser bandwidth. The effect of
pres-sure on the calculated single-mode noise is
demonstrated in Fig. 3 where theoretical noise curves are shown for pressures of 1 and 5 atm. It can be seen that, as expected, there is a dramatic decrease in noise with increasing pressure down to a level approaching
35 30 25 -0 20_ w 15-10 - 5-21060 - 5 It,n I m I I I l 21070 21080 21090 21100 FREQUENCY CM l I I 21110 21120 21130 21140
Fig. 3. Theoretical CARS noise for single-mode pump laser: solid curve, 1 atm; dot-dash curve, 5 atm. The theoretical calculations were based on an assumed dye laser mode spacing of 0.02 cm-1.
the 1-atm 0.69-cm-1 pump laser bandwidth results shown in Fig. 2. The calculations show that there is little difference between the single-mode and 0.69-cm-' multimode noise at 5-atm pressure.
Ill. Conclusions
We have shown that the spectral form of the CARS noise with varying pump laser bandwidth can be inter-preted in terms of Stokes laser mode noise [Eq. (1)] and an additional term, which we have attributed to tem-poral variations in the multimode laser pulses. The Stokes laser mode spacing, which is required to fit calculated and experimental noise curves, is about one-half of the expected longitudinal mode spacing in our Stokes laser and may be indicative of missing modes or, more likely, of mode correlations, which reduce the number of independent modes. While the results indicate that at atmospheric pressure a multi-mode pump laser will lead to substantially lower noise in resonant nitrogen CARS spectra, the advantage over a single-mode pump source is greatly reduced at higher pressure (5 atm). At higher pressures, as the Raman spectrum becomes less structured, the reso-nant nitrogen CARS spectral noise is expected to ap-proach the nonresonant limit where a single-mode
pump source now leads to lower CARS noise.
References
1. S. A. J. Druet and J. P. E. Taran, "CARS Spectroscopy," Prog. Quantum Electron. 7, 1 (1981).
2. R. J. Hall and A. C. Eckbreth, "Coherent Anti-Stokes Raman Spectroscopy (CARS): Application to Combustion Diagnos-tics," in Laser Applications, Vol. 5, J. F. Ready and R. K. Erif, Eds. (Academic, New York, 1984), pp. 213-309.
3. A. C. Eckbreth, G. M. Dobbs, J. H. Stufflebeam, and P. A. Tellex, "CARS Temperature and Species Measurements in Augmented Jet Engine Exhausts," Appl. Opt. 23, 1328 (1984).
4. R. L. Farrow, R. P. Lucht, G. L. Clark, and R. E. Palmer, "Species Concentration Measurement using CARS with Non-resonant Susceptibility Normalization," Appl. Opt. 24, 2241 (1985).
1 October 1987 / Vol. 26, No. 19 / APPLIED OPTICS 4301
5. L. P. Goss, D. D. Trump, B. G. MacDonald, and G. L. Switzer, "10 Hz Coherent Anti-Stokes Raman Spectroscopy Apparatus for Turbulent Combustion Studies," Rev. Sci. Instrum. 54, 563 (1983).
6. D. R. Snelling, R. A. Sawchuk, and R. E. Mueller, "Single Pulse CARS Noise: A Comparison Between Single-Mode and Multi-mode Pump Lasers," Appl. Opt. 24, 2771 (1985).
7. M. Pealat, P. Bourchardy, M. Lefebvre, and J. P. Taran, "Preci-sion of Multiplex CARS Temperature Measurements," Appl. Opt. 24, 1012 (1985).
8. D. A. Greenhalgh and S. T. Whittley, "Mode Noise in Broad-band CARS Spectroscopy," Appl. Opt. 24, 907 (1985). 9. A. C. Eckbreth and J. H. Stufflebeam, "Considerations for the
Application of CARS to Turbulent Reacting Flows," Exp. Fluids 3, 301 (1985).
10. D. R. Snelling, G. J. Smallwood, R. A. Sawchuk, and T. Parames-warm, "Precision of Multiplex CARS Temperatures using both Single-Mode and Multimode Pump Lasers," Appl. Opt. 26, 99 (1987).
11. S. Kroll, M. Alden, T. Berglind, and R. J. Hall, "Noise Charac-teristics of Single Shot Broadband Raman-resonant CARS with Single- and Multimode Lasers," Appl. Opt. 26, 1068 (1987). 12. R. J. Hall and D. A. Greenhalgh, "Noise Properties of
Single-Pulse Coherent Anti-Stokes Raman Spectroscopy with Multi-mode Pump Sources," J. Opt. Soc. Am. B 3, 1637 (1986). 13. R. E. Teets, presented at First International Laser Science
Conferences (Dallas, 1985).
14. L. A. Westling, M. G. Raymer, and J. J. Snyder, "Single-Shot Spectral Measurements and Mode Correlations in a Multimode Pulsed Dye Laser," J. Opt. Soc. Am. B 1, 150 (1984).
Meetings Calendar continued from page 4292
1988 March
13-15 2nd Int. Conf. on Artificial Intelligence Systems, Chica-go Int. Academy of Cytology, 5841 Maryland Ave.,
House Mail Box #449, Chicago, IL 60637
13-18 Advances in Semiconductors & Semiconductor Struc-tures Mtg., Orlando SPIE, P.O. Box 10, Bellingham,
WA 98227
13-18 Optics & Optoelectronics Symp. Southeast, Orlando
SPIE, P.O. Box 10, Bellingham, WA 98227
16-18 7th Ann. IEEE Phoenix Conf. on Computers & Commu-nications, Scottsdale IEEE, E. 42nd St., New York,
NY 10017
20-25 4th Int. Congr. on Advances in Non-Impact Printing Technologies, New Orleans SPSE, 7003 Kilworth
Lane, Springfield, VA 22151
23-25 Optical Bistability Top. Mtg., Aussois, France OSA
Mtgs. Dept., 1816 Jefferson Pl., N.W., Wash., DC
20036
28-30 LEOS/OSA Top. Mtg. on Integrated & Guided-Wave Optics, Santa Fe OSA Mtgs. Dept., 1816
Jef-ferson Pl., N.W., Wash., DC 20036
29-31 Optical Storage of Documents & Images Mtg., Wash., DC TOC, P.O. Box 14817, San Francisco, CA 94114
April
4-8 Tech. Symp. Southeast on Optics, Electro-Optics, & Sensors, Orlando SPIE, P.O. Box 10, Bellingham,
WA 98227
5-8 Process Diagnostics Mtg., Reno A. Hays, Div. 1831,
Sandia Natl. Labs., Albuquerque, NM 87185
5-8 Materials Research Soc. Mtg., Reno MRS, 9800
McKnight Rd., Ste. 327, Pittsburgh, PA 15237
12-14 Optical Interference Coatings Top. Mtg., Tucson
OSA Mtgs. Dept., 1816 Jefferson Pl., N.W., Wash., DC 20036
13-15 4th Int. Conf. on Metrology & Properties of Eng. Sur-faces, Gaithersburg T. Vorburger, A117 Metrology
Bldg., NBS, Gaithersburg, MD 20899
14 Spectroradiometric Measurement Mtg., Teddington
G. Freeman, Natl. Physical Lab., Teddington, Mid-dlesex TWl OLW, England
19-21 Int. Aerospace & Ground Conf. on Lightning & Static Electricity, Oklahoma City D. MacGorman, Natl.
Severe Storm Lab., 1313 Halley Circle, Norman, OK
73069
19-22 Analytica 88, Munich G. Kallman, Kallman Assocs., 5
Maple Court, Ridgewood, NJ 07450
20-27 Optec '87, Hannover Hannover Fairs USA Inc., 103
Carnegie Ctr., P.O. Box 7066, Princeton, NJ 08540
25-29 Conf. Lasers & Electro-Optics, Anaheim OSAMtgs. Dept., 1816 Jefferson Pl., N. W., Wash., DC 20036
26-28 Fibre Optics '88, Olympia Sira Ltd. Conf. Off., South
Hill, Chislehurst, Kent BR7 5EH, England
May
2-6 Int. Conf. on Nonlinear Optical Phenomena, Ashford Castle, Ireland NLO '88, P.O. Box 245, McLean, VA
22101
9-13 New Mexico State U. Short Courses in Applied Optics, Las Cruces L. Radziemski, Physics Dept., NMSU
Las Cruces, NM 88003
continued on page 4312