READ THESE TERMS AND CONDITIONS CAREFULLY BEFORE USING THIS WEBSITE. https://nrc-publications.canada.ca/eng/copyright
Vous avez des questions? Nous pouvons vous aider. Pour communiquer directement avec un auteur, consultez la première page de la revue dans laquelle son article a été publié afin de trouver ses coordonnées. Si vous n’arrivez pas à les repérer, communiquez avec nous à PublicationsArchive-ArchivesPublications@nrc-cnrc.gc.ca.
Questions? Contact the NRC Publications Archive team at
PublicationsArchive-ArchivesPublications@nrc-cnrc.gc.ca. If you wish to email the authors directly, please see the first page of the publication for their contact information.
NRC Publications Archive
Archives des publications du CNRC
This publication could be one of several versions: author’s original, accepted manuscript or the publisher’s version. / La version de cette publication peut être l’une des suivantes : la version prépublication de l’auteur, la version acceptée du manuscrit ou la version de l’éditeur.
Access and use of this website and the material on it are subject to the Terms and Conditions set forth at
Engineering applications of thermal infrared imagery and impulse radar data for the analysis of ice integrity for transportation purposes
Kirby, M. E.; Sutton, J. T.; MacKay, H. W.; Rossiter, J. R.; Sinha, N. K.
https://publications-cnrc.canada.ca/fra/droits
L’accès à ce site Web et l’utilisation de son contenu sont assujettis aux conditions présentées dans le site LISEZ CES CONDITIONS ATTENTIVEMENT AVANT D’UTILISER CE SITE WEB.
NRC Publications Record / Notice d'Archives des publications de CNRC: https://nrc-publications.canada.ca/eng/view/object/?id=d0325cc1-4032-4d7f-8fe1-517cfd33e04c https://publications-cnrc.canada.ca/fra/voir/objet/?id=d0325cc1-4032-4d7f-8fe1-517cfd33e04c
Ser
TH1
N21d
,
no, 1458 National Research Conseil national
I
m*
Council Canada de recherches CanadaBLDG
- -- Institute for lnstitut de
Research in recherche en Construction construction
Engineering Applications of Thermal
Infrared Imagery and Impulse Radar
Data for the Analysis of Ice Integrity
for Transportation Purposes
by M.E. Kirby, J.T. Sutton, H.W. MacKay, J.R. Rossiter and N.K. Sinha
A N A L Y Z ~ D
Appeared in
Proceedings 1986 ASPRS
-
ACSM Fall Convention Anchorage, Alaska, September 28-October 3, 1986 Technical Papers, p. 38-
48(IRC Paper No. 1458)
Reproduced with permission
Technical Papers, 1986 ASPRS-ACSM Fall Convention copyright 1986, by the ASPRS and the ACSM
Price $2.00 NRCC 27713
Afin d16valuer llutilitS des msthodes de tGl6dEtection pour dsceler et identifier les dSfauts de la glace, on a effectus des vols de reconnaissance dans un aSronef SquipS de balayeurs 3 infrarouge thermique haute rssolution et dlun radar B impulsions. Les donnks recueillies lors des missions ont St& ensuite comparles aux observations sur le terrain. Ce document fait Stat des rSsultats de ces recherches et decrit quelquesvnes des caractsristiques de la glace qui ont St6 elairement identifises au moyen de la t6lSd6tection.
ENGINEERING APPLICATIONS OF THERMAL INFRARED IMAGERY AND IMPULSE RADAR DATA FOR THE ANALYSIS OF
ICE INTEGRITY FOR TRANSPORTATION PURPOSES M.E. Kirby, J.T. Sutton, H.W. MacKay
INTERA Technologies Ltd. 1525 Carling Avenue, Suite 600 Ottawa, Ontario, Canada K1Z 8R9
J.R. Rossiter
Canpolar Consultants Ltd. 421 Eglinton Ave. W., Suite 4 Toronto, Ontario, Canada M5N 1A4
N. Sinha
National Research Council of Canada Bldg. M20, Montreal Road
Ottawa, Ontario, Canada K1A OR6
ABSTRACT
In order to evaluate the utility of remote sensing methods for the detection and identification of ice flaws, a series of research flights was conducted using a high resolution thermal infrared scanner and an impulse radar from airborne platforms. The airborne data missions were then compared with surface truth observations. This paper will discuss the results of that research and present examples of the specific ice features that were clearly identified by the remote sensing technique.
INTRODUCTION
In order to conduct the evaluation of the remote sensing techniques a combined program was organized between Intera Technologies, Canpolar Consultants, the National Research Council of Canada and the National Capital Commission in Ottawa. The purpose of the program not only included a technique assessment process, but it also involved supporting a national festive event known as Winterlude. This event involved multiple activity usage of the freshwater ice on the Ottawa River including surface vehicular traffic and parking for trucks, cars and snowmobiles, surface storage and a variety of racing activities. The location and diverse nature of the ice usage afforded the research team an excellent opportunity to acquire both airborne and surface truth information during the winter of 1984 and 1985.
REMOTE SENSING SYSTEM SUMMARIES
The remote sensing data were provided from two quite different but complementary systems: an airborne infrared line scanner and an airborne impulse radar. The infrared line scanner data produced a comprehensive overview, in image format, of the general ice conditions as the ice
developed. Coarse ice thickness descriptions and ice
feature identifications were also made from the imagery. The impulse radar data on the other hand produced deta'iled relative ice thickness data along a designated ice road in
a linear profile format. The two data types were then
used in conjunction with a surface truth exercise to provide a thorough and complete summary of the ice conditions.
Brief descriptions of the two remote sensing systems are presented below.
Airborne Thermal Infrared Line Scanner
The system is mounted in an INTERA aircraft (Cessna 310) which has been modified to allow the scanning mirror to look through an opening in the floor of the aircraft.
The concept is based on the well known principle that any
object whose temperature is above absolute zero (-273°C) emits some amount of infrared energy. A constant source of emission is thus available from both natural and manrmade objects.
The infrared energy from the scene beneath the aircraft is reflected from the scanning mirror onto the parabolic mirror, via a flat mirror and finally focuses on the detector chip. The detector is cooled by liquid nitrogen (77" Kelvin) which surrounds the chip in its vacuum
container. The reason for the cooling is to reduce
electrical noise and thus improve the sensitivity of the detector. As the infrared energy impinges on the detector chip, it produces a small voltage which is directly proportional to the strength of the incoming energy. This small voltage is then amplified hundreds of times until it
is large enough to be tape recorded. Thus, the detector
output voltage recorded on magnetic tape is directly
proportional to the radiation temperature of the objects
"
seen" by the scanner.As the scanning mirror spins at its fixed rate of 80 scans per second, it "looks" at a ground path (or total field of view) of 77" for each scan. This scan path is at right
angles to the aircraft flight path. If the aircraft is
flying at 300 metres above the ground, the area covered
for each scan will be 0.5 metres by 490 metres. As the
aircraft moves forward, a new area is subsequently scanned adjacent to the previous scan path, etc.
The control signals include synchronization pulses for each scan which have been corrected by the gyro mounted on
compensating signal from the gyro corrects the synchronizing pulses prior to tape recording. A real time image product is produced on the aircraft for immediate review.
After the flight, the magnetic tape is replayed to produce
an image on high quality film. This process includes
converting the electrical signal stored on tape into light
intensities which are then film recorded. A cathode ray
tube is used for this operation. The light intensity
produced on the screen in this case is directly proportional to the electrical signal on the tape. Since the tape signal is a faithful recording of the infrared detector signal, the infrared energy has now been
converted to light intensities which expose a film. The
resulting thermal infrared imagery displays the radiation temperature of all objects in the scene as grey tones on
the film each representing a definite radiation
temperature increment.
Aerial thermal infrared imagery was acquired from the INTERA Ottawa base to map the actual temperature patterns
of ice features from shore to shore. During the early
winter the river water had a temperature that was at or
above 0°C. When the air temperature is below O°C a
positive driving force is established between the air and
the flowing water. Conventionally, heat moves from warm
to cold. Thin ice represents less resistance to this heat
flow. Thermal infrared imagery systems are capable of
detecting differences in temperature in the order of
O.l°C. Remembering that -9.g°C is warmer than ;.lO°C,
positive temperature anomalies associated with thin ice can be mapped using this technique.
The infrared imagery provided a good aerial view of the entire region and aided in identifying sites for surface truth, the surface clearing zones and the impulse radar flight tracks.
Airborne Impulse Radar
Ice formed from fresh water is very transparent to radar
waves in a very high frequency ( V H F ~ band.
-
Impulse radarshave been developed to take advantage of this fact for
measuring ice thickness. A very short pulse, a few
billionths of a second (a few nanoseconds) long, is sent
out by a transmitting antenna mounted under the
helicopter. This pulse is partially reflected from the
ice surface and partially transmitted through the ice. The portion that enters the ice is almost completely reflected by the ice bottom surface and returns to the receiver. The length of time that it takes this pulse to travel through the ice and back again is a direct measure of the ice thickness. As the ice thickens, the time delay between the two echoes becomes greater. Features such as cracks at either the top or bottom of the ice act as point reflectors to the radar signal and can therefore be detected.
For most sea ice applications radars in the 120 MHz range are used to penetrate a variety of ice types including young ice that has a relatively impervious surface layer of brine. Without a layer of brine fresh water ice can be penetrated with a radar in a higher frequency, for example in the 400 MHz range. The higher frequency has the added benefit of providing slightly better resolution with a reasonable antenna size. For this research program a new
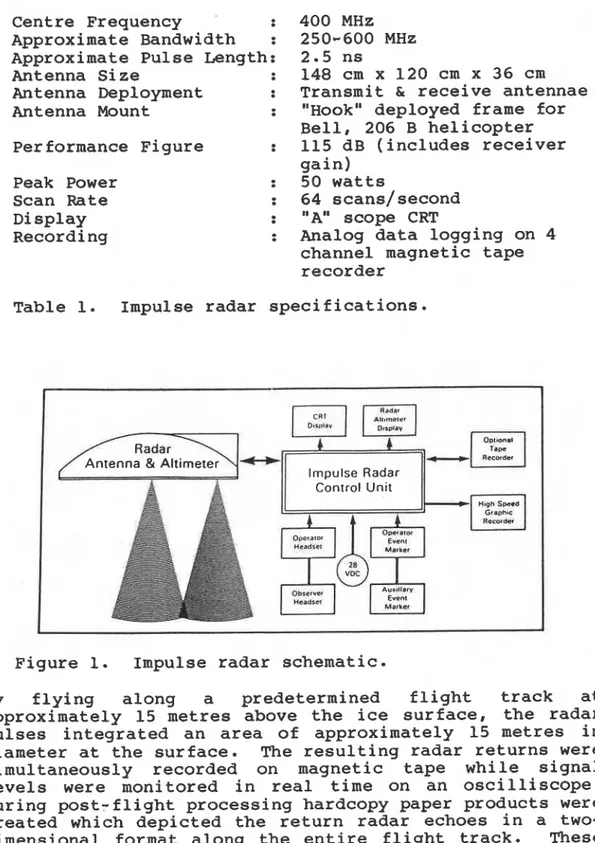
400 MHz antenna was built for testing and operations. The particular specifications for this radar are summarized in Table 1 and Figure 1.
Centre Frequency
Approximate Bandwidth : Approximate Pulse Length: Antenna Size Antenna Deployment Antenna Mount Performance Figure Peak Power Scan Rate Display Recording 400 MHz 250-600 MHz 2.5 ns 148 cm x 120 cm x 36 cm Transmit & receive antennae
"Hook" deployed frame for Bell, 206 B helicopter 115 dB (includes receiver gain) 50 watts 64 scans/ second "A" scope CRT
Analog data logging on 4 channel magnetic tape recorder
Table 1. Impulse radar specifications.
Figure 1. Impulse radar schematic.
By flying along a predetermined flight track at approximately 15 metres above the ice surface, the radar pulses integrated an area of approximately 15 metres in diameter at the surface. The resulting radar returns were simultaneously recorded on magnetic tape while signal levels were monitored in real time on an oscilliscope. During post-flight processing hardcopy paper products were created which depicted the return radar echoes in a two- dimensional format along the entire flight track. These
impulse radar profiles were then carefully analyzed to determine the average ice thickness for the area of interest as well as to detect unique features such as hyperbolic returns that may have indicated the presence of water and ice cracks.
DATA ACQUISITION AND ANALYSIS
Airborne Thermal Infrared Imagery: Winter 1984
During the 1983/84 winter season, two infrared flights were conducted (~ecember 21, 1983 and January 16, 1984) in conjunction with surface truth measurements and observations.
Thermal Infrared Imagery: December 21, 1983. Through- out the month of December, the temperatures were unseasonably low which encouraged the formation and development of the river ice. Relatively little precipitation occurred during this period which also promoted ice formation. Towards the latter part of December a significant snowfall was forecast. At that point the first airborne thermal infrared flight was conducted.
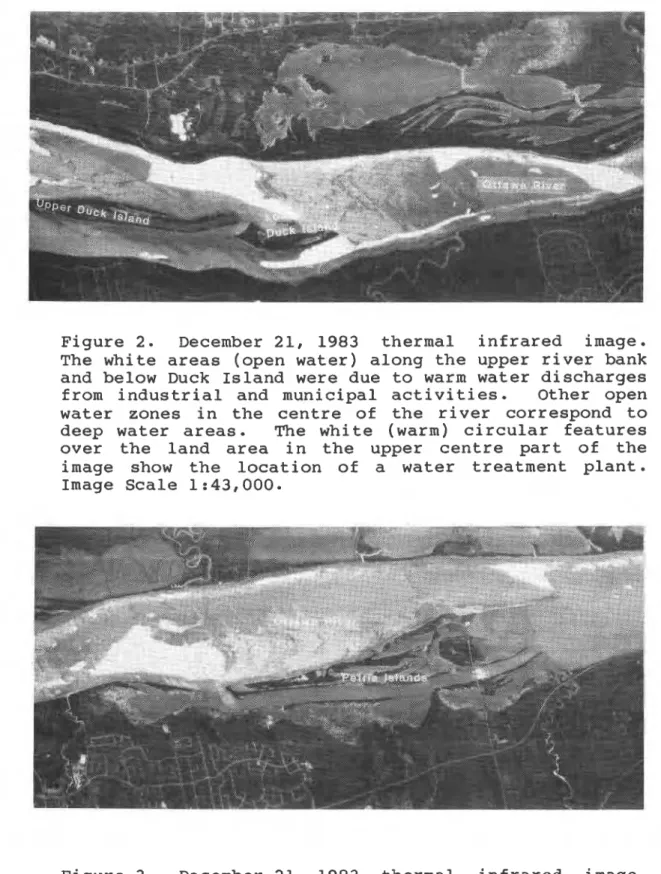
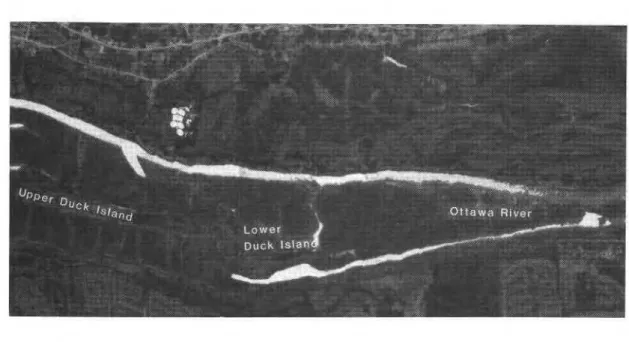
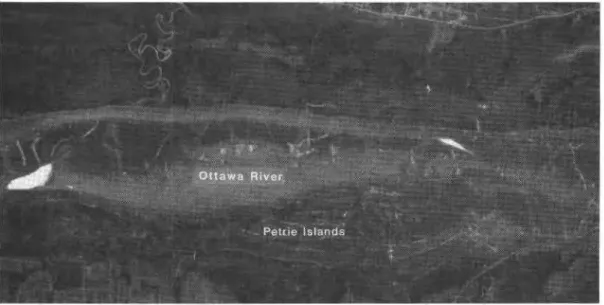
Throughout the study region it was apparent from the imagery that significant ice development had occurred. However, there were apparent zones where open water was present. In addition, variable ice thicknesses were evident along much of the area as depicted by the different grey tones in the imagery in Figures 2 and 3. Brief explanations of the ice conditions along the course are also included with the imagery. In interpreting the imagery, the data are presented in a positive format so that the white areas in the imagery on the river represent the warmer (O°C) open water regions, while the greyer portions represent the colder ice, with the darker parts corresponding to the thicker ice areas.
As a result of the first flight imagery, specific areas were identified as requiring closer investigation. The surface truth team then conducted ice tests at selected points. In areas that appeared uniform in ice cover, the average ice thickness was approximately 30 centimeters.
Figure 2. December 21, 1983 thermal infrared image. The white areas (open water) along the upper river bank and below Duck Island were due to warm water discharges
from industrial and municipal activities. Other open
water zones in the centre of the river correspond to
deep water areas. The white (warm) circular features
over the land area in the upper centre part of the image show the location of a water treatment plant.
Image Scale 1 : 43,000.
Figure 3. December 21, 1983 thermal infrared image. The white open water region and the light grey thin ice areas near Petrie Island correspond to a deep water channel. Image Scale 1:43,000.
Thermal Infrared Imagery: January 16, 1984. Between
the time of the December fliqht and this second mission,
cold temperatures had with continued ice growth.
Surface truth measurements revealed an average ice
the previous month. In addition a significant amount of snow had fallen prior to the second flight which had the effect of slowing the rate of ice development as well as resulted in the formation of a number of ice bridges.
From the dark tones on the imagery, there is evidence that the ice had thickened over most regions. However, there were still a number of areas that had not frozen over by the time of the flight.
Figure 4. January 16, 1984 thermal infrared image. As this image shows, most of the river had frozen over. Most of the large open water areas near the islands in the December data had become much smaller. The warm open water areas near both shores were covered with snow bridges and for the most part were not visible to the human eye, creating a major hazard for intended ice usage. Expansion joints and thermal cracks are also apparent on the imagery perpendicular to the river. Most of these cracks were not visible from the surface due to the snow cover. By using the real time imagery as a reference, it was possible for the surface truth team to locate these cracks, most of which were only millimetres in width at the surface. The cracks were detectable from the infrared imagery due to water seepage on the surface of the ice under the snow.
Figure 5. January 16, 1984 thermal infrared image. As with the other areas of the river, the warm open water and thin ice areas have decreased and the cracks across the river are apparent. Image Scale 1:43,000.
Airborne Impulse Radar Data: February 2 , 1984
On February 1 the impulse radar was installed in a Bell 206 helicopter. During that day and for the next few days a significant surface truth exercise was performed. Many ice thickness measurements were taken along the intended flight path of the impulse radar system. Visible markers were placed on the ice for reference purposes and two 100 square foot areas were covered with metal screening to serve as amplitude surface reference points for measuring the strength of the return radar signal.
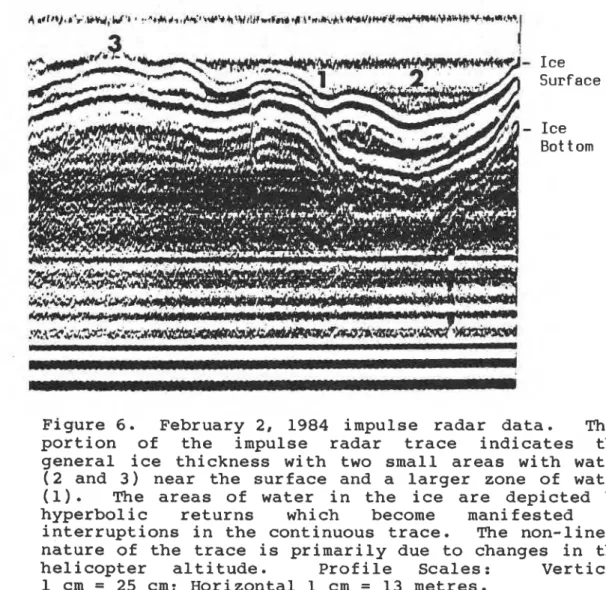
On February 2 some 50 line kilometres of impulse radar data were flown over an ice road that had been cleared of snow. It was apparent from the impulse radar data that there was a consistent ice thickness of about 40 centi- metres along the road. This thickness measure was verified by a series of ice cores. In addition, the impulse radar data indicated a number of hyperbolic returns that were found to correspond with the presence of water, thin ice and cracks (~igure 6). In one case the impulse radar profile indicated the presence of a zone of water about 18 centimetres deep near the ice surface. This was later confirmed by the surface truth team which revealed a large water pocket with a thin (2 cm) covering layer of ice and a thicker (19 cm) lower layer of ice.
-
Ice SurfaceFigure 6. February 28 1984 impulse radar data. This portion of the impulse radar trace indicates the general ice thickness with two small areas with water (2 and 3) near the surface and a larger zone of water (1). The areas of water in the ice are depicted by hyperbolic returns which become manifested as interruptions in the continuous trace. The non-linear nature of the trace is primarily due to changes in the helicopter altitude
.
Profile Scales: Vertical1 cm = 25 cm; Horizontal 1 cm = 13 metres.
Airborne Thermal Infrared Imagery: Winter 1985
. t h e l i g h t swere
conducted (~anuary 38 1985 and January 298 1985), again in support of the activities related to the use of the river ice for the Winterlude program. Surface truth observations were also made for comparison with the
imagery.
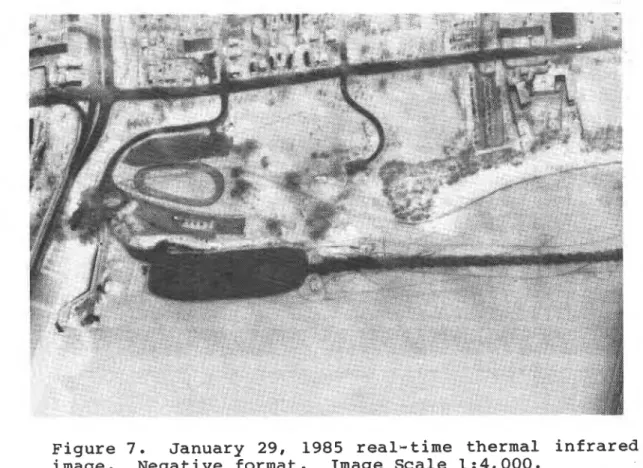
Figure 7 is a sample of the real-time imagery produced onr board the aircraft during the January 29 flight. Unlike the images previously presented in this paper, Figure 7 is presented in a negative format with the darker grey tones representing the warmer temperatures. The survey was conducted at 1445 hours EST at a flying altitude of 400 metres above mean ground level. Maintenance crews were conducting surface flooding of an ice skating corridor at the time of the survey. The flooding technique used was to extend a hose through a 20 centimetre bored hole to water below the ice. Water was pumped up the hose and dispersed in a circular fashion around the hole. Figure 7 shows the beginning of the
skating corridor extending easterly from the end of a speed skating oval. The individual bore holes are identifiable within the circular flooding patterns extending out along the corridor. Water covers the first 6 circular flooding patterns extending from the oval. Snowmobile tracks are easily recognizable paralleling either side of the skating corridor. An interesting thermal phenomenon is the thermal shadow created on the snow covered river surface below the western bridge. Individual girders and beams can be recognized within the shadow. The temperature variance between the bridge thermal shadow and the ambient ice background was 0.16'C.
Figure 7. January 29, 1985 real-time thermal infrared image. Neuative format. Image Scale 1:4,000.
DISCUSSION AND CONCLUSIONS
Overall the systems provided different, but complementary, perspectives of the ice characteristics. The airborne thermal infrared imagery provided a detailed overview of the entire race course during and after ice formation. From the imagery, it was possible to identify the consistent ice parts with the areas that remained open. In addition the imagery was considered valuable in pinpointing areas that required further surface truthing. At the same time, the impulse radar data played an important role in determining the specific ice thicknesses along the exact ice road. In this manner, it was possible to make ice core samples at selected points to easily verify the impulse radar data, rather than depend solely on a large, time consuming, team of personnel to take stratified ice thickness samples which could run the risk of missing important features.
In conclusion, the combination of the thermal infrared imagery and the impulse radar data with the surface truth program, provided a comprehensive and effective source of information regarding the ice conditions. This type of information can be further complemented by more detailed measurements for variables such as ice deflection using direct current displacement transducers (DCDT) which are used to measure the precise effects of load on an ice medium. The use of remote sensing techniques in conjunction with surface truth sampling can provide invaluable information regarding general and detailed ice conditions.
ACKNOWLEDGEMENTS
The authors would like to express their gratitude to the National Capital Commission .in Ottawa for their support during this program.
In
addition the authors would like to acknowledge the contributions of Intertask Ltd., Instrumar Ltd., Pan-Air Helicopters Ltd. and the National Research Counci 1 of Canada.T h i s paper i s being d i s t r i b u t e d i n r e p r i n t form by t h e I n s t i t u t e f o r Research i n C o n s t r u c t i o n . A l i s t of b u i l d i n g p r a c t i c e and r e s e a r c h p u b l i c a t i o n s a v a i l a b l e from t h e I n s t i t u t e may be o b t a i n e d by w r i t i n g t o t h e P u b l i c a t i o n s S e c t i o n , I n s t i t u t e f o r Research i n C o n s t r u c t i o n , N a t i o n a l Research C o u n c i l of C a n a d a , O t t a w a , O n t a r i o , K1A 0R6.
C e document e s t d i s t r i b u g sous forme de t i r g - a - p a r t p a r 1' I n s t i t u t de r e c h e r c h e e n c o n s t r u c t i o n . On p e u t ~ b t e n i r une l i s t e d e s p u b l i c a t i o n s de l t I n s t i t u t p o r t a n t s u r les t e c h n i q u e s ou les r e c h e r c h e s e n m a t i s r e d e bdtiment en d c r i v a n t 3 l a S e c t i o n d e s p u b l i c a t i o n s , I n s t i t u t de r e c h e r c h e en c o n s t r u c t i o n , C o n s e i l n a t i o n a l d e r e c h e r c h e s du Canada, Ottawa ( O n t a r i o ) , KIA OR6.