HAL Id: hal-02114652
https://hal.inria.fr/hal-02114652v2
Submitted on 1 May 2019
HAL is a multi-disciplinary open access
archive for the deposit and dissemination of
sci-entific research documents, whether they are
pub-lished or not. The documents may come from
teaching and research institutions in France or
abroad, or from public or private research centers.
L’archive ouverte pluridisciplinaire HAL, est
destinée au dépôt et à la diffusion de documents
scientifiques de niveau recherche, publiés ou non,
émanant des établissements d’enseignement et de
recherche français ou étrangers, des laboratoires
publics ou privés.
Sound Event Detection from Partially Annotated Data:
Trends and Challenges
Romain Serizel, Nicolas Turpault
To cite this version:
Romain Serizel, Nicolas Turpault. Sound Event Detection from Partially Annotated Data: Trends
and Challenges. IcETRAN conference, Jun 2019, Srebrno Jezero, Serbia. �hal-02114652v2�
SOUND EVENT DETECTION FROM PARTIALLY ANNOTATED DATA: TRENDS AND
CHALLENGES
Romain Serizel, Nicolas Turpault
Universit´e de Lorraine, CNRS, Inria, LORIA, F-54000 Nancy, France
ABSTRACT
This paper proposes an overview of the latest advances and challenges in sound event detection and classification with systems trained on partially annotated data. The paper fo-cuses on the scientific aspects highlighted by the task 4 of DCASE 2018 challenge: large-scale weakly labeled semi-supervised sound event detection in domestic environments. Given a small training set composed of weakly labeled audio clips (without timestamps) and a larger training set composed of unlabeled audio clips, the target of the task is to provide not only the event class but also the event time boundaries given that multiple events can be present in an audio clip. This paper proposes a detailed analysis of the impact of the time segmentation, the event classification and the methods used to exploit unlabeled data on the final performance of sound event detection systems.
Index Terms— Sound event detection, Weakly labeled data, Semi-supervised learning, Audio segmentation, DCASE 2018
1. INTRODUCTION
We are constantly surrounded by sounds and we rely heavily on these sounds to obtain important information about what is happening around us. Ambient sound analysis aims at au-tomatically extracting information from these sounds. It en-compasses disciplines such as sound scene classification (in which context does this happen?) or sound event detection and classification (SED) (what happens during this record-ing?) [1]. This area of research has been attracting a continu-ously growing attention during the past years as it can have a great impact in many applications including smart cities, au-tonomous cars or ambient assisted living.
DCASE 2018 task 4 (large-scale weakly labeled semi-supervised sound event detection in domestic environments) This work was made with the support of the French National Re-search Agency, in the framework of the project LEAUDS Learning to under-stand audio scenes (ANR-18-CE23-0020) and the French region Grand-Est.Experiments presented in this paper were carried out using the Grid5000 testbed, supported by a scientific interest group hosted by Inria and includ-ing CNRS, RENATER and several Universities as well as other organizations (see https://www.grid5000)
focused on SED with time boundaries in domestic applica-tions [2]. The systems submitted had to detect when an sound event occurred in an audio clip and what was the class of the event (as opposed to audio tagging where only the presence of a sound event is important regardless of when it happened). We proposed to investigate the scenario where a large scale corpus is available but only a small amount of the data is labeled. Task 4 corpus was derived from the Audioset cor-pus [3] targeting classes of sound events related to domestic applications. The labels are provided at clip level (an event is present or not within a sound clip) but without the time boundaries (weak labels, that can also be referred to as tags) in order to decrease the annotation time. These constraints indeed correspond to constraints faced in many real applica-tions where the budget allocated to annotating is limited.
In order to fully exploit this dataset, the submitted systems had to tackle two different problems. The first problem is re-lated to the exploitation of the unlabeled part of the dataset ei-ther in unsupervised approaches [4, 5] or togeei-ther with the la-beled subset in semi-supervised approaches [6, 7, 8]. The sec-ond problem was related to the detection of the time aries and how to train a system that can detect these bound-aries from weakly labeled data [9, 10]. The evaluation metric chosen was selected because it was penalizing these boundary estimation errors heavily. The goal was to encourage partici-pants to focus on the time localization aspect.
Through a detailed overview of the systems submitted to DCASE 2018 task 4 we propose an overview of some recent
advances in SED with partially annotated data1. We will first
briefly describe task 4 and the related audio corpus in Sec-tion 2. Systems performance over all classes will be presented and analyzed in Section 3. We will present a class-wise ana-lyze in Section 4 and discuss the impact of the metric chosen in Section 5. Section 6 will draw the conclusions of the paper and present some perspectives for SED.
1Additional result plots and analysis can be be found at https://
2. DCASE 2018 TASK 4 2.1. Audio dataset
The task focuses on a subset of Audioset that focuses on 10 classes of sound events [2]. Audioset consists in 10-second audio clips extracted from youtube videos[3]. The develop-ment set provided for task 4 is split into a training set and a test set.
2.1.1. Training set
In order to reflect what could possibly happen in a real-world scenario, we provide three different splits of training data in task 4 training set: a labeled training set, an unlabeled in do-main training set and an unlabeled out of dodo-main training set (clips that do not contain any of the target classes):
Labeled training set: contains 1,578 audio clips (2,244 class occurrences) for which weak labels provided in Au-dioset have been verified and corrected by human annotators. One-third of the audio clips in this set contain at least two different classes of sound events.
Unlabeled in domain training set: contains 14,412 au-dio clips. The auau-dio clips are selected such that the distri-bution per class of sound event (based on Audioset labels) is close to the distribution in the labeled set.
Unlabeled out of domain training set: is composed of 39,999 audio clips extracted from classes of sound events that are not considered in the task (according to unverified Au-dioset labels).
2.2. Test set
The test set is designed such that the distribution in term of clips per class of sound event is similar to that of the weakly labeled training set. The test set contains 288 audio clips (906 events). The test set is annotated with strong labels, with time boundaries (obtained by human annotators).
2.3. Evaluation set
The evaluation set contains 880 audio clips (3,187 events). The process to select the audio clips was similar to the process applied to select audio clips in the training set and the test set, in order to obtain a set with comparable classes distribution (See also Table 1). Labels with time boundaries are obtained by human annotators.
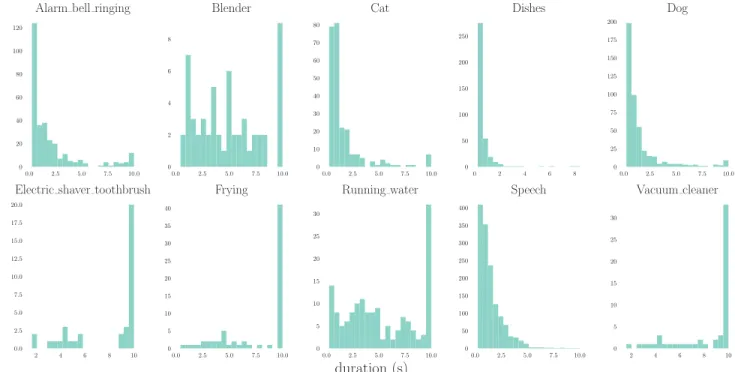
The duration distribution for each sound event class is presented on Figure 1. One of the focus of this task is the development of approaches that can provide fine time-level segmentation while learning on weakly labeled data. The ob-servation of the event duration distribution confirms that in order to perform well it is essential to design approaches that are efficient at detecting both short events and events that have a longer duration.
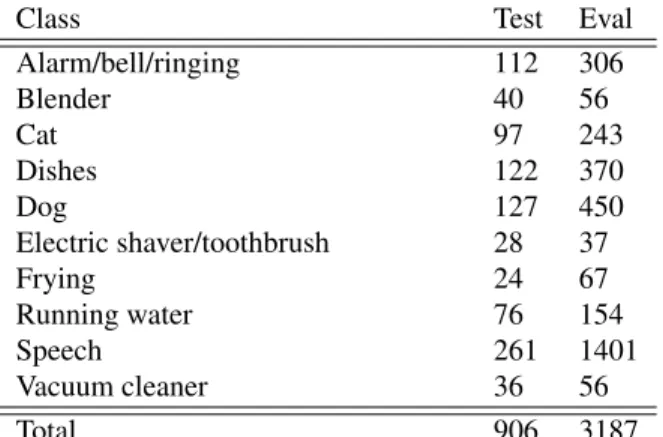
Class Test Eval
Alarm/bell/ringing 112 306 Blender 40 56 Cat 97 243 Dishes 122 370 Dog 127 450 Electric shaver/toothbrush 28 37 Frying 24 67 Running water 76 154 Speech 261 1401 Vacuum cleaner 36 56 Total 906 3187
Table 1: Number of sound events per class in the test set and the evaluation set.
2.4. Task description
The task consists of detecting sound events within web videos using weakly labeled training data. The detection within a 10-seconds clip should be performed with start and end times-tamps.
2.4.1. Task evaluation
Submissions were evaluated with event-based measures for which the system output is compared to the reference labels event by event [11] (see also Figure 2). The correspondence between sound event boundaries are estimated with a 200 ms tolerance collar on onsets and a tolerance collar on offsets that is the maximum of 200 ms and 20 % of the duration of the sound event.
• True positives are the occurrences when a sound event present in the system output corresponds to a sound event in the reference annotations.
• False positives are obtained when a sound event is present in the system output but not in the reference annotations (or not within the tolerance collars on the onset or the offset).
• False negatives are obtained when a sound event is present in the reference annotations but not in the sys-tem output (or not within the tolerance collars). Submissions were ranked according to the event-based F1-score. The F1-score was first computed class-wise over the whole evaluation set:
F 1c= 2T Pc
2T Pc+ F Pc+ F Nc, (1)
whereT Pc,F Pc andF Ncare the number of true positives,
false positives and false negative for sound event classc over
0.0 2.5 5.0 7.5 10.0 0 20 40 60 80 100 120
Alarm bell ringing
0.0 2.5 5.0 7.5 10.0 0 2 4 6 8 Blender 0.0 2.5 5.0 7.5 10.0 0 10 20 30 40 50 60 70 80 Cat 0 2 4 6 8 0 50 100 150 200 250 Dishes 0.0 2.5 5.0 7.5 10.0 0 25 50 75 100 125 150 175 200 Dog 2 4 6 8 10 0.0 2.5 5.0 7.5 10.0 12.5 15.0 17.5 20.0
Electric shaver toothbrush
0.0 2.5 5.0 7.5 10.0 0 5 10 15 20 25 30 35 40 Frying 0.0 2.5 5.0 7.5 10.0 0 5 10 15 20 25 30 Running water 0.0 2.5 5.0 7.5 10.0 0 50 100 150 200 250 300 350 400 Speech 2 4 6 8 10 0 5 10 15 20 25 30 Vacuum cleaner duration (s) coun t
Fig. 1: Duration distribution by class of sound events on the evaluation set.
Fig. 2: Event-based F1-score.
The final score is the F1-score average over sound event classes regardless of the number of sound events per class (macro-average):
F 1macro=
P c∈CF 1c
nC , (2)
where C is the sound event classes ensemble andnCthe
num-ber of sound event classes.
3. ANALYSIS OF THE PERFORMANCE OVER ALL SOUND EVENT CLASSES
In this section we present and analyze submissions perfor-mance regardless of the sound event classes.
3.1. Task submissions and results overview
DCASE 2018 task 4 gathered 50 submissions from 16 dif-ferent research teams involving 57 researchers overall. The official team ranking and some characteristics of the submit-ted systems are presensubmit-ted in Table 2. The best two
submis-sions quite clearly stand out from other submissubmis-sions. They also go beyond the rather standard approaches based con-volutional neural networks (CNN) or stacked CNN and re-current neural networks (RNN) also denoted as CRNN. The best system, submitted by JiaKai (jiakai psh) [12], relies on a mean-teacher model that exploits unlabeled data to regu-larize the classifier learned on the weakly labeled data [28]. The system submitted by Liu et al. (liu ustc) [13] that ranked second relies on an energy based sound event detection as a pre-processing to a capsule network [29]. The output of the network is then post processed to ensure that silence between events and events themselves are longer than a minimum du-ration.
Other notable submissions include the system from Koth-inti et al. (kothKoth-inti jhu) [15] that relies on a sound event detection based on restricted Boltzmann machines (RBM) as a pre-processing. This solution performs well at detecting on-sets but not so much for offset detection (see also Section 4.1). Dinkel et al. proposed a system (dinkel sjtu) that uses Gaus-sian mixture models (GMM) and hidden Markov models (HMM) to perform sound event alignment [25]. Gaussian
filtering is then used as post-processing. Pellegrini et al.
proposed a system (pellegrini irit) that relies on multiple instance learning (MIL) to exploit weakly labeled data [23]. Both these systems perform pretty decently on segmentation (see also Section 3.2) but they suffer from pretty poor sound event classification performance (see also Figure 8).
Rank System Features Classifier Parameters F1 (%)
1 jiakai psh [12] log-mel energies CRNN 1M 32.4
2 liu ustc [13] log-mel energies CRNN, Capsule-RNN 4M 29.9
3 kong surrey [14] log-mel energies VGGish 8 layer CNN 4M 24.0
4 kothinti jhu [15] log-mel energies, auditory spectrogram CRNN, RBM, cRBM, PCA 1M 22.4
5 harb tug [16] log-mel energies CRNN, VAT 497k 21.6
6 koutini jku [17] log-mel energies CRNN 126k 21.5
7 guo thu [18] log-mel energies multi-scale CRNN 970k 21.3
8 hou bupt [19] log-mel energies & MFCC CRNN 1M 21.1
9 lim etri [20] log-mel energies CRNN 239k 20.4
10 avdeeva itmo [21] log-mel energies & MFCC CRNN, CNN 200k 20.1
11 wangjun bupt [22] log-mel energies RNN 1M 17.9
12 pellegrini irit [23] log-mel energies CNN, CRNN with MIL 200k 16.6
13 moon yonsei [24] Raw wavforms RseNet, SENet 10M 15.9
14 dinkel sjtu [25] log-mel energies & MFCC CRNN, HMM-GMM 126k 13.4
15 wang nudt [26] log-mel energies & ∆ features CRNN 24M 12.6
baseline [2] log-mel energies CRNN 126k 10.8
16 raj iit [27] CQT CRNN 215k 9.4
Table 2: Team ranking and submitted systems characteristics.
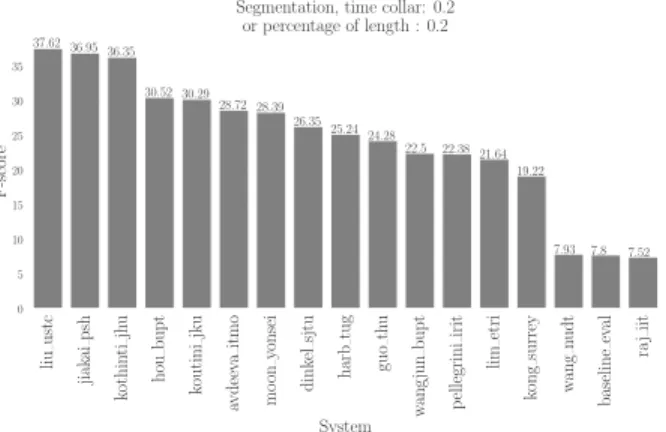
3.2. Segmentation
In this section, we focus on the segmentation performance. That is, the ability of the submitted systems to localize sound events in time without having to predict the class. Figures 3, 4 and 5 present the event-based F1-score computed without taking the sound event class labels into account and for a tol-erance collar of 200 ms, 1 s and 5 s, respectively. The fact that there is only little performance difference between the sound event detection performance (Table 2) and the segmentation performance tends to indicates that segmentation is possibly the main limiting factor in overall performance. This is ac-tually confirmed by the rather high tagging performance of most systems presented on Figure 8.
liu ustc jiak ai psh kothin ti jh u hou bupt koutini jku avdeev a itmo mo on yonsei dink el sjtu harb tug guo th u w ang jun bupt p ellegrini irit lim etri kong surrey w ang nudt baseline ev al ra j iit System 0 5 10 15 20 25 30 35 F-score 37.62 36.95 36.35 30.52 30.29 28.72 28.39 26.3525.24 24.28 22.5 22.38 21.64 19.22 7.93 7.8 7.52
Segmentation, time collar: 0.2 or percentage of length : 0.2
Fig. 3: Segmentation performance (tolerance collar on onsets is 200 ms and tolerance collar on offsets is the maximum of 200 ms and 20 % of the event length).
liu ustc jiak ai psh hou bupt koutini jku kothin ti jh u kong surrey dink el sjtu p ellegrini irit avdeev a itmo mo on yonsei harb tug guo th u w ang jun bupt lim etri w ang nudt rajiit baseline ev al System 0 10 20 30 40 50 F-score 56.3 51.9 51.61 51.42 49.24 46.51 46.3 45.89 44.14 43.86 43.69 43.41 41.1739.56 18.89 14.88 14.22
Segmentation, time collar: 1.0 or percentage of length : 0.2
Fig. 4: Segmentation performance (tolerance collar on onsets is 1 s and tolerance collar on offsets is the maximum of 1 s and 20 % of the event length).
Currently, most of the systems are able to detect if an event occurred within a rather crude time area (see also Fig-ure 5 but are not able to properly segment the audio clips in terms of sound events (see also Figure 3). The systems that performed best in terms of segmentation are the systems that actually implemented some sort of segmentation among which liu ustc [13] and kothinti jhu [15]. The winning sys-tem is ranked second in term of segmentation and owe its first overall rank to a much better classification than competing systems (see also Figure 8).
liu ustc koutini jku kothin ti jh u hou bupt jiak ai psh dink el sjtu p ellegrini irit w ang jun bupt mo on yonsei kong surrey guo th u avdeev a itmo harb tug lim etri w ang nudt rajiit baseline ev al System 0 10 20 30 40 50 60 70 F-score 74.23 71.89 71.2 70.95 70.0667.8 67.02 66.64 66.34 65.3963.5 63.15 62.87 60.71 56.23 45.62 45.08
Segmentation, time collar: 5.0 or percentage of length : 0.2
Fig. 5: Segmentation performance (tolerance collar on onsets is 5 s and tolerance collar on offsets is the maximum of 5 s and 20 % of the event length).
3.3. Use of unlabeled data
One of the challenges proposed by DCASE 2018 task 4 was to exploit a large amount of unlabeled data. In the section we analyze the approaches proposed by participants. Most of the systems submitted used a pseudo-labeling approach where a first system trained on the labeled data is used to obtain labels for the unlabeled set (liu ustc) [13], hou bupt [19]). Varia-tions on this included setting a confidence threshold to decide to keep the label or not (koutini jku [17], wang nudt [26], pellegrini irit [23], harb tug [16], moon yonsei [24]) and gradually introducing new audio clips with these pseudo la-bels (wangjun bupt [22]).
The winning system (jiakai psh [12]) used the unlabeled
data within a mean-teacher scheme [28]. It is composed
of two models: a student model and a mean-teacher model whose weights are the exponential average of the student’s
weights. On labeled data, the student model weights are
updated to optimize a classification cost on the sound event classes. Additionally, consistency costs are computed to com-pare the output of the student model and the mean-teacher model on both the labeled and the unlabeled data. Kothinti et al. (kothinti jhu [15]) proposed to use both the weakly labeled and unlabeled in-domain data to train several RBM that are used to detect sound event boundaries.
3.4. Complexity
The complexity of the submitted systems (in terms of number of parameters) is presented in Table 2. The only system that used raw waveforms as input (moon yonsei [24]) is among the most complex systems yet it is not even among the top 10 systems. This tends to indicate that the dataset proposed for task 4 is too small to train SED systems using raw wave-forms that are usually known to require a lot of training data. The most complex system (wang nudt [26]) is about 200 times more complex than the baseline in particular because
it combines several complex models. However it performs only slightly better than the baseline. The winning system (jiakai psh [12]) is about 10 times more complex than the baseline and the best performing system that has a number of parameters similar to that of the baseline (koutini jku [17]) improves the baseline F1-score performance by more than 10 % absolute.
3.5. Duration of events
It has been shown above that the systems performance largely depends on the systems ability to properly segment the
audio clips in terms of sound events. Figure 1 presents
the duration distribution for each class of sound events on
the evaluation set. From this distribution we can
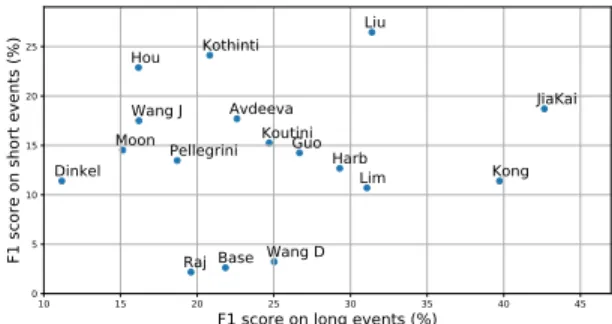
sepa-rate the sound events into two categories of events: short sound events (‘Alarm/bell/ringing’, ‘Cat’, ‘Dishes’, ‘Dog’ and ‘Speech”) and long sound events (‘Blender’, ‘Electric shaver/toothbrush’, ‘Frying’, ‘Running water’ and ‘Vacuum cleaner’).
10 15 20 25 30 35 40 45
F1 score on long events (%) 0 5 10 15 20 25 F1 sc ore on sh ort ev en ts (% ) JiaKai Liu Kong Kothinti Harb KoutiniGuo Hou Lim Avdeeva Wang J Pellegrini Moon Dinkel Wang D Base Raj
Fig. 6: Systems performance on short sound events depending on their performance on long sound events.
System Short Long All Rank
liu ustc [13] 26.4 31.4 29.9 2 kothinti jhu [15] 24.1 20.8 22.4 4 hou bupt [19] 22.9 16.2 21.1 8 jiakai psh [12] 18.7 42.6 32.4 1 avdeeva itmo [21] 17.7 22.6 20.1 10 baseline [2] 2.6 21.8 10.8 16
Table 3: Top 5 systems on short events (‘Alarm/bell/ringing’, ‘Cat’, ‘Dishes’, ‘Dog’ and ‘Speech”).
Figure 6 presents the performance of the submitted sys-tems on short sound events depending on their performance on long sound events. No system is clearly outperforming the others on both short and long sound events. This is con-firmed when looking at the top performing systems on short sound events (Table 3) and on long sound events (Table 4). These rankings tend to show that the approaches proposed
System Long Short All Rank jiakai psh [12] 42.6 18.7 32.4 1 kong surrey [14] 39.7 11.4 24 3 liu ustc [13] 31.4 26.4 29.9 2 lim etri [20] 31.1 10.7 20.4 9 harb tug [16] 29.3 12.7 21.6 5 baseline [2] 21.8 2.6 10.8 16
Table 4: Top 5 systems on long events (‘Blender’, ‘Electric shaver/toothbrush’, ‘Frying’, ‘Running water’ and ‘Vacuum cleaner’).
were either tailored to perform well on short sound events (top systems are also the systems that performed best in terms of segmentation, see also Figure 3) or on long sound events (top systems are also among the best systems in terms of tag-ging, see also Figure 8). However, in order to perform well on the SED task systems had to perform reasonably well on both short and long sound events. This is the case for the top two systems (jiakai psh [12] and liu ustc) [13]) that are in the top five both short and long sound events.
4. ANALYSIS OF THE CLASS-WISE PERFORMANCE
It have been shown above that systems performance can vary to a great extent depending on the sound events duration that is tightly related to the sound event class itself. Therefore, in this section we focus on the performance of the submitted sys-tems depending on the sound event classes. Table 5 presents the class-wise event-based F1-score for the 10 best perform-ing submitted systems. The best system (jiakai psh [12]) outperforms other systems on five sound event classes upon ten (mainly long sound events). However, it performs rather poorly on some of the remaining sound event classes (mainly short sound events). On the other hand, the second best sys-tem (liu ustc [13]) outperforms other syssys-tems on a single sound event class (‘Dog’) but is generally not too far from the best performance on several other sound event class. This explains why it can still compare with the winning system in terms of overall performance.
In general ‘Speech’ and ‘Alarm bell ringing’ seem to be the easiest sound event classes to detect and classify. This could be explained by the fact that sound events from these classes are not too short (with a median duration of 1.17 s and 0.57 s, respectively), occurs many times in the training set (in 550 clips and 205 clips, respectively) and generally have rather clear onsets and offsets (see also Section 4.1). There is a clear separation between ‘Cat’, ‘Dishes’ and ‘Dog’ and other sound event classes. The former seems more difficult to detect and classify than the latter. This can be due to the fact that sound events in these classes are short and present a large acoustic variability. Interestingly, the submitted systems that
perform best on these sound event classes are not necessar-ily among the top three systems. For example hou bupt [19] obtains the best performance on ‘Dishes’ and clearly outper-forms other submissions with 23.5 % F1-score. However, it ranked eighth overall (but was among the top five systems on short sound events, see also Table 3). The best system on ‘Cat’ (by a rather large margin) with 25.3 % F1-score is pel-legrini irit [23] that relies on MIL and that is not even in the top 10 in terms of overall performance.
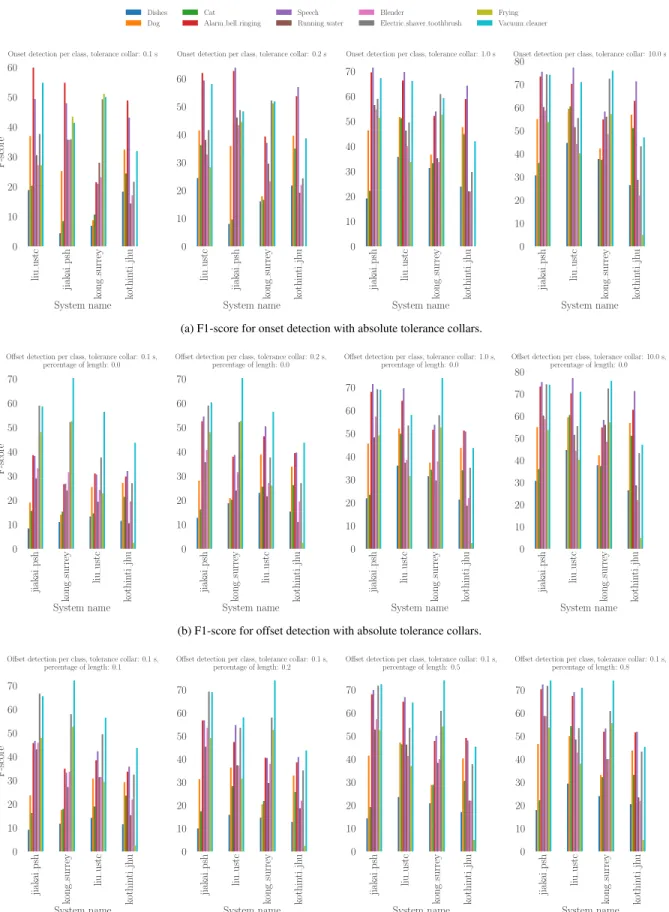
4.1. Performance on onset and offset detection
For some sound event classes that slowly decay the time lo-cation of offsets can be difficult to locate (and the concept of offset itself can even become ambiguous in reverberant sce-narios). Therefore, we now focus on the detection of onsets and offsets separately. In the plots presented in this section (see also Figure 7), sound events are classified from the short-est (on the left) to the longshort-est (on the right) according to their median duration. Additionally, for the sake of clarity, only the systems among the top four in overall performance are pre-sented here. Systems are prepre-sented in decaying overall onset or offset detection performance (the best system is on the left side).
4.1.1. Onset
Figure 7a presents F1-score for onset detection for varying
tolerance collars (in seconds). Performance generally
in-creases when the tolerance collar is increased. For small
tolerance collars, liu ustc [13] performs best which confirms previous analysis about the relatively good segmentation of their system. When the tolerance collar is larger than 0.5 s jiakai psh [12] outperforms other system which also confirm that the proposed segmentation is a bit too coarse.
The remaining errors for a 10 sec tolerance collar indicate that the systems were not able to predict how many onsets for the specific sound event class occurred within the audio clip. In most cases this could also corresponds to the case where the sound event was not detected at all (see also Figure 7b).
When looking at particular sound event classes, in gen-eral systems exhibit good onset detection performance for ‘Speech’ and ‘Alarm bell ringing’. As mentioned above, this can be due to the fact that these sound events occur frequently in the training set but it can also be related to the fact that the sound events from these classes indeed have rather clear on-sets that appear to be easier to detect. On the other hand, sound event classes as ‘Cat’ and ‘Dishes’ seem to be difficult to detect. For the former it is probably due to the fact that the onsets are not always clear as for the latter it is most gen-erally related to sound events that are simply missed by the systems because they are too short. For the remaining sound event classes, the performance varies a lot from one system to another and seems to be affected by the segmentation strategy implemented.
liu ustc jiak ai psh kong surrey kothin ti jh u System name 0 10 20 30 40 50 60 F-score
Onset detection per class, tolerance collar: 0.1 s
liu ustc jiak ai psh kong surrey kothin ti jh u System name 0 10 20 30 40 50 60
Onset detection per class, tolerance collar: 0.2 s
jiak ai psh liu ustc kong surrey kothin ti jh u System name 0 10 20 30 40 50 60 70
Onset detection per class, tolerance collar: 1.0 s
jiak ai psh liu ustc kong surrey kothin ti jh u System name 0 10 20 30 40 50 60 70 80
Onset detection per class, tolerance collar: 10.0 s Dishes
Dog
Cat Alarm bell ringing
Speech Running water
Blender
Electric shaver toothbrush
Frying Vacuum cleaner
(a) F1-score for onset detection with absolute tolerance collars.
jiak
ai
psh
kong
surrey liuustc
kothin ti jh u System name 0 10 20 30 40 50 60 70 F-score
Offset detection per class, tolerance collar: 0.1 s, percentage of length: 0.0
jiak
ai
psh
kong
surrey liuustc
kothin ti jh u System name 0 10 20 30 40 50 60 70
Offset detection per class, tolerance collar: 0.2 s, percentage of length: 0.0 jiak ai psh liu ustc kong surrey kothin ti jh u System name 0 10 20 30 40 50 60 70
Offset detection per class, tolerance collar: 1.0 s, percentage of length: 0.0 jiak ai psh liu ustc kong surrey kothin ti jh u System name 0 10 20 30 40 50 60 70 80
Offset detection per class, tolerance collar: 10.0 s, percentage of length: 0.0 Dishes
Dog
Cat Alarm bell ringing
Speech Running water
Blender
Electric shaver toothbrush
Frying Vacuum cleaner
(b) F1-score for offset detection with absolute tolerance collars.
jiak
ai
psh
kong
surrey liuustc
kothin ti jh u System name 0 10 20 30 40 50 60 70 F-score
Offset detection per class, tolerance collar: 0.1 s, percentage of length: 0.1 jiak ai psh liu ustc kong surrey kothin ti jh u System name 0 10 20 30 40 50 60 70
Offset detection per class, tolerance collar: 0.1 s, percentage of length: 0.2 jiak ai psh liu ustc kong surrey kothin ti jh u System name 0 10 20 30 40 50 60 70
Offset detection per class, tolerance collar: 0.1 s, percentage of length: 0.5 jiak ai psh liu ustc kong surrey kothin ti jh u System name 0 10 20 30 40 50 60 70
Offset detection per class, tolerance collar: 0.1 s, percentage of length: 0.8 Dishes
Dog
Cat Alarm bell ringing
Speech Running water
Blender
Electric shaver toothbrush
Frying Vacuum cleaner
(c) F1-score for offset detection with tolerance collars relative to event duration.
System Alarm Blender Cat Dishes Dog Electric Frying Water Speech Vacuum jiakai psh [12] 49.9 38.2 3.6 3.2 18.1 48.7 35.4 31.2 46.8 48.3 liu ustc [13] 46.0 27.1 20.3 13.0 26.5 37.6 10.9 23.9 43.1 50.0 kong surrey [14] 24.5 18.9 7.8 7.7 5.6 46.4 43.6 15.2 19.9 50.0 kothinti jhu [15] 36.7 22.0 20.5 12.8 26.5 24.3 0.0 9.6 34.3 37.0 harb tug [16] 15.4 30.0 8.1 17.5 9.7 21.0 34.7 17.3 31.1 31.5 koutini jku [17] 30.0 16.4 13.1 9.5 8.4 23.5 18.1 12.6 42.9 40.8 guo thu [18] 35.3 31.8 7.8 4.0 9.9 17.4 32.7 18.3 31.0 24.8 hou bupt [19] 41.4 16.4 6.4 23.5 20.2 9.8 6.2 14.0 40.6 32.3 lim etri [20] 11.6 21.6 7.9 5.9 17.4 27.8 14.9 15.5 21.0 60.0 avdeeva itmo [21] 33.3 15.2 14.9 6.3 16.3 15.8 24.6 13.3 27.2 34.8 baseline [2] 4.8 12.7 2.9 0.4 2.4 20.0 24.5 10.1 0.1 30.2
Table 5: Class-wise event-based F1-score for the top 10 submitted systems.
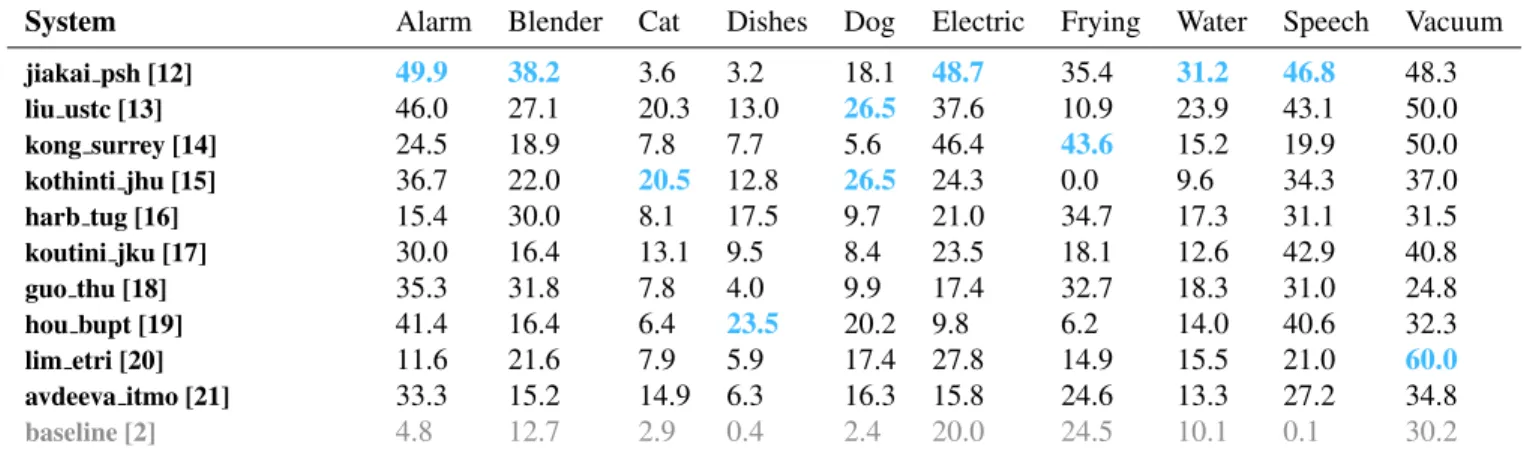
4.1.2. Offset
Figure 7b presents F1-score for offset detection for varying tolerance collars (in seconds). When comparing with Fig-ure 7a it appears that offsets are indeed more difficult to de-tect. The high F1-score for some sound event classes such as (‘Electric shaver toothbrush’, ‘Frying’ or ‘Vacuum cleaner’) is mainly due to the fact that many of the sound events in these classes do not have an offset within the audio clips and there-fore the offset to be detected is simply the final boundary of the audio clip.
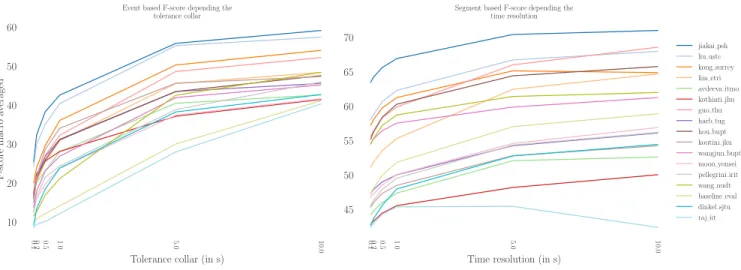
It is generally admitted that penalizing offset detection based on an absolute time tolerance collar is not a reasonable choice specially for long sound events. In particular because this type of tolerance collar might be affecting long sound events (with longer decay) much more than short (possibly percussive) sound events. Therefore, the metric retained for DCASE 2018 task 4 include both an absolute time tolerance collar and a tolerance collar that was computed as a percent-age of the sound event duration (the maximum of these two values was retained). With this approach, the absolute time tolerance collar usually applies to short sound events while the tolerance collar relative to event length applies to longer sound events.
Figure 7c presents F1-score for offset detection for vary-ing tolerance collars (in percent of the sound event duration). Note that the absolute time tolerance collar is kept to 0.1 s here in order to avoid unreasonably small tolerance collars for short sound events. As expected, this kind of tolerance collar has less effect than absolute time tolerance collar on offset de-tection of short sound events such as ‘Cat’, ‘Dishes’ or ‘Dog’ but can affect greatly the offset detection performance on long sound events such as ‘Running water’ or ‘Blender’.
Quite surprisingly, jiakai psh [12] outperforms the other submitted systems (even those which had demonstrated a bet-ter segmentation performance until now) including with low tolerance collars. When looking at particular sound event classes, in general the submitted systems exhibit good offset
detection performance for ‘Speech’ and ‘Alarm bell ringing’ even if in this case offsets are usually not as well defined as onsets were.
5. IMPACT OF THE METRIC
For DCASE 2018, the F1-score was computed in an event-based fashion in order to put on strong focus on the sound event segmentation. Class-wise performance was averaged in order to discard the effects of the sound event classes imbal-ance (2). In this section, we study the impact of these choices on the performance evaluation of the submitted systems.
5.1. F1-score computation relatively to events or seg-ments
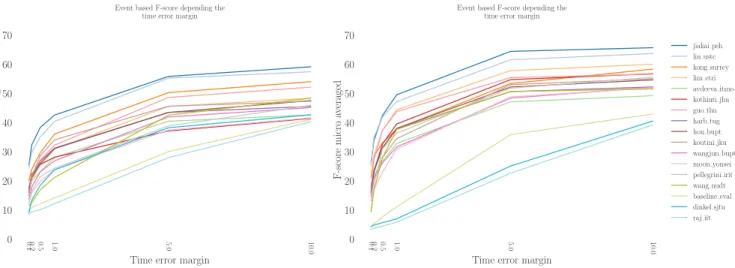
As opposed to event-based metrics, segmented-based metrics are computed by comparing the system outputs and the ref-erence on short segments. The sound event classes are then considered to be active or not on the full segment. The final metric is computed on all the segments [11]. This approach reports if a system is able to detect if a sound event class is active with a specific time resolution (the segment length) and can prove more robust than event-based metrics to phenom-ena such as short pauses between consecutive sound events. Figure 8 presents a comparison between the event-based F1-scores (on the left) and the segment-based F1-F1-scores (on the right) for varying tolerance collars and time resolutions, re-spectively.
As expected, segmented-based metrics are more permis-sive to errors in the detection of the sound event boundaries. Indeed the reported segment-based F1-scores (from 40 % to 70 % depending on the time resolution) are much higher than their event-based counterpart (from 5 % to 60 % depending on the tolerance collar). Additionally, the segment-based F1-score seems to be favoring systems that are good at tagging while event-based F1-score favors systems that have good segmentation performance. This is particularly clear for
sys-0.1 0.2 0.5 1.0 5.0 10.0
Tolerance collar (in s) 10 20 30 40 50 60 F-score macro av eraged
Event based F-score depending the tolerance collar
0.1 0.2 0.5 1.0 5.0 10.0
Time resolution (in s) 45 50 55 60 65 70
Segment based F-score depending the time resolution jiakai psh liu ustc kong surrey lim etri avdeeva itmo kothinti jhu guo thu harb tug hou bupt koutini jku wangjun bupt moon yonsei pellegrini irit wang nudt baseline eval dinkel sjtu raj iit
Fig. 8: Comparison between event-based and segmented-based F1-scores depending on the tolerance collar and time resolution, respectively.
tems like hou bupt [19], guo thu [18] and the task base-line [2] which perform much better in terms of segment-based F1-score and for kothinti jhu [15] that performs much better in terms of event-based F1-score.
When the time resolution for the segment-based F1-scores is 10 s the reported performance is actually that of a tagging task. The tagging ranking is then rather different than the gen-eral ranking (see also Table 2) and the ranking for segmenta-tion (see also Figure 3). This emphasizes once again that none of the submitted systems is actually outperforming others in both segmentation and tagging but that in order to perform well on the task, systems had to perform at least decently on both. This is the case for jiakai psh [12] and liu ustc [13] that clearly stand out in the final ranking.
As the choice of the metric is tightly related to the tar-geted application, some approaches can be better suited when you need to know exactly when a sound event from a specific class did occur (in which case you might select a system that performs well in terms event-based F1-score) some other approaches can be suited to monitor the activity within a time period (approximately when was each sound event class active, depending on the time resolution, in which case we might select systems that perform well in terms segment-based F1-score)
5.2. Micro average
While macro-averaging (used in task 4) computes the final F1-score as the average across sound event classes (regardless of the number of events for each class), micro-averaging com-putes the final F1-score as the average of each single decision. It therefore gives more importance to sound event classes that occur more frequently (see also Table 1 for the distribution). For example, ‘Speech’ events will account for almost half of the performance when using micro-averaged F1-score.
Figure 9 presents event-based F1-score depending on the averaging method. We can observe a clear performance im-provement between macro-averaged and micro-average F1-score for the systems that performed well the most frequent sound event classes (‘Alarm bell ringing’, ‘Dishes’, ‘Dog’ or ‘Speech’) such as lim etri [20]. One the other hand the sys-tems that were able to perform well on less frequent sound event classes (‘Electric shaver/toothbrush’, ‘Frying’. . . ) but not on frequent sound event classes can see their performance decreased between macro-averaged and micro-averaged F1-score as this is the case for kong surrey [14]. The top two systems (jiakai psh [12] and liu ustc) [13]) were performing reasonably well on the most frequent sound event classes and therefore still outperform other systems in terms of micro-averaged F1-score.
Once again, the choice of the metric is related to the tar-geted application. If you want to detect mainly the sound event classes that occur the most frequently and that miss-ing rare sound event classes is not really a problem then you should select approaches that perform well in terms of micro-averaged F1-score. On the contrary if detecting rare sound event classes is important then approaches that perform well in terms of macro-averaged F1-score seem better suited.
6. CONCLUSION
In this paper we proposed an overview of some of the latest advances and challenges in sound event detection with sys-tems trained on partially annotated data through the analysis of the results of DCASE 2018 challenge task 4. The paper focused on the scientific aspects highlighted by the task: ex-ploiting both unlabeled and weakly labeled data to train a sys-tem that provides not only the event class but also the event time boundaries. It has been shown that both the
segmen-0.1 0.2 0.5 1.0 5.0 10.0
Time error margin 0 10 20 30 40 50 60 70 F-score macro av eraged
Event based F-score depending the time error margin
0.1 0.2 0.5 1.0 5.0 10.0
Time error margin 0 10 20 30 40 50 60 70 F-score micro av eraged
Event based F-score depending the time error margin
jiakai psh liu ustc kong surrey lim etri avdeeva itmo kothinti jhu guo thu harb tug hou bupt koutini jku wangjun bupt moon yonsei pellegrini irit wang nudt baseline eval dinkel sjtu raj iit
Fig. 9: Event-based F1-score depending on the class averaging method.
tation and the classification ability play an important role in the final performance. However whereas the tagging perfor-mance (related to the classification ability) is generally rather good for many systems, only few systems did implement an explicit segmentation strategy. This aspect actually remains quite challenging as training a system to detect sound events and predict their time localization from weakly labeled data is far from trivial. Therefore, one question for future works is to investigate if strongly labeled data that is generated syntheti-cally can help solving this issue. This is one of the challenges investigated in the task 4 of DCASE 2019 challenge.
7. ACKNOWLEDGMENT
The authors would like to thank the other organizers of DCASE 2018 task 4 (Hamid Eghbal-zadeh from Johannes Kepler University – Austria and Ankit Parag Shah from Carnegie Mellon University –United States) as well as all participants to the task. They also would like to thank the DCASE 2018 challenge organization team ( Toni Heittola, Annamaria Mesaros and Tuomas Virtanen from Tampere University of Technology – Finland) for they support while organizing the task.
8. REFERENCES
[1] Tuomas Virtanen, Mark D Plumbley, and Dan Ellis, Computational analysis of sound scenes and events, Springer, 2018.
[2] Romain Serizel, Nicolas Turpault, Hamid Eghbal-Zadeh, and Ankit Parag Shah, “Large-scale weakly la-beled semi-supervised sound event detection in
domes-tic environments,” in Proc. DCASE2018, November
2018, pp. 19–23.
[3] Jort F. Gemmeke, Daniel P. W. Ellis, Dylan Freedman, Aren Jansen, Wade Lawrence, R. Channing Moore, Manoj Plakal, and Marvin Ritter, “Audio set: An on-tology and human-labeled dataset for audio events,” in Proc. ICASSP, 2017.
[4] J. Salamon and J. P. Bello, “Unsupervised feature learn-ing for urban sound classification,” in 2015 IEEE In-ternational Conference on Acoustics, Speech and Signal Processing (ICASSP), 2015.
[5] Aren Jansen, Manoj Plakal, Ratheet Pandya, Dan El-lis, Shawn Hershey, Jiayang Liu, Channing Moore, and Rif A. Saurous, “Unsupervised learning of semantic au-dio representations,” in Proc. ICASSP, 2018.
[6] Z. Zhang and B. Schuller, “Semi-supervised learning helps in sound event classification,” in Proc. ICASSP, 2012, pp. 333–336.
[7] Tatsuya Komatsu, Takahiro Toizumi, Reishi Kondo, and Yuzo Senda, “Acoustic event detection method using semi-supervised non-negative matrix factorization with a mixture of local dictionaries,” in Proc. DCASE), 2016, pp. 45–49.
[8] B. Elizalde, A. Shah, S. Dalmia, M. H. Lee, R. Badlani, A. Kumar, B. Raj, and I. Lane, “An approach for self-training audio event detectors using web data,” in Proc. EUSIPCO, 2017, pp. 1863–1867.
[9] A. Kumar and B. Raj, “Audio event detection using
weakly labeled data,” CoRR, vol. abs/1605.02401, 2016. [10] A. Kumar and B. Raj, “Audio event and scene recog-nition: A unified approach using strongly and weakly labeled data,” in Proc. IJCNN. IEEE, 2017, pp. 3475– 3482.
[11] Annamaria Mesaros, Toni Heittola, and Tuomas Virta-nen, “Metrics for polyphonic sound event detection,” Applied Sciences, vol. 6, no. 6, pp. 162, May 2016. [12] Lu JiaKai, “Mean teacher convolution system for dcase
2018 task 4,” Tech. Rep., DCASE2018 Challenge,
September 2018.
[13] Yaming Liu Liu, Jie Yan, Yan Song, and Jun Du, “Ustc-nelslip system for dcase 2018 challenge task 4,” Tech. Rep., DCASE2018 Challenge, September 2018. [14] Qiuqiang Kong, Iqbal Turab, Xu Yong, Wenwu Wang,
and Mark D. Plumbley, “DCASE 2018 challenge base-line with convolutional neural networks,” Tech. Rep., DCASE2018 Challenge, September 2018.
[15] Sandeep Kothinti, Keisuke Imoto, Debmalya
Chakrabarty, Sell Gregory, Shinji Watanabe, and Mounya Elhilali, “Joint acoustic and class inference for weakly supervised sound event detection,” Tech. Rep., DCASE2018 Challenge, September 2018.
[16] Robert Harb and Franz Pernkopf, “Sound event
de-tection using weakly labeled semi-supervised data with gcrnns, vat and self-adaptive label refinement,” Tech. Rep., DCASE2018 Challenge, September 2018. [17] Khaled Koutini, Hamid Eghbal-zadeh, and Gerhard
Widmer, “Iterative knowledge distillation in r-cnns for weakly-labeled semi-supervised sound event detection,” Tech. Rep., DCASE2018 Challenge, September 2018. [18] Yingmei Guo, Mingxing Xu, Jianming Wu, Yanan
Wang, and Keiichiro Hoashi, “Multi-scale
convolu-tional recurrent neural network with ensemble method for weakly labeled sound event detection,” Tech. Rep., DCASE2018 Challenge, September 2018.
[19] Yuanbo Hou and Shengchen Li, “Semi-supervised
sound event detection with convolutional recurrent neu-ral network using weakly labelled data,” Tech. Rep., DCASE2018 Challenge, September 2018.
[20] Wootaek Lim, Sangwon Suh, and Youngho Jeong, “Weakly labeled semi-supervised sound event
detec-tion using crnn with incepdetec-tion module,” Tech. Rep.,
DCASE2018 Challenge, September 2018.
[21] Anastasia Avdeeva and Iurii Agafonov, “Sound
event detection using weakly labeled dataset with
con-volutional recurrent neural network,” Tech. Rep.,
DCASE2018 Challenge, September 2018.
[22] Wang Jun and Li Shengchen, “Self-attention mechanism based system for dcase2018 challenge task1 and task4,” Tech. Rep., DCASE2018 Challenge, September 2018.
[23] leo Cances, Thomas Pellegrini, and Patrice Guyot,
“Sound event detection from weak annotations:
Weighted gru versus multi-instance learning,” Tech.
Rep., DCASE2018 Challenge, September 2018. [24] Moon Hyeongi, Byun Joon, Kim Bum-Jun, Jeon
Shin-hyuk, Jeong Youngho, Park Young-cheol, and
Park Sung-wook, “End-to-end crnn architectures for
weakly supervised sound event detection,” Tech. Rep., DCASE2018 Challenge, September 2018.
[25] Heinrich Dinkel, Yanmin Qiand, and Kai Yu, “A hybrid asr model approach on weakly labeled scene classifica-tion,” Tech. Rep., DCASE2018 Challenge, September 2018.
[26] Dezhi Wang, Kele Xu, Boqing Zhu, Lilun Zhang, Yux-ing Peng, and Huaimin Wang, “A crnn-based system with mixup technique for large-scale weakly labeled sound event detection,” Tech. Rep., DCASE2018 Chal-lenge, September 2018.
[27] Rojin Raj, Shefali Waldekar, and Goutam Saha, “Large-scale weakly labelled semi-supervised cqt based sound event detection in domestic environments,” Tech. Rep., DCASE2018 Challenge, September 2018.
[28] Antti Tarvainen and Harri Valpola, “Mean teachers are better role models: Weight-averaged consistency tar-gets improve semi-supervised deep learning results,” in Proc. NIPS, 2017, pp. 1195–1204.
[29] Sara Sabour, Nicholas Frosst, and Geoffrey E Hinton, “Dynamic routing between capsules,” in Proc. NIPS, 2017, pp. 3856–3866.