Publisher’s version / Version de l'éditeur:
Vous avez des questions? Nous pouvons vous aider. Pour communiquer directement avec un auteur, consultez la première page de la revue dans laquelle son article a été publié afin de trouver ses coordonnées. Si vous n’arrivez pas à les repérer, communiquez avec nous à PublicationsArchive-ArchivesPublications@nrc-cnrc.gc.ca.
Questions? Contact the NRC Publications Archive team at
PublicationsArchive-ArchivesPublications@nrc-cnrc.gc.ca. If you wish to email the authors directly, please see the first page of the publication for their contact information.
https://publications-cnrc.canada.ca/fra/droits
L’accès à ce site Web et l’utilisation de son contenu sont assujettis aux conditions présentées dans le site LISEZ CES CONDITIONS ATTENTIVEMENT AVANT D’UTILISER CE SITE WEB.
POAC 81. The 6th International Conference on Port Ocean Engineering Under
Artic Conditions, 1, pp. 225-234, 1981
READ THESE TERMS AND CONDITIONS CAREFULLY BEFORE USING THIS WEBSITE. https://nrc-publications.canada.ca/eng/copyright
NRC Publications Archive Record / Notice des Archives des publications du CNRC :
https://nrc-publications.canada.ca/eng/view/object/?id=77be0590-97ed-4366-999e-f2d1a87a543e
https://publications-cnrc.canada.ca/fra/voir/objet/?id=77be0590-97ed-4366-999e-f2d1a87a543e
NRC Publications Archive
Archives des publications du CNRC
This publication could be one of several versions: author’s original, accepted manuscript or the publisher’s version. / La version de cette publication peut être l’une des suivantes : la version prépublication de l’auteur, la version acceptée du manuscrit ou la version de l’éditeur.
Access and use of this website and the material on it are subject to the Terms and Conditions set forth at
Mid-winter mechanical properties of ice in the Southern Beaufort Sea
Frederking, R. M. W.
National Research Conseil national
Ser
Council Canada de recherches CanadaTH1
N21d
MID-WINTER MECHANICAL PROPERTIES O F ICE IN THE SOUTHERN BEAUFORT S E A by R. M. W. Frederking
ANALYZED
s
( 7 ~4
L.7
d
Reprinted f r o m Vol. 1, POAC 81
P r o c . Sixth Int. Conf. o n P o r t and Ocean Engineering under A r c t i c Conditions Quebec City, 27
-
31 July 1981p. 225
-
234 DBR P a p e r No. 1005 D i v i s i o n of Building R e s e a r c h J N R G-
C I S T IBLDG.
RES.
I'
L I B R A R Y
81-
12-
1
4
B I B L I O T H ~ Q U E
c'Rech.
'-
Batim.
1C1ST P r i c e $1.00 OTTAWA NRCC 19752SOMMAI
RE
Pendant les essais du brise-glace ITCANMAR
KIGORIAKu durant lfhiver
1979-1980, on a mesure -1es
proprietes de la glace de la banquise
catisre prss de McKinley Bay dans le Sud de la mer de Beaufort. On
a effectu6 des analyses cristallographiques pour d6terminer le type
de glace et sa structure, 6tablir des profils de temp6rature et de
salinit6 et r6aliser des essais de r6sistance 2 la compression axi-
ale et llessai
br6silien.
Le travail a btb effectue
B
bord du
brise-glace pendant les essais.
Parmi les echantillons testes, il
y avait des glaces de premisre annee et de glaces comprimees de-
puis de nombreuses ann6es.
On trouvera dans cette etude les des-
criptions des techniques de mesure et df6chantillonage.
Les valeurs
de r6sistance obtenues sont compar6es selon les conditions dfessais
(salinit6, charge, structure des cristaux, orientation de lfbchant-
illon, et position de 116chantillon
dans la couche de glace).
Les
r6sultats sont en g6n6ral voisins de ceux de la litt6rature trait-
ant d4 sujet.
MID-WINTER MECHANICAL PROPERTIES OF ICE IN THE S O W R N BEAUPORT SEA
p.~~,\:yZ2&'
R.M.W. Frederking Geotechnical SectionResearch Officer Division of Building Research,
C.W. Timco Hydraulics Laboratory Canada
Research Officer Division of Mechanical Engineering, National Research Council of Canada Ottawa. Ontario, KIA OR6 Canada
Ice property measurements were carried out during ice breaking trials of the "CANMAR KIGORIAK" during the winter of 1979-80, primarily in landfast ice in the Southern Beaufort Sea in the vicinity of McKinley Bay. They included crystallographic analysis to establish ice type and structure, temperature and salinity profiles, and ufiaxial compresSion and "Brazil" strength tests. The work was performed.on board ship at the time of the trials.
The ice under study included samples of first-year ice covers and multi-year pressure ridges. Sampling and measurement techniques are described. The strength results are discussed in terms of salinity, loading rate, grain structure, sample orientation and position in the ice cover. Strength results were found to agree generally with values in the literature.
In assessing the ice breaking performance of vessels it is necessary to have a complete knowledge of ice properties. Thickness, temperature, salinity where applica- ble, friction coefficient and flexural strength are normally of interest. In January 1980 the National Research Council of Canada collaborated with Dome Petrol- Ltd. during the ice breaking trials of the Canmar Kigoriak in a program that included grain fabric analysis to determine ice structure, type, grain size and orientation; ice temperature and salinity measurements for brine volume determinations; and compressive and "Brazil" strength tests. Measurements were carried out at the time of the trials in an improvised cold room on board ship.
The primary test area was in the Southern Beaufort Sea in the vicinity of McKinley Bay. The ice cover in this area was dynamic, with frequent movements into December, but it was landfast at the time of the January trials. Samples of ice from the trials area (first-year ice) were analysed, as was multi-year ice collected during a probe into the polar pack in October 1979. Measuring techniques are described. selected data presented, and strength results discussed in terms of salinity, loading rate, grain structure, and position in the ice cover. Complete results of the measurements appear in an earlier report [I].
Experimental Procedures
A total of 17 vertical cores of first-year sea ice were collected and analysed. Core diameter was 75 mm. In some cases temperatures and salinities were measured along the core immediately after retrieval in order to obtain representative profiles through the ice cover. Initial analysis involved a visual description of the core, including ice colour, air bubble content, brine drainage channels and sediment bands. Following this a decision was made on the further analyses to be performed. The cores were then marked and cut into appropriately sized pieces depending on whether
specimens for thin section studies, salinity or strength measurements were required. All work was done in the improvised cold room on board ship, where temperature was a few degrees warmer than the ambient temperature, which ranged from -35 to -2S°C.
Thin sections were made to determine general grain structure, size and orienta- tion. A warming plate was used to prepare the thin sections, which were observed and photographed between crossed polaroids.
The compression and Brazil tests were done on a 50 kt4 capacity, motorized screw- drive test machine (Figure 1). Although this press is capable of cross-head rates from 3 x to 5 x lo-' m / s , only a nominally constant rate of 3 x m / s was used for these tests. Load was measured with a 50 kN capacity load cell and recorded continuously. The ends of the specimens were cut on a band saw, care being taken to make the ends perpendicular to the axis of the cylinder, parallel to each other and flat. Compression specimens were typically 120 mm long'by 75 mm diameter cylinders.
No further end preparation was done, other than brushing the cylinder clean. The length and diameter of each specimen were measured. "Maraseto' compliant platens (2) were used to minimize the effect of irregularities and to reduce the radial stresses at the ends of the specimens. Loading was monotonic to yield or brittle failure. Strength was calculated from the maximum load each specimen was able to support and its cross-sectional area. From the continuous records of load versus time, loading stress rates [3] were determined for each test. The Brazil tests were performed on cylinders about 30 mm long by 75 mm in diameter. Load was applied perpendicular to the axis of the cylinder. Brazil strength, aB, was calculated using
P
1
aB = 2K - where K is concentration Endfactor (assumed to be 6 in this case). Figure 1
P is failure load, E is length, and Loading frame of test machine showing d diameter. After testing, the salinity of compression Sample between compliant
platens each specimen was measured.
I
Results and DiscussionNumerical results of over 6 0 strength tests conducted on samples of first-year
i
sea ice are presented in Tables I and 11. As all specimens were obtained fromI vertical cores, the loading direction was parallel to the ice growth direction for
i
compression tests, and perpendicular to ice growth direction for Brazil tests.i All the compression tests were run at a nominal strain rate of 2.5 x S-I and
I a temperature of -26 ?l0C. It should be borne in mind that the test temperatures were
much lower, particularly for the deeper samples, than the naturally occurring
I
temperatures in the ice cover. Several trends were apparent from the results. First. there is a general increase in strength with increasing sample depth in the ice cover.
, Secondly, there is a pattern of ductile yield in the upper part of the ice cover and
'
brittle failure in the lower part. Figure 2 illustrates a thin section of a typical core. Grain structure analysis showed the upper part of the ice cover to be m a l l - grained (approximately 2 mn diameter) granular ice, and the lower part to be larger- grained (approximately 10 mm diameter) columnar-grained ice. A typical temperature
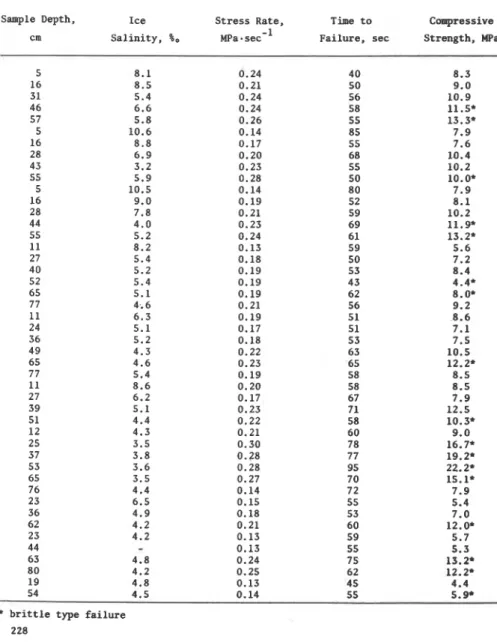
TABLE I. Uniaxial Compression Tests
-
First-Year Ice Vertical Cores Test temperature = -26'C; Stress rate = 0.13-
0.30 MPa-sec-l;Strain rate = 2.5 x sec-' (nominal)
Sample Depth, Ice Stress Rate, Time to Compressive
cm Salinity, %. M P ~ . sec-' Failure, sec Strength, MPa,
5 8.1 0.24 40 8.3 16 8.5 0.21 50 9.0 31 5.4 0.24 56 10.9 46 6.6 0.24 58 11.5. 57 5.8 0.26 55 13.3' 5 10.6 0.14 85 7.9 16 8.8 0.17 55 7.6 28 6.9 0.20 68 10.4 43 3.2 0.23 55 10.2 55 5.9 0.28 50 10.0' 5 10.5 0.14 80 7.9 16 9.0 0.19 52 8.1 28 7.8 0.21 59 10.2 44 4.0 0.23 69 11.9' 55 5.2 0.24 61 13.2' 11 8.2 0.13 59 5.6 27 5.4 0.18 50 7.2 40 5.2 0.19 53 8.4 52 5.4 0.19 43 4.4. 65 5.1 0.19 62 8.0. 77 4.6 0.21 56 9.2 11 6.3 0.19 51 8.6 24 5.1 0.17 51 7.1 36 5.2 0.18 53 7.5 49 4.3 0.22 63 10.5 65 4.6 0.23 65 12.2. 77 5.4 0.19 58 8.5 11 8.6 0.20 58 8.5 27 6.2 0.17 67 7.9 39 5.1 0.23 71 12.5 51 4.4 0.22 58 10.3' 12 4.3 0.21 60 9.0 25 3.5 0.30 78 16.7' 37 3.8 0.28 77 19.2. 53 3.6 0.28 95 22.2' 65 3.5 0.27 70 15.1' 76 4.4 0.14 7 2 7.9 23 6.5 0.15 55 5.4 36 4.9 0.18 53 7.0 62 4.2 0.21 60 12.0. 23 4.2 0.13 59 5.7 44
-
0.13 55 5.3 63 4.8 0.24 75 13.2' 80 4.2 0.25 62 12.2' 19 4.8 0.13 45 4.4 54 4.5 0.14 55 5.9.'
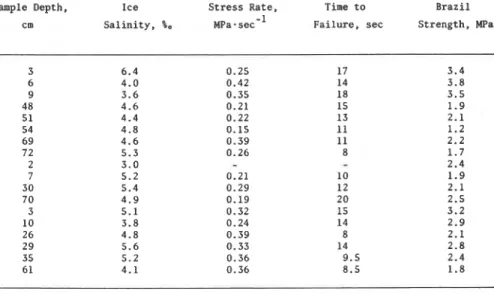
brittle type failure 228TABLE 11. Brazil Tests
-
First-Year Ice Vertical Cores Test temperature = -20°C; Stress rate = 0.15-
0.42 MPaasec - 1Sample Depth, Ice Stress Rate. Time to Brazil
cm Salinity, %. ~~a.sec-' Failure, sec Strength. MPa
and salinity profile is given in Figure 3. In general, the top 20 cm of the core had an average salinity of 10-15%. and the remainder an average salinity of 5-6%.. Similar profiles have been observed for first-year sea ice in the Beaufort Sea [4].
Brine volume is often used as an independent variable in evaluating the strength properties of sea ice [5]. The compressive strength results have been presented on
this basis in Figure 4a. A gradual decrease in strength with increasing brine volume
is evident, but it is not particularly strong. Recent investigations of the
mechanical properties of ice have shown that they are load history dependent [3]. The
same results, plotted versus stress rate in Figure
bb,
show less scatter and indicatea trend towards increasing strength with increasing stress rate.
Peyton [6] has found a similar strength trend for first-year sea ice. The speci- mens have been categorized in two groups to make comparison with Peyton's results easier: "top ice," granular ice from the top 20 cm of the ice cover; and "bottom ice," large-grained, columnar-grained ice from the lower part of the ice cover. Also shownin
Figure 4 are strength values of multi-year ice [7]. In terms of brine volume, multi-
year ice is weaker than first-year sea ice, whereas in terms of stress rate its strength is indistinguishable from that of first-year sea ice. The strong influence
S A L I N I T Y , oloo
-
S A L I N I T Y 4 0 i 5 0 a- T E M P E R A T U R E . T E M P E R A T U R E . " C Figure 3Typical temperature and s a l i n i t y p r o f i l e o f f i r s t - y e a r sea i c e , Beaufort Sea, January 1980
Figure 2
Vertical t h i n s e c t i o n o f f i r s t - y e a r sea i c e showing grain structure v a r i a t i o n s with depth
:
.+ 0 >.+ 0 1 c "l .rl *P e I 0 - 4 a-
x*
"2 > . C N u Me, aJfi
2
e, c "l .rl 0*
> 4J .rl "l "l "ld a d*
CB.Z
0 0 u cof stress rate on compressive strength shows the importance of this factor in compar- ing the strength values reported by various investigators.
With regard to the Brazil tests, the results indicate strengths of the order of
3 MPa for granular ice and 2 MPa for columnar ice. This is in good agreement with
other measurements of Brazil strength for sea ice of comparable brine volume [ 8 ] .
Figure 5a presents the stress-time curves from two tests; the solid line illustrates ductile yield of granular ice, the dashed line, brittle failure of columnar-grained ice. Also shown are straight lines approximating the loading stress
rate for each case. Sinha [9] has suggested that it is possible, with an appropriate
rheological model and a knowledge of ice characteristics (temperature and grain size), to generate a stress-strain curve from stress history. This approach has been applied to the actual stress histories shown in Figure 5a. and the resulting stress-strain curves are presented in Figure 5b. Unfortunately, strains were not measured during
Figure 5
Representative stress histories (a) and calculated stress-strain responses (b)
for first-year sea ice, -26'C (solid line - , 2 mm grain diameter; dashed
line - - -, 10 mm grain diameter)
the tests now reported so that it is not possible to verify these predictions. Peyton [6] indicated strain modulus values of up to 5 GPa at a temperature of -21°C and loading rates comparable to those shown in Figure 5 , indicating that the predictions are of the right order. There is a real need, however, for stress-strain-time data to help in developing a constitutive equation for sea ice that takes into account grain structure and size, temperature, and salinity. In future field tests it is planned to obtain strain-time in addition to stress-time data.
Conclusions
(1) Compressive strength and Brazil strength values determined in this study show general agreement with comparable data in the literature.
(2) Compressive strength and failure behaviour of vertically loaded specimens of first-year sea ice vary through the depth of the ice cover in a systematic fashion that appears to be related more to grain structure than to salinity or brine volume, at least for test temperatures less than -20°C.
(3) Stress rate appears to be an appropriate basis for the measurement andinterpreta- tion of compressive strength under relatively uncontrolled field test conditions.
(4) Measurements of ice characteristics and properties can be carried out successful4 on board ship in improvised facilities, thereby reducing the problems associated with transporting ice samples to "southern" laboratories.
Acknowledgements
The authors wish to thank Dome Petroleum Ltd. for the opportunity of participat- ing in the ice-breaking trials of the Canmar Kogoriak. The logistic, transportation, and accommodation support provided by Canmar made the involvement possible. Finally, the encouragement, moral support and aid of the trials team, Captain, cook and crew are gratefully acknowledged.
This paper is a joint contribution from the Divisions of Building Research and Mechanical Engineering. National Research Council of Canada, and is published with the approval of the Directors of the Divisions.
References
[l] Frederking, R.M.W., and Timco, G.W. NRC ice property measurements during the CANMAR KIGORIAK trials in the Beaufort Sea. Winter 1979-80. National Research Council of Canada, Division of Building Research. NRCC 18722. 1980. 63 p. [2] IAHR Section on Ice Problems, Working Group on Standardizing Testing Methods in
Ice. Standardized testing metl~ods for measuring mechanical prwperties of ice (in press)
[3] Sinha, N.K. Rate sensitivity of compressive strength of c o l w - p a i n e d h.
Presented at Spring Meeting. Society of Experimental Stress Analysis. San Francisco. California, 20-25 May 1980.
[4] Martin, S. A field study of brine drainage and oil entrapment in first-y0e.r ice, J. Glaciol., Vol. 22, No. 80, 1979, p. 473-502.
[S] Weeks, W., and Assur. A. The mechanical properties of ice. U.S. Army Cold Regions Research and Engineering Laboratory, Hanover, N.H., Monograph 11-C3,
1967.
[6] Peyton, H.R. Sea ice strength. Geophysical Institute, University of Alaska. Report No. UAG R-182, 1966.
[7] Timco. G.W. and Frederking, R.M.W. Compressive strength of multi-year ridge ice. Proceedings, Workshop on Sea Ice Ridges, Calgary, 22-24 October 1980.
[8] Frankenstein. G.E. Ring tensile strength studies of ice. U.S. Army Cold Regions Research and Engineering Laboratory. Hanover. N.H., Tech. Report 172, 1967. [9] Sinha. N.K. Constant stress rate deformation modulus of ice. To be presented
This publication is being distributed by the Division of Building R e s e a r c h of the National R e s e a r c h Council of Canada. I t should not be reproduced in whole o r in p a r t without p e r m i s s i o n of the original publisher. The Di- vision would b e glad to b e of a s s i s t a n c e in obtaining such permission.
Publications of the Division m a y b e obtained by m a i l - ing the a p p r o p r i a t e r e m i t t a n c e ( a Bank, Express, o r P o s t Office Money Order, o r a cheque, m a d e payable t o the Receiver General of Canada, c r e d i t NRC) t o the National R e s e a r c h Council of Canada, Ottawa. K1A OR6
.
Stamps a r e not acceptable.A lie t of a l l publications of the Division i s available and m a y be obtained f r o m the Publications Section, Division of Building Research, National R e s e a r c h Council of Canada. Ottawa. KIAOR6.